. 2025 May 20;23(1):562.
doi: 10.1186/s12967-025-06555-7.

YY1-induced DDX18 modulates EMT via the AKT/mTOR pathway in esophageal cancer: a novel therapeutic target

Affiliations

YY1-induced DDX18 modulates EMT via the AKT/mTOR pathway in esophageal cancer: a novel therapeutic target

Xiaochao Ma et al. J Transl Med. .

Abstract

Background: Esophageal cancer is the 11th most common malignancy and the 7th leading cause of cancer-related death globally. Identifying key molecules and underlying mechanisms in the progression of esophageal cancer represents an effective strategy for developing novel therapeutic approaches.

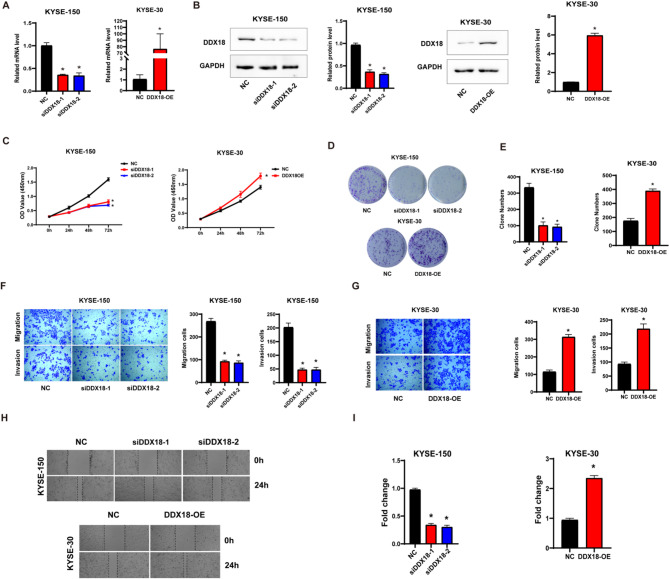
Methods: DDX18 expression in clinical specimens was evaluated by immunohistochemistry and western blot analysis. Functional assays were performed in cells with either DDX18 knockdown or overexpression. Dual luciferase reporter assays and chromatin immunoprecipitation (ChIP) were conducted to validate the interaction between YY1 and the DDX18 promoter. A xenograft tumor model was utilized to investigate the role of DDX18 in vivo in esophageal cancer.

Results: DDX18 was found to be markedly overexpressed in esophageal cancer, with its levels significantly higher in patients with pathological grade III compared to those with grades I-II. In vitro, DDX18 enhanced cell proliferation, migration, and invasion, while concurrently suppressing apoptosis. Furthermore, DDX18 promoted epithelial-mesenchymal transition (EMT) and activated the AKT/mTOR signaling pathway. The use of AKT inhibitors effectively abrogated the oncogenic effects of DDX18. Dual luciferase and ChIP assays confirmed that YY1 binds to and stimulates DDX18 transcription. In rescue experiments, YY1 countered the inhibitory effects of DDX18 knockdown on cell proliferation, EMT, and AKT/mTOR activation. In vivo, DDX18 knockdown resulted in reduced tumor growth.

Conclusions: The transcription of DDX18 was activated by YY1, and DDX18 promoted tumor cell growth and EMT through the AKT/mTOR signaling pathway in esophageal cancer cells.

Keywords: DDX18; Apoptosis; EMT; Esophageal cancer; Transcription factor.


Conflict of interest statement

Declarations. Ethics approval and consent to participate: This research study was approved by the Institutional Review Board of The First Hospital of Jilin University. Consent for publication: Not applicable. Competing interests: The authors declare that they have no competing interests.

Figures

Fig. 1
Fig. 1
DDX18 was upregulated in esophageal cancer. (A) Immunohistochemical analysis of DDX18 expression in a tissue array comprising 45 esophageal cancer tissues and 45 adjacent non-tumor tissues. (B) qPCR analysis of DDX18 mRNA expression in 24 paired esophageal cancer and adjacent non-tumor tissues. (C) Western blot analysis of DDX18 protein expression, with GAPDH as the loading control. (D) qPCR detection of DDX18 mRNA levels in human esophageal cancer cell lines KYSE-150, TE-1, KYSE-450, KYSE-140, and KYSE-30. (E) Western blot analysis of DDX18 protein expression in esophageal cancer cell lines, with GAPDH as the loading control. * P < 0.05
Fig. 2
Fig. 2
DDX18 promoted the proliferation, migration, and invasion in esophageal cancer cells. (A) KYSE-150 and KYSE-30 cells were transfected with DDX18 siRNA and DDX18 overexpression plasmid, respectively. qPCR was performed to assess DDX18 expression levels. (B) Western blot analysis of DDX18 protein expression. (C) Cell viability was evaluated using the CCK-8 assay. (D) Representative images from the colony formation assay, captured 14 days post-transfection. (E) Quantification of colony numbers in each group. (F, G) Transwell assays were conducted to assess the migration and invasion abilities of KYSE-150 (F) and KYSE-30 (G) cells. Images were captured at 100× magnification. (H) Wound healing assay images taken at 0 h and 24 h, captured at 40× magnification. (I) Quantification of wound healing areas, normalized to the control group. * P < 0.05
Fig. 3
Fig. 3
DDX18 increased the G2/M phase cells. (A, B) Cell cycle distribution (G0/G1, S, and G2/M phases) was analyzed in KYSE-150 (A) and TE-1 (B) cells 24 h post-transfection. (C) Expression levels of cell cycle-related proteins were examined via western blot. (D) Relative protein expression levels were normalized to GAPDH. * P < 0.05
Fig. 4
Fig. 4
DDX18 inhibited apoptosis and induced EMT through AKT/mTOR signaling pathway. (A) Cell apoptosis was assessed via flow cytometry 24 h post-transfection. (B) The percentage of apoptotic cells was quantified using FlowJo software. (C, D) Expression levels of apoptosis-related proteins were analyzed by western blot in KYSE-150 (C) and KYSE-30 (D) cells. (E) EMT-related protein expression was examined using western blot. (F) Relative protein expression levels were normalized to GAPDH. (G) Western blot analysis of the expression levels of AKT, p-AKT, mTOR, p-mTOR, P70/S6K, FOX, and Palladin in KYSE-150 and KYSE-30 cells. (H) Relative protein expression levels were normalized to GAPDH. * P < 0.05
Fig. 5
Fig. 5
AKT inhibitors blocked the cancer promoting effect of DDX18 in esophageal cancer. (A) KYSE-30 cells overexpressing DDX18 were treated with the AKT inhibitor LY294002 (10 µM) for 24 h, and cell viability was evaluated using the CCK8 assay. (B) Images from the colony formation assay were captured 14 days post-transfection. (C) Flow cytometry was used to analyze the cell cycle distribution (G0/G1, S, and G2/M phases) in KYSE-30 cells 24 h post-transfection. (D) Intergroup differences in cell cycle distribution were compared. (E) Expression levels of cell cycle-related proteins were determined by western blot. (F) Protein levels were normalized to GAPDH. * P < 0.05 vs. NC; # P < 0.05 vs. DDX18-OE; ** P < 0.01; *** P < 0.001
Fig. 6
Fig. 6
DDX18 promoted KYSE-140 cell proliferation and EMT via activation of the AKT/mTOR signaling pathway. (A) KYSE-140 cells were transfected with a DDX18 overexpression plasmid for 24 h, then cell proliferation was evaluated using the CCK-8 assay. (B) Colony formation images were captured 14 days post-transfection. (C) Transwell assays were performed to assess cell migration and invasion, with micrographs taken at 100× magnification. (D) Wound healing was imaged at 0 and 24 h at 40× magnification, and the healing area was normalized to that of the control group. (E) Cell cycle distribution (G0/G1, S, and G2/M phases) was analyzed by flow cytometry. (F) Cell cycle-related protein expression was determined using western blot. (G) Apoptosis was assessed by flow cytometry 24 h post-transfection. (H) Apoptosis-related proteins were measured by western blot. (I) EMT-related proteins were detected via western blot. (J) AKT/mTOR pathway-related proteins were analyzed by western blot, with protein levels normalized to GAPDH. * P < 0.05
Fig. 7
Fig. 7
Transcription factor YY1 promoted DDX18 transcription in esophageal cancer cells. (A) Bioinformatics analysis predicted YY1 binding sites within the DDX18 promoter region (https://jaspar.elixir.no/). (B) KYSE-150 and KYSE-30 cells were transfected with a YY1 overexpression plasmid, and qPCR was used to quantify the mRNA levels of YY1 and DDX18. (C) Western blot analysis was performed to assess YY1 and DDX18 protein expression in control and YY1-overexpressing cells. (D) KYSE-150 and KYSE-30 cells were transfected with YY1 siRNA, followed by qPCR to measure YY1 and DDX18 mRNA levels. (E) Western blotting evaluated YY1 and DDX18 protein levels in control and YY1-knockdown cells. (F) 293T cells were co-transfected with luciferase vectors containing either the wild-type or mutant DDX18 promoter and the YY1 plasmid, after which luciferase activity was quantified. (G) ChIP assay was performed to verify the binding of YY1 to the DDX18 promoter. (H) YY1 expression was detected by immunohistochemistry in a tissue array consisting of 45 esophageal cancer tissues and 45 adjacent non-tumor tissues. (I) qPCR analysis was used to evaluate YY1 mRNA levels in 24 paired esophageal cancer and adjacent non-tumor tissues. (J) Western blot analysis determined YY1 protein expression in 24 paired esophageal cancer and adjacent non-tumor tissues, with GAPDH serving as the loading control. * P < 0.05
Fig. 8
Fig. 8
YY1 overexpression reversed the inhibition of proliferation, migration, and invasion induced by DDX18 knockdown. (A) KYSE-150 and TE-1 cells were co-transfected with YY1 overexpression plasmid and DDX18 siRNA. Cell viability was assessed using the CCK8 assay. (B) Colony formation assay images were captured 14 days post-transfection. (C) Colony count was performed for each group. (D, E) Migration and invasion of KYSE-150 cells were assessed using Transwell assays. (F, G) Migration and invasion of TE-1 cells were also assessed via Transwell assays. Micrographs were taken at 100× magnification. (H) Wound healing was imaged at 0 and 24 h at 40× magnification. (I) The healing area was normalized to the control group. * P < 0.05 vs. NC, # P < 0.05 vs. siDDX18
Fig. 9
Fig. 9
YY1 overexpression reversed the effect of DDX18 on cell cycle. KYSE-150 (A) and TE-1 (B) cells were collected 24 h after transfection, and cell cycle distribution (G0/G1, S, G2/M phases) was analyzed using flow cytometry. (C) Cell cycle-related proteins were assessed by western blot analysis. (D) Protein expression levels were normalized to GAPDH. * P < 0.05 vs. NC; # P < 0.05 vs. siDDX18
Fig. 10
Fig. 10
YY1 rescued the effects of DDX18 on apoptosis and EMT. (A) Apoptosis was analyzed by flow cytometry 24 h post-transfection in KYSE-150 and TE-1 cells. (B) The percentage of apoptotic cells was quantified in KYSE-150 and TE-1 cells using FlowJo software. (C, D) The expression levels of apoptosis-related proteins were assessed by western blot in KYSE-150 (C) and TE-1 (D) cells. (E, F) EMT-related proteins were analyzed via western blot in KYSE-150(E) and TE-1(F) cells. (G, H) Western blot analysis of the expression levels of AKT, p-AKT, mTOR, p-mTOR, P70/S6K, FOX, and Palladin in KYSE-150(G) and TE-1(H) cells. GAPDH was used as a loading control. * P < 0.05 vs. NC; # P < 0.05 vs. siDDX18
Fig. 11
Fig. 11
DDX18 promoted the growth of esophageal cancer in vivo. (A) Female BALB/C mice (n = 5) were injected with 1 × 106 KYSE-150 or TE-1 cells. Tumor volume was measured 24 days post-injection. (B) Immunohistochemical analysis was conducted to assess DDX18 levels in tumor tissue from the mice. Micrographs were captured at 400× magnification. (C) KI67 expression was evaluated by immunohistochemical staining. Micrographs were taken at 400× magnification. (D) DDX18 expression was further confirmed through western blot analysis

Similar articles

References

    1. Bray F, Laversanne M. Global cancer statistics 2022: GLOBOCAN estimates of incidence and mortality worldwide for 36 cancers in 185 countries [J]. Cancer J Clin. 2024;74(3):229–63. - PubMed
    1. Eisner D C. Esophageal cancer: treatment advances and need for screening [J]. Jaapa. 2024;37(4):19–24. - PubMed
    1. Domper Arnal M J, Ferrández Arenas, Á, Lanas Arbeloa Á. Esophageal cancer: risk factors, screening and endoscopic treatment in Western and Eastern countries [J]. World J Gastroenterol. 2015;21(26):7933–43. - PMC - PubMed
    1. Sakanaka K. Treatment strategy for early-stage esophageal cancer [J]. Japanese J Radiol. 2024;42(7):677–84. - PMC - PubMed
    1. Deboever N, Jones C M, Yamashita K, et al. Advances in diagnosis and management of cancer of the esophagus [J]. BMJ. 2024;385:e074962. - PubMed

MeSH terms

LinkOut - more resources