

Developing and validating a predictive model for all-cause mortality in patients with metabolic dysfunction-associated steatotic liver disease
- PMID: 40394710
- PMCID: PMC12090693
- DOI: 10.1186/s13098-025-01724-6
Developing and validating a predictive model for all-cause mortality in patients with metabolic dysfunction-associated steatotic liver disease
Abstract
Objective: This study aimed to construct a scientific, accurate, and readily applicable clinical all-cause mortality prediction model for patients with metabolic dysfunction-associated steatotic liver disease (MASLD) to enhance the efficiency of disease management and improve patient prognosis.
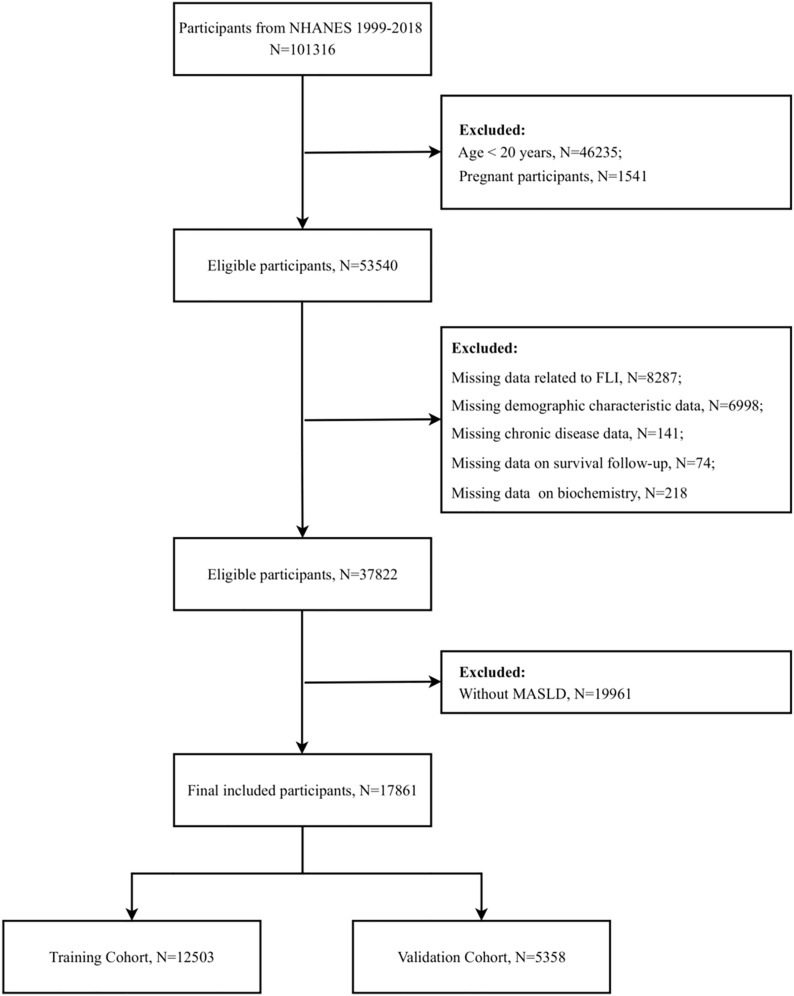
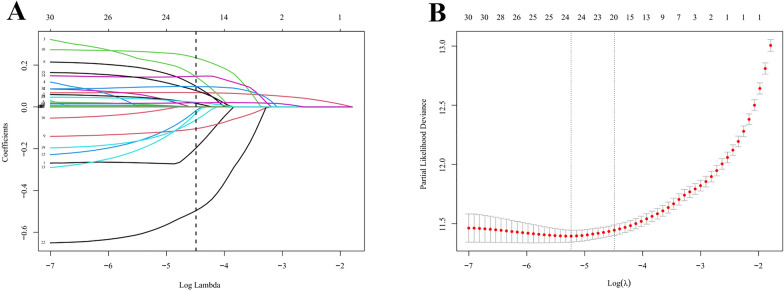
Methods: This study was a retrospective cohort study based on the National Health and Nutrition Examination Survey database. The 17,861 participants diagnosed with MASLD were randomly assigned to either a training cohort (n = 12,503) or a validation cohort (n = 5358). Potential predictors were subjected to LASSO regression analysis, and independent risk factors were subsequently identified through multivariate Cox regression analysis. An all-cause mortality prediction model was constructed based on the significant predictors, and a nomogram was generated to illustrate the survival probability of patients at various time points. The model's performance was evaluated using receiver operating characteristic (ROC), calibration, and decision curve analysis (DCA) curves.
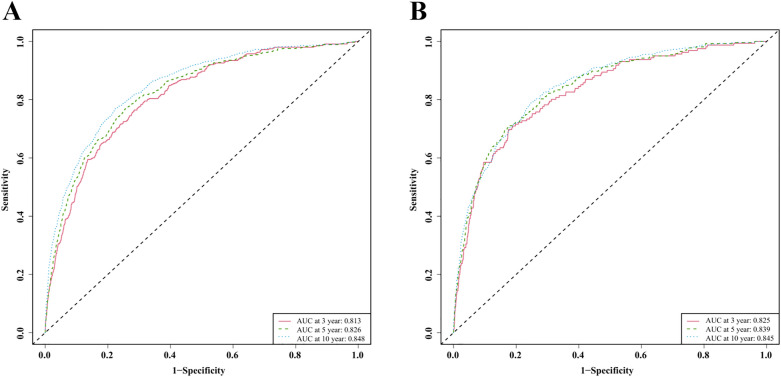
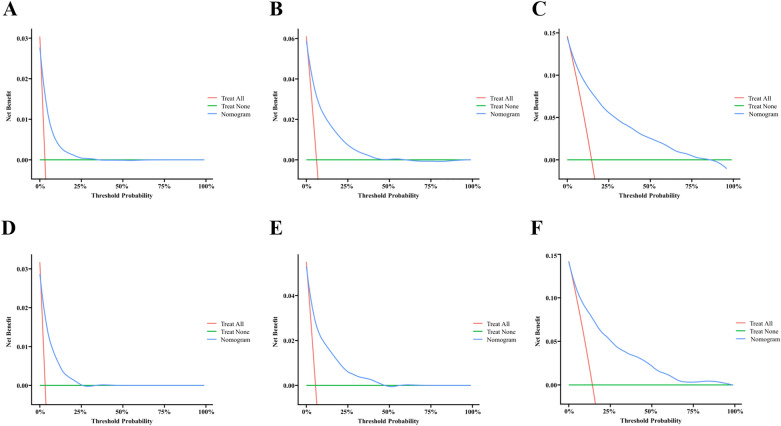
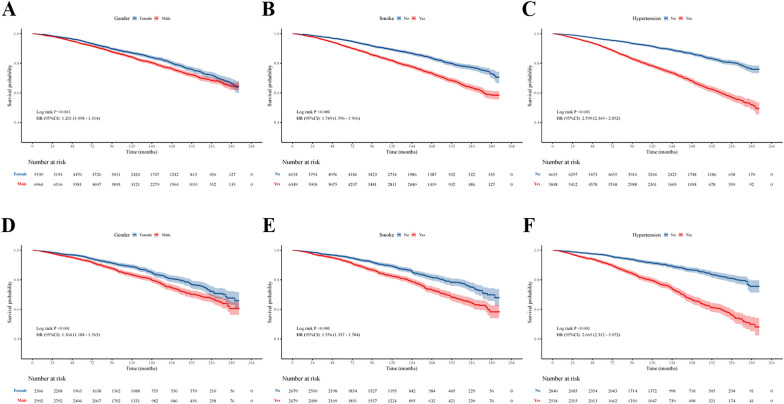
Results: A multiple Cox regression analysis identified several independent predictors significantly influencing all-cause mortality in patients with MASLD. These included gender, age, smoking status, hypertension, red blood cell count, albumin, glutamyl transpeptidase, glycosylated hemoglobin, and creatinine. The constructed predictive model demonstrated high accuracy in the training and validation cohorts, with AUC values approaching 0.85 at 3, 5, and 10 years, respectively. Calibration and DCA curves were employed to verify the stability and generalizability of the model.
Conclusions: We successfully constructed and validated an all-cause mortality prediction model for MASLD patients. This model provides a powerful tool for clinical risk assessment and treatment decision-making.
Keywords: All-cause mortality; Cox regression analysis; Metabolic dysfunction-associated steatotic liver disease; NHANES; Predictive modeling.
© 2025. The Author(s).
Conflict of interest statement
Declarations. Ethics approval and consent to participate: The studies involving humans were approved by the National Center for Health Statistics Ethics Review Board. The studies were conducted in accordance with the local legislation and institutional requirements. The participants provided their written informed consent to participate in this study. Consent for publication: Not applicable. Competing interests: The authors declare no competing interests.
Figures


Similar articles
-
Nomogram for predicting 5-year metabolic dysfunction-associated steatotic liver disease risk: retrospective cohort study.Endocr Connect. 2024 Jul 13;13(8):e240186. doi: 10.1530/EC-24-0186. Print 2024 Aug 1. Endocr Connect. 2024. PMID: 38904472 Free PMC article.
-
Establishing of a risk prediction model for metabolic dysfunction-associated steatotic liver disease: a retrospective cohort study.BMC Gastroenterol. 2025 Jan 28;25(1):39. doi: 10.1186/s12876-025-03598-4. BMC Gastroenterol. 2025. PMID: 39875811 Free PMC article.
-
Identification of multiple complications as independent risk factors associated with 1-, 3-, and 5-year mortality in hepatitis B-associated cirrhosis patients.BMC Infect Dis. 2025 Feb 1;25(1):151. doi: 10.1186/s12879-025-10566-6. BMC Infect Dis. 2025. PMID: 39891059 Free PMC article.
-
Predictive role of neutrophil percentage-to-albumin ratio, neutrophil-to-lymphocyte ratio, and systemic immune-inflammation index for mortality in patients with MASLD.Sci Rep. 2024 Dec 5;14(1):30403. doi: 10.1038/s41598-024-80801-8. Sci Rep. 2024. PMID: 39638820 Free PMC article.
-
Risk factor analysis and predictive model construction of lean MAFLD: a cross-sectional study of a health check-up population in China.Eur J Med Res. 2025 Feb 25;30(1):137. doi: 10.1186/s40001-025-02373-1. Eur J Med Res. 2025. PMID: 40001266 Free PMC article. Review.
References
-
- Tesfai K, Pace J, El-Newihi N, Martinez ME, Tincopa M, Loomba R. Disparities for hispanic adults with metabolic dysfunction-associated steatotic liver disease in the US: a systematic review and meta-analysis. Clin Gastroenterol Hepatol. 2024;23(2):236–49. - PubMed
-
- Miao L, Targher G, Byrne CD, Cao YY, Zheng MH. Current status and future trends of the global burden of MASLD. Trends Endocrinol Metab. 2024;35(8):697–707. - PubMed
Grants and funding
LinkOut - more resources
Full Text Sources
