Review
. 2025 Jul 1;124(13):2103-2119.
doi: 10.1016/j.bpj.2025.05.017. Epub 2025 May 19.

The molecular mechanism of ATP synthase constrains the evolutionary landscape of chemiosmosis

Affiliations
Review

The molecular mechanism of ATP synthase constrains the evolutionary landscape of chemiosmosis

J Emyr Macdonald et al. Biophys J. .

Abstract

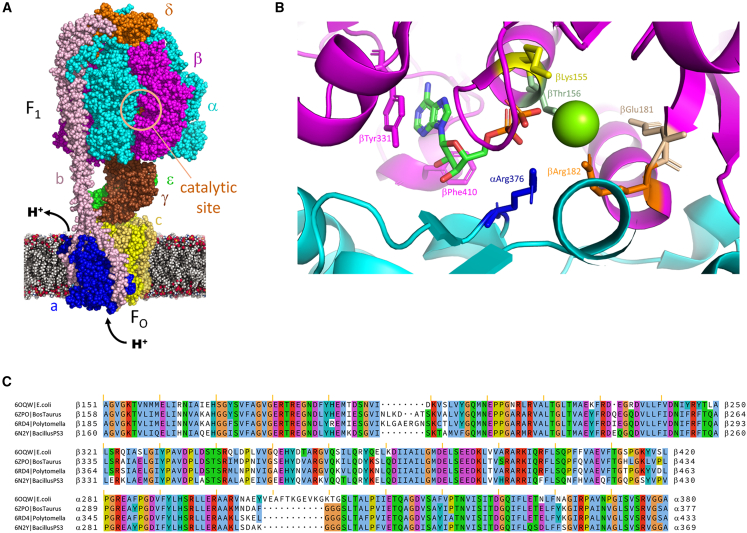
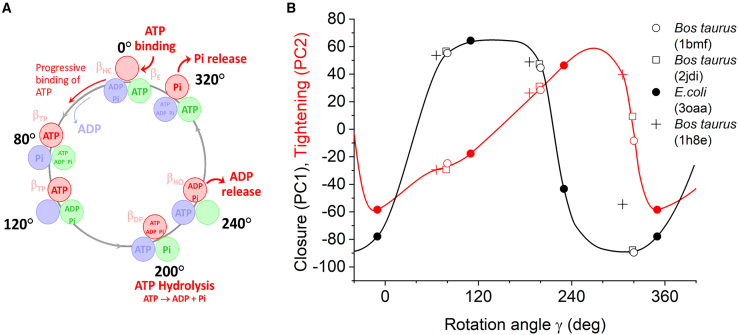
ATP synthase, the enzyme responsible for regenerating adenosine triphosphate (ATP) in the cell, comprises a proton-translocating motor in the cell membrane (labeled FO in bacteria, mitochondria, and chloroplasts), coupled by a common stalk to a catalytic motor F1 that synthesizes or hydrolyzes ATP, depending on the direction of rotation. The detailed mechanisms of FO, F1 and their coupling in ATP synthase have been elucidated through structural studies, single-molecule experiments, and molecular modeling. The outcomes of this body of work are reviewed with a particular focus on the features of the mechanism that enable the high energy efficiency and reversibility of ATP synthase. Models for the origin of chemiosmosis involve either ATP synthesis (driven by the proton gradient across the membrane) or ATP hydrolysis (for pumping protons out of the cell) as a primary function, the other function being a later development enabled by the coupled nature of the two motors. The mechanism of ATP synthase and the stringent requirements on efficiency to maintain life constrain existing models and the search for the origin of chemiosmosis.


Conflict of interest statement

Declaration of interests The authors declare no competing interests.

Figures

Figure 1
Figure 1
(A) The molecular structure of FO-F1 ATP synthase from E. coli (PDB: 8dbq) determined from cryo-electron microscopy (7). Its subunits are α (cyan), β (magenta), γ (brown), δ (orange), ε (green), a (blue), b (pink), and c (yellow). (B) The active catalytic site in the βDP subunit (shown in magenta) at its interface with the α-subunit (in cyan). Colored side chains denote some of the crucial residues that are mentioned in the text. Aromatic side chains colored magenta denote those that interact with the adenine ring. The nucleotide is ADP: the Pi is absent in the cryo-electron microscopy structure although a Mg+2 ion (green sphere) is included. (C) A multiple sequence alignment for the β subunit catalytic site and α subunit at the interface with the β subunit from different organisms to facilitate comparison. Residues are colored according to the Clustalx scheme (blue: hydrophobic, red: positively charged, magenta: negatively charged, green: polar, cyan: aromatic, pink: cysteines, orange: glycines, dark yellow: prolines). Vertical wheat-colored bars denote multiples of ten in the residue index of E. coli.
Figure 2
Figure 2
(A) Sequence of events in F1 during the ATP hydrolysis cycle as a function of rotation angle γ from single-molecule experiments on the thermophilic bacterium Bacillus PS3 (adapted from [4]). γ = 0° is the angle at which ATP initially binds to the empty catalytic site, colored red. Scission occurs at this site at γ = 200°, cleaving ATP into ADP and Pi. The two other binding sites of F1 are offset by ±120° and are shown in blue and green. (B) The principal components representing closure of the catalytic site (black) and tightening of the α-β interface (red) are shown as a function of γ for F1. The key shows the PDB codes for the respective structures. The solid lines represent splines as guides to the eye.
Figure 3
Figure 3
The approximate free energy landscape during hydrolysis of ATP within the catalytic site of the F1 motor in ATP synthase as a function of rotation angle γ (adapted from (72)). Dashed pale-blue arrows represent processes that occur over slower μs–ms timescales and are coupled to conformational changes within the β- and α-subunits. The catalytic scission of the terminal phosphate of ATP, shown in red, is rapid (ps–fs timescale) and weakly exergonic. The free energy as a function of rotation angle calculated from molecular dynamics over the range γ = 0°–60° (75) is shown by a dashed green line. The inset shows the free energy of three α-β subunit pairs, each offset by 120°, leading to an approximately constant torque.
Figure 4
Figure 4
The FO motor of E. coli (PDB: 6oqs) during ATP synthesis. Its subunits are a (blue), b (pink), and c (yellow). Residues cAsp61 which are protonated are shown in orange, with the most recently protonated being shown in a darker sienna color. The cAsp61 residue after releasing its proton to the pale gray outlet half-channel is shown in green. The direct path for protons between the two half-channels is electrostatically blocked by the aArg210 residue (red). The deprotonated cAsp61residue will be protonated by Grotthuss transfer of protons from the dark gray inlet half-channel, via residues shown in magenta, before it arrives at the sienna-colored site. The resulting biased rotation of the c-subunit is in the anticlockwise direction. (A) Side view. (B) Top view.
Figure 5
Figure 5
The maximum possible [ATP]/[ADP] concentration ratio that can be generated as a function of the counter-torque τ1 of the F1 motor for a typical phosphate concentration [Pi] of 6 mM. These are evaluated from Equation 1 with τ1=3ΔGhyd/2π. Gray dashed lines denote the corresponding ratio for approximate limiting cellular values of [Pi] = 1 mM and [Pi] = 30 mM. The green band represents the range occurring in current organisms, and the red band represents [ATP]/[ADP] ratios that are physiologically too low for bacterial cells. For a Figure360 author presentation of this figure, see https://doi.org/10.1016/j.bpj.2025.05.017.

Similar articles

References

    1. Hulett H.R. Non-enzymatic hydrolysis of adenosine phosphates. Nature. 1970;225:1248–1249. doi: 10.1038/2251248a0. - DOI - PubMed
    1. Wang C., Huang W., Liao J.-L. QM/MM Investigation of ATP Hydrolysis in Aqueous Solution. J. Phys. Chem. B. 2015;119:3720–3726. doi: 10.1021/jp512960e. - DOI - PubMed
    1. Kühlbrandt W. Structure and Mechanisms of F-Type ATP Synthases. Annu. Rev. Biochem. 2019;88:515–549. doi: 10.1146/annurev-biochem-013118-110903. - DOI - PubMed
    1. Noji H., Ueno H., McMillan D.G.G. Catalytic robustness and torque generation of the F1-ATPase. Biophys. Rev. 2017;9:103–118. doi: 10.1007/s12551-017-0262-x. - DOI - PMC - PubMed
    1. Sobti M., Walshe J.L., et al. Stewart A.G. Cryo-EM structures provide insight into how E. coli F1FO ATP synthase accommodates symmetry mismatch. Nat. Commun. 2020;11:2615. doi: 10.1038/s41467-020-16387-2. - DOI - PMC - PubMed

MeSH terms

Substances