. 2025 Jul 14;6(7):101378.
doi: 10.1016/j.xplc.2025.101378. Epub 2025 May 19.

The AP2/ERF transcription factor GmTINY mediates ethylene regulation of Rhg1-conferred resistance against soybean cyst nematode

Affiliations

The AP2/ERF transcription factor GmTINY mediates ethylene regulation of Rhg1-conferred resistance against soybean cyst nematode

Long He et al. Plant Commun. .

Abstract

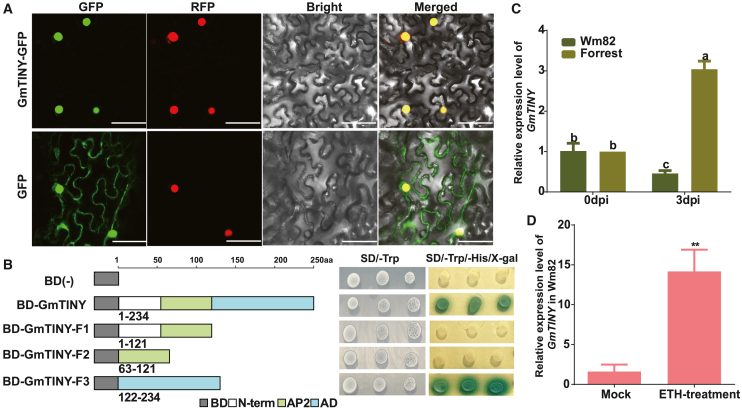
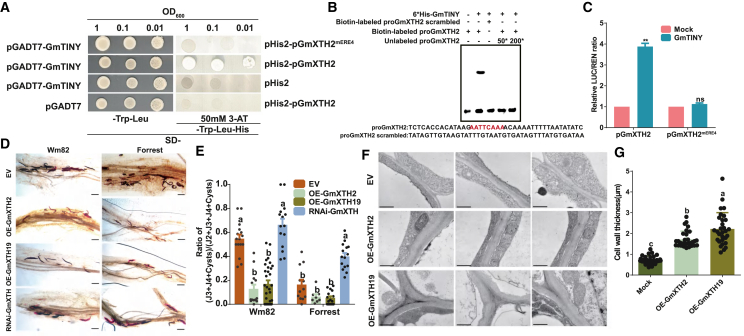
The soybean complex resistance locus Rhg1 is a primary contributor to the control of soybean cyst nematode (Heterodera glycines; SCN), a major threat to soybean production worldwide. Two genes within this locus, GmAATRhg1 and GmSNAP18, are upregulated during SCN infection. In this study, we found that SCN-resistant soybean varieties exhibit elevated ethylene (ETH) production upon infection. Exogenous ETH application further increased GmAATRhg1 and GmSNAP18 transcript levels and enhanced the SCN-resistance response. These genes are divergently transcribed from a shared promoter containing three ERELEE4 ethylene-responsive elements (AATTCAAA). Using yeast one-hybrid screening, we identified the AP2/ERF transcription factor GmTINY (Glyma.01G147600) as an ERELEE4-binding protein. GmTINY is localized to the nucleus, and its expression is induced by both ETH treatment and SCN infection. Molecular, biochemical, and genetic analyses showed that GmTINY binds to the Rhg1 ERELEE4 elements and regulates the expression of GmAATRhg1 and GmSNAP18, thereby enhancing SCN resistance. Additionally, overexpression of GmTINY induced several xyloglucan endotransglycosylase/hydrolase (XTH) genes, particularly GmXTH2, which is implicated in cell wall remodeling and restricts nematode development beyond the J2 stage. Together, these findings reveal an ETH-GmTINY signaling axis that regulates both Rhg1-mediated and cell wall-related resistance pathways, providing new insights for engineering durable SCN resistance in soybean.

Keywords: AP2/ERF transcription factor; GmTINY; Rhg1 locus; SCN; XTH; ethylene; soybean cyst nematode; xyloglucan endotransglycosylase/hydrolase.


Figures

Figure 1
Figure 1
Ethylene response to SCN and ethylene-induced elevation of Rhg1 transcripts and SCN-resistance response. (A) Relative ethylene content in Williams 82 (Wm82) and Forrest at 6 h post-SCN inoculation compared with mock treatment. Mean ± standard error (SE) values are based on three biological replicates, each with three technical replicates. Different letters indicate significant differences according to one-way analysis of variance (ANOVA) (P < 0.05). (B and C) RT-qPCR analyses of GmAATRhg1 and GmSNAP18 expression in soybean after ethylene treatment. Mean ± SE values are based on three biological replicates, each with three technical replicates. Significant differences are indicated by different letters according to one-way ANOVA (P < 0.05). (D) SCN developmental stages visualized by acid fuchsin staining in Wm82 and Forrest roots at 14 days post-inoculation (dpi) under different ethylene treatments. Scale bars, 1000 μm. (E) SCN demographic assays in Wm82 and Forrest roots at 14 dpi under different ethylene treatments. Mean ± SE values are based on three biological replicates (n ≥ 5). Different letters indicate significant differences according to one-way ANOVA (P < 0.05). (F) Representative images of Wm82 and Forrest roots at 21 dpi infected with SCN after ethylene treatment. Scale bars, 3000 μm. (G) Quantification of SCN J4 or cysts per gram of fresh root weight in Wm82 and Forrest roots at 21 dpi after ethylene treatment. Mean ± SE values are based on three biological replicates (n > 9). Different letters indicate significant differences according to one-way ANOVA (P < 0.05).
Figure 2
Figure 2
ERELEE4 is a key regulatory element in the GmAATRhg1 and GmSNAP18 promoters. (A)GmAATRhg1 and GmSNAP18 share a promoter region. (B) GUS staining showing ethylene-induced expression of the GUS reporter gene driven by the promoters of GmAATRhg1 (pGmAATRhg1) and GmSNAP18 (pGmSNAP18), and their ERELEE4 (ERE4) mutants (pGmAATmERE4Rhg1 and pGmSNAP18mERE4). Scale bars, 30 mm. (C and D) Quantification of GUS reporter assays showing ethylene-induced expression driven by the pGmAATRhg1, pGmAATmERE4Rhg1, GmSNAP18, and pGmSNAP18mERE4 promoters. Mean ± SE values are based on three biological replicates, each with three technical replicates. Significance was evaluated using Student’s t-test; ∗∗P < 0.01; ns, not significant.
Figure 3
Figure 3
GmTINY binds to the promoters of GmAATRhg1 and GmSNAP18 and activates their expression. (A) Yeast one-hybrid assay. Yeast cells were co-transformed with effector vectors containing the promoters of GmAATRhg1 (pGmAATRhg1) and GmSNAP18 (pGmSNAP18) or their ERE4 mutants (pGmAATmERE4Rhg1 and pGmSNAP18mERE4) fused to pHis2-lic vectors, and prey vectors encoding GmTINY or GmERF7 fused to pGADT7-lic. (B) DNA binding of GmTINY and GmERF7 to the 3×ERE4 sequences. Recombinant proteins were incubated with biotin-labeled ERE4 oligonucleotide probes in EMSA. (C) Competition assays. GmTINY binding to ERE4 was competed with increasing amounts (50×, 100×, and 200×) of unlabeled oligonucleotide competitors. (D and E) Relative LUC/REN values for the interaction between GmTINY and pGmAATRhg1, pGmSNAP18, pGmAATmERE4Rhg1, and pGmSNAP18mERE4. Mean ± SE values are based on three biological replicates, each with three technical replicates. Significance was assessed using Student’s t-test; ∗∗P < 0.01; ns, not significant.
Figure 4
Figure 4
Functional analysis of GmTINY. (A) Subcellular localization of GmTINY. Agrobacteria harboring the GmTINY-GFP (green fluorescent protein) or empty GFP vector were infiltrated into 21-day-old N. benthamiana leaves co-expressing the nuclear-localized marker RFP (red fluorescent protein)–H2B. Scale bars, 30 μm. (B) Yeast cells expressing full-length BD-GmTINY or truncated variants (BD-GmTINY-F1, -F2, and -F3) or the empty pGBKT7 vector (BD(−)) were grown on synthetic defined (SD) medium −Trp and SD −Trp−His containing 3-amino-1,2,4-triazole (3-AT) and 5-bromo-4-chloro-3-indolyl-α-D-galactopyranoside (X-α-gal) for 3 days at 30°C. BD-GmTINY-F1 lacks the C-terminal region; BD-GmTINY-F2 contains only the AP2 DNA-binding domain; and BD-GmTINY-F3 contains only the C-terminal region excluding the AP2 domain. (C) RT-qPCR analysis of GmTINY expression in Wm82 at 0 and 3 dpi. Mean ± SE values are based on three biological replicates, each with three technical replicates. Different letters indicate significant differences according to one-way ANOVA (P < 0.05). (D) RT-qPCR analysis of GmTINY expression at 6 h after treatment with ethylene. Mean ± SE values are based on three biological replicates, each with three technical replicates. ∗∗P < 0.01 according to Student’s t-test.
Figure 5
Figure 5
GmTINY impacts the SCN-resistance response. (A and C) SCN developmental stages visualized by acid fuchsin staining in OE-GmTINY and RNAi-GmTINY Wm82 and Forrest transgenic hairy roots. Scale bars, 1000 μm. (B and D) Demographic assays of SCN development and resistance responses in OE-GmTINY- and RNAi-GmTINY-transformed Wm82 and Forrest hairy roots at 14 dpi. Mean ± SE values are based on three biological replicates (n ≥ 6 for OE; n ≥ 7 for RNAi). Different letters indicate significant differences according to one-way ANOVA (P < 0.05). (E) Representative images of stable transgenic soybean roots overexpressing GmTINY infected with SCN at 21 dpi. Scale bars, 3000 μm. (F) Quantification of SCN J4 or cysts per gram of fresh root weight in stable transgenic soybean roots overexpressing GmTINY at 21 dpi. Mean ± SE values are based on three biological replicates (n ≥ 6). Different letters indicate significant differences according to one-way ANOVA (P < 0.05).
Figure 6
Figure 6
GmTINY alters the expression of GmXTHs. (A) Gene Ontology (GO) terms significantly enriched among differentially expressed genes (DEGs) identified in Wm82 hairy roots transformed with the empty vector or OE-GmTINY under SCN-infected conditions. (B) GO terms significantly enriched in upregulated DEGs. GO term enrichment analysis was performed using the SoyBase GO Term Enrichment Tool (P < 0.05). (C) RT-qPCR analyses of selected GmXTHs in empty vector (EV) and OE-GmTINY Wm82 hairy roots at 72 h post-SCN inoculation (hpi). Mean ± SE values are based on three biological replicates, each with three technical replicates. ∗∗P < 0.01 according to Student’s t-test. (D) Heatmap analysis showing relative expression of selected GmXTH genes under SCN infection compared with mock controls, based on RNA-seq data. Color scale represents relative expression, with blue indicating low and red indicating high values. (E) Relative LUC/REN values for the interaction between GmTINY and the promoters of GmXTHs (pGmXTHs). Mean ± SE values are based on three biological replicates, each with three technical replicates. ns, not significant; ∗∗P < 0.01 according to Student’s t-test.
Figure 7
Figure 7
GmXTH is activated by GmTINY and reduces SCN progression past the J2 stage. (A) Yeast one-hybrid assays confirmed the interaction between GmTINY and the GmXTH2 promoter (pGmXTH2). Yeast cells were co-transformed with effector vectors containing either pGmXTH2 or its ERE4 mutant variant (pGmXTH2mERE4) fused to a pHis2-lic vector, and prey vectors encoding GmTINY fused to pGADT7-lic. (B) EMSA confirmed that GmTINY specifically binds to the ERE4 sequence using biotin-labeled ERE4 oligonucleotide probes. No binding was observed when excess unlabeled competitors (50× and 200×) or a scrambled probe was included, indicating sequence-specific interaction. (C) Relative LUC/REN values for the interaction between GmTINY and pGmXTH2 or pGmXTH2mERE4. Mean ± SE values are based on three biological replicates, each with three technical replicates. ns, not significant; ∗∗P < 0.01 according to Student’s t-test. (D) Representative acid fuchsin staining images of SCN developmental stages in EV, OE-GmXTH2, OE-GmXTH19, and RNAi-GmXTH transgenic hairy roots of Wm82 and Forrest at 14 dpi. Images highlight nematode developmental stages in localized root regions; nematode distribution along the root is often uneven. Scale bars, 250 μm. (E) Demographic assay of SCN resistance in EV, OE-GmXTH2, OE-GmXTH19, and RNAi-GmXTH transgenic hairy roots at 14 dpi. Data are presented as means ± SE (n ≥ 6). Different letters indicate significant differences according to one-way ANOVA (P < 0.05). (F) Representative TEM images of cell walls in EV, OE-GmXTH2, and OE-GmXTH19 transgenic hairy roots. Samples were collected uniformly from regions 1 cm above the root tip. Scale bars, 5 μm. (G) Cell wall thickness in EV-, OE-GmXTH2-, and OE-GmXTH19 transformed hairy roots was measured using ImageJ software based on TEM images. Data were collected from at least 10 images per group across three independently fixed roots. Data are presented as means ± SE. Different letters indicate significant differences according to one-way ANOVA (P < 0.05).

Similar articles

References

    1. Arthur J.S.C., Ley S.C. Mitogen-activated protein kinases in innate immunity. Nat. Rev. Immunol. 2013;13:679–692. - PubMed
    1. Bayless A.M., Smith J.M., Song J., McMinn P.H., Teillet A., August B.K., Bent A.F. Disease resistance through impairment of α-SNAP-NSF interaction and vesicular trafficking by soybean Rhg1. Proc. Natl. Acad. Sci. USA. 2016;113:E7375–E7382. - PMC - PubMed
    1. Bayless A.M., Zapotocny R.W., Grunwald D.J., Amundson K.K., Diers B.W., Bent A.F. An atypical N-ethylmaleimide sensitive factor enables the viability of nematode-resistant Rhg1 soybeans. Proc. Natl. Acad. Sci. USA. 2018;115:E4512–E4521. - PMC - PubMed
    1. Bayless A.M., Zapotocny R.W., Han S., Grunwald D.J., Amundson K.K., Bent A.F. The rhg1-a (Rhg1 low-copy) nematode resistance source harbors a copia-family retrotransposon within the Rhg1-encoded α-SNAP gene. Plant Direct. 2019;3 - PMC - PubMed
    1. Bent A.F. Exploring Soybean Resistance to Soybean Cyst Nematode. Annu. Rev. Phytopathol. 2022;60:379–409. - PubMed

MeSH terms

LinkOut - more resources