Spectral and network investigation reveals distinct power and connectivity patterns between phasic and tonic REM sleep
- PMID: 40394955
- PMCID: PMC12351276
- DOI: 10.1093/sleep/zsaf133
Spectral and network investigation reveals distinct power and connectivity patterns between phasic and tonic REM sleep
Abstract
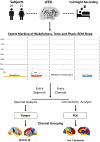
Although rapid eye movement (REM) sleep is often thought of as a singular state, it consists of two substates, phasic and tonic REM, defined by the presence (respectively absence) of bursts of rapid eye movements. These two substates have distinct EEG signatures and functional properties. However, whether they exhibit regional specificities remains unknown. Using intracranial EEG recordings from 31 patients, we analyzed expert-labeled segments from tonic and phasic REM and contrasted them with wakefulness segments. We assessed the spectral and connectivity content of these segments using Welch's method to estimate power spectral density and the phase locking value to assess functional connectivity. Overall, we found a widespread power gradient between low and high frequencies (p < 0.05, Cohen's d = 0.17 ± 0.20), with tonic REM being dominated by lower frequencies (p < 0.01, d = 0.18 ± 0.08), and phasic REM by higher frequencies (p < 0.01, d = 0.18 ± 0.19). However, some regions, such as the occipito-temporal areas as well as medial frontal regions, exhibit opposite trends. Connectivity was overall higher in all bands except in the low and high ripple frequency bands in most networks during tonic REM (p < 0.01, d = 0.08 ± 0.09) compared to phasic REM. Yet, functional connections involving the visual network were always stronger during phasic REM when compared to tonic REM. These findings highlight the spatiotemporal heterogeneity of REM sleep which is consistent with the concept of focal sleep in humans.
Keywords: REM; connectivity; microstate; phasic REM; spectrum; tonic REM.
© The Author(s) 2025. Published by Oxford University Press on behalf of Sleep Research Society.
Conflict of interest statement
Authors have nothing to disclose.
Figures


Similar articles
-
Prescription of Controlled Substances: Benefits and Risks.2025 Jul 6. In: StatPearls [Internet]. Treasure Island (FL): StatPearls Publishing; 2025 Jan–. 2025 Jul 6. In: StatPearls [Internet]. Treasure Island (FL): StatPearls Publishing; 2025 Jan–. PMID: 30726003 Free Books & Documents.
-
Aperiodic neural activity distinguishes between phasic and tonic REM sleep.J Sleep Res. 2025 Aug;34(4):e14439. doi: 10.1111/jsr.14439. Epub 2024 Dec 26. J Sleep Res. 2025. PMID: 39724862 Free PMC article.
-
Insomnia and emotional dysfunction: Altered brain network connectivity across sleep and wakefulness states.Sleep Med. 2025 Sep;133:106582. doi: 10.1016/j.sleep.2025.106582. Epub 2025 May 23. Sleep Med. 2025. PMID: 40449056
-
Systemic pharmacological treatments for chronic plaque psoriasis: a network meta-analysis.Cochrane Database Syst Rev. 2021 Apr 19;4(4):CD011535. doi: 10.1002/14651858.CD011535.pub4. Cochrane Database Syst Rev. 2021. Update in: Cochrane Database Syst Rev. 2022 May 23;5:CD011535. doi: 10.1002/14651858.CD011535.pub5. PMID: 33871055 Free PMC article. Updated.
-
Systemic pharmacological treatments for chronic plaque psoriasis: a network meta-analysis.Cochrane Database Syst Rev. 2017 Dec 22;12(12):CD011535. doi: 10.1002/14651858.CD011535.pub2. Cochrane Database Syst Rev. 2017. Update in: Cochrane Database Syst Rev. 2020 Jan 9;1:CD011535. doi: 10.1002/14651858.CD011535.pub3. PMID: 29271481 Free PMC article. Updated.
References
-
- Aserinsky E, Kleitman N. Regularly occurring periods of eye motility, and concomitant phenomena, during sleep. In: Science. Vol 118: American Association for the Advancement of Science; 1953:273–274. - PubMed
-
- Moruzzi G. Active processes in the brain stem during sleep. Harvey Lect. 1963;58:233–297. - PubMed
-
- Walker MP, van der Helm E. Overnight therapy? The role of sleep in emotional brain processing. Psychol Bull. 2009;135(5):731–748. doi: https://doi.org/ 10.1037/a0016570 - DOI - PMC - PubMed
-
- Peever J, Fuller PM. The biology of REM sleep. Curr Biol. 2017;27(22):R1237–R1248. doi: https://doi.org/ 10.1016/j.cub.2017.10.026 - DOI - PubMed
-
- Andrillon T, Pressnitzer D, Leger D, Kouider S. Formation and suppression of acoustic memories during human sleep. Nat Commun. 2017;8(1):179. doi: https://doi.org/ 10.1038/s41467-017-00071-z - DOI - PMC - PubMed
MeSH terms
Grants and funding
LinkOut - more resources
Full Text Sources

