. 2025 Oct;94(4):1363-1376.
doi: 10.1002/mrm.30561. Epub 2025 May 20.

TE optimization for J-difference editing of 2-hydroxyglutarate at 3T

Affiliations

TE optimization for J-difference editing of 2-hydroxyglutarate at 3T

Kimberly L Chan et al. Magn Reson Med. 2025 Oct.

Abstract

Purpose: To investigate the TE dependence of the edited 2-hydroxyglutarate (2HG) signal, its separation from co-edited glutamate plus glutamine (Glx), and fit accuracy in the presence of nuisance signals using a MEGA-PRESS sequence.

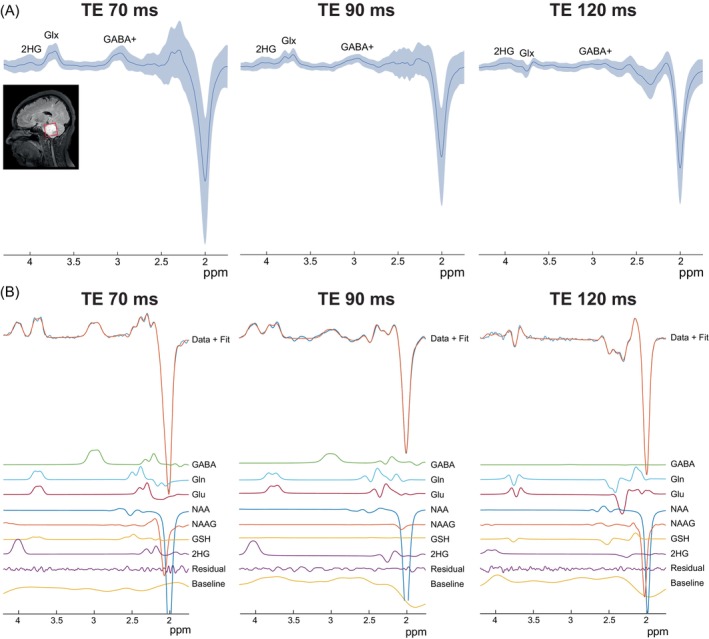
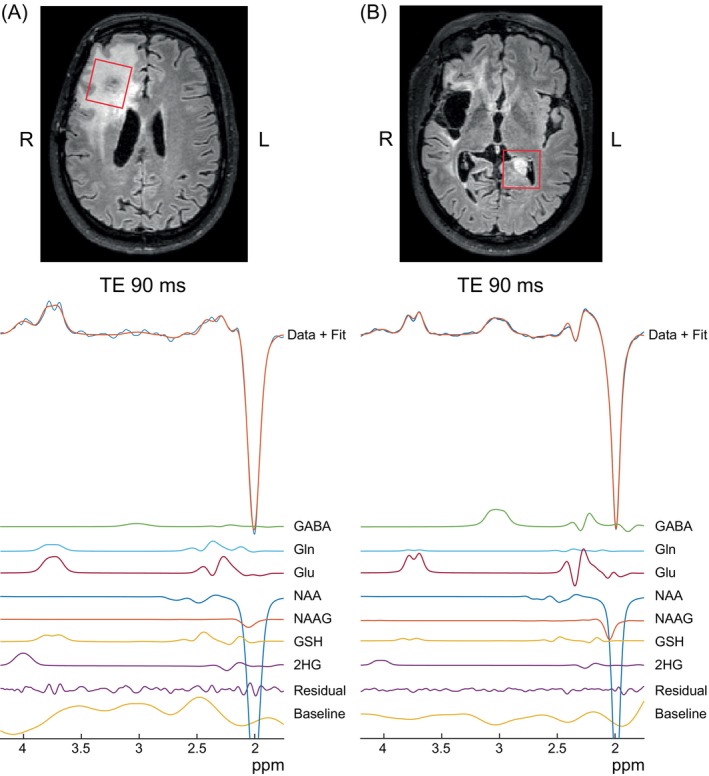
Methods: Simulations were performed at TEs 70-160 ms to assess the signal intensity and 2HG-Glx overlap as a function of TE. The effect of the 2HG-Glx spectral overlap on the fit accuracy of 2HG was evaluated on simulated 2HG-edited spectra with in vivo parameter variations. Data were acquired at TEs of 70 and 90 ms in 13 glioma patients to estimate the TE-dependence of the 2HG and Glx signal intensity and at a TE of 120 ms in eight glioma patients to estimate the in vivo 2HG, Glx, and water T2 relaxation times.

Results: A TE of 90 ms was found to produce a maximal 2HG integral, which was 23% larger than that at a TE of 70 ms in vivo without a significant increase in 2HG-Glx overlap. Lipid and residual water were 26% and 16% lower, respectively, at a TE of 90 ms versus 70 ms. Fit-quality numbers were 49% lower at a TE of 90 ms versus 70 ms, indicating enhanced fits at a TE of 90 ms. The in vivo T2 relaxation times of 2HG, Glx, and water were 264, 177, and 110 ms, respectively.

Conclusion: A TE of 90 ms was best with a maximal 2HG signal, minimal 2HG-Glx overlap, and minimal residual water and lipid contamination.

Keywords: 2HG; J‐difference editing; MR spectroscopy; glioma; tumor.


Figures

FIGURE 1
FIGURE 1
(A) Chemical structure of 2‐hydroxyglutarate (2HG) which has five non‐exchangeable protons detectable by 1H‐MRS. Scalar (J‐) couplings are indicated by the arrows. Editing pulses are applied at 1.9 ppm to target the moieties at 1.83 and 1.98 ppm and the observed signal originates from the proton at 4.02 ppm. (B) Spatial simulations of the 2HG multiplet at 4.02 ppm at a 90 ms for the MEGA‐PRESS sequence with 7‐Hz line‐broadening and editing pulses applied on‐resonance (ON) at 1.9 ppm (left) and off‐resonance (OFF) at 7.5 ppm (middle). The difference (DIFF) spectrum (ON – OFF) is shown on the right. Regions where coupling evolves as desired and produces a negative 2HG OFF signal are highlighted in green. Regions where couplings are refocused during the OFF acquisition are in red. (C) Edit‐ON (top), Edit‐OFF (middle), and DIFF (bottom) of the 2HG multiplet simulated with 7‐Hz line‐broadening summed over the entire voxel as a function of TE. (D) Integrals of the 2HG multiplets in (c) normalized to the maximum integral over a TE range of 70 ms to 160 ms in each acquisition type. The DIFF integrals as a function of TE are also shown with a T2 relaxation time of 160 ms and 200 ms, the upper and lower bounds of previously reported in vivo T2 relaxation times for Glx, and a T2 relaxation time of 264 ms (as estimated here from the in vivo acquisitions). The DIFF integral reaches a maximum signal intensity at a TE of 90–110 ms with no T2 relaxation, and at a TE of 90 ms with a T2 relaxation time of 264 ms, 160 ms, and 200 ms.
FIGURE 2
FIGURE 2
(A) Simulated edited 2HG and co‐edited Glx multiplets at 4.02 ppm and 3.75 ppm, respectively, in the difference spectra for TE 70 ms and 90 ms with different amounts of line‐broadening: 7‐Hz (top row) and 13‐Hz (bottom row) representing 2 different shimming conditions. At both TEs, the overlap between 2HG and Glx is greater as the line‐broadening gets larger. This overlap is slightly greater at TE 90 ms than at TE 70 ms. (B) Percent overlap between 2HG and Glx as a function of TE. At both 7‐Hz and 13‐Hz linebroadening, the percent overlap increases as the TE increases up to 130–140 ms. (C) Percent absolute error in estimating 2HG with changes in zero‐order phase, baseline, and SNR. Both TEs perform equally well in estimating 2HG with 7‐Hz and 13‐Hz linebroadening.
FIGURE 3
FIGURE 3
(A) Example tumor voxel placement with a size of 3 × 3 × 3 cm3 overlayed on a T2‐weighted FLAIR image as well as the average in vivo spectra (dark blue) plus and minus one SD (light blue) across patients at each TE (N = 14 for TE 90 ms, N = 13 for TE 70 ms, and N = 8 for TE 120 ms). (B) Representative fits to the 2HG‐edited spectra showing high‐quality fits for all three TEs.
FIGURE 4
FIGURE 4
Bar plots of the (A) normalized 2HG integrals, (B) normalized 2HG amplitudes (C) 2HG‐Glx FQNs, and (D) overall FQNs are shown across all patients with data acquired at both TEs of 70 ms and 90 ms (N = 13). 2HG integrals are highest at a TE of 90 and 2HG‐Glx FQNs and overall FQNs are lowest at a TE of 90 ms.
FIGURE 5
FIGURE 5
In vivo spectra at a TE of 70 ms and 90 ms from a voxel with a size of 3 × 3 × 3 cm3 placed in the center of a glioma located in the right hemisphere of one patient showing (A) a worst‐case scenario where substantial residual lipid can be seen in the 1–2.5 ppm range and (B) an average‐case scenario where less residual lipid can be seen. In both cases, however, it can be seen that there is lower lipid contamination at a TE of 90 ms than at a TE of 70 ms. (C) Bar plots of the lipid integrals showing a 26% lower lipid integrals at a TE of 90 ms than at a TE of 70 ms (N = 13). Spectra at a TE of 70 ms and a TE of 90 ms from a glioma voxel located in the brainstem of one patient showing (D) a worst‐case scenario where moderate residual water can be seen in the 4.1–5.5 ppm range and (E) an average‐case scenario where very little residual water can be seen. In the worst‐case scenario, however, it can also be seen that the residual water is lower at a TE of 90 ms than at a TE of 70 ms. (F) Bar plots of the water integrals showing 16% lower water signal at a TE of 90 ms than at a TE of 70 ms (N = 13). Lipid and residual water intensities are expressed in arbitrary units (A.U.) and do not include values from a patient without data acquired at TE 70 ms (due to time constraints). This was done for a fair comparison. Individual data points are plotted as yellow circles for TE 70 ms and as purple dots for TE 90 ms. The spectra within each subfigure (5A, 5B, 5D, and 5E) are from the same patients, while each subfigure features spectra from different patients. Altogether, four patients' spectra are featured in 5a, 5b, 5d, and 5e.
FIGURE 6
FIGURE 6
Integrals of the simulated (A) 2HG and (B) Glx peaks are shown with (orange) and without (blue) the fitted relaxation constants of 264 ms for 2HG and 177 ms for Glx (N = 8). The fitted water integrals with a T2 relaxation constant of 110 ms are also shown in (C) for TEs of 70, 90, and 120 ms (N = 8). Mean in vivo integrals are also shown as yellow circles. All integrals are normalized relative to the maximum integral value across TEs.
FIGURE 7
FIGURE 7
Representative in vivo spectra at a TE of 90 ms from a (A) voxel placed in the original lesion in the right hemisphere and (B) newly‐identified lesion in the contralateral (left) hemisphere. 2HG was fit in both lesions with concentrations greater than 1 i.u. thus confirming the progression of the glioma.

References

    1. Yan H, Parsons DW, Jin G, et al. IDH1 and IDH2 mutations in gliomas. N Engl J Med. 2009;360:765‐773. - PMC - PubMed
    1. Han S, Liu Y, Cai SJ, et al. IDH mutation in glioma: molecular mechanisms and potential therapeutic targets. Br J Cancer. 2020;122:1580‐1589. - PMC - PubMed
    1. Du X, Hu H. The roles of 2‐hydroxyglutarate. Front Cell Dev Biol. 2021;9:651317. - PMC - PubMed
    1. Jezek P. 2‐hydroxyglutarate in cancer cells. Antioxid Redox Signal. 2020;33:903‐926. - PMC - PubMed
    1. Choi C, Raisanen JM, Ganji SK, et al. Prospective longitudinal analysis of 2‐hydroxyglutarate magnetic resonance spectroscopy identifies broad clinical utility for the Management of Patients with IDH‐mutant glioma. J Clin Oncol. 2016;34:4030‐4039. - PMC - PubMed