. 2025 May 20;139(11):527-543.
doi: 10.1042/CS20242965. Online ahead of print.

Increased absorptive transcytosis and tight junction weakness in heart failure are equally corrected by exercise training and losartan

Affiliations

Increased absorptive transcytosis and tight junction weakness in heart failure are equally corrected by exercise training and losartan

Hiviny de Ataides Raquel et al. Clin Sci (Lond). .

Abstract

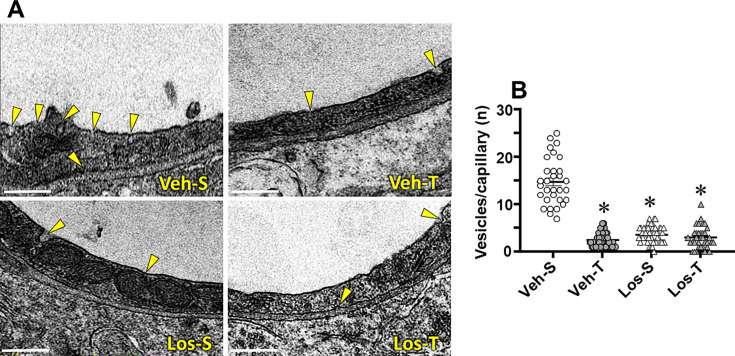
Reduced ventricular function, renin-angiotensin system upregulation and sympathoexcitation are hallmarks of heart failure (HF). Recently we showed that blood-brain barrier (BBB) lesion within autonomic nuclei contributes to autonomic imbalance and that exercise training (T) normalizes BBB function and improves autonomic control. We sought now to identify the mechanism( involved in both HF-induced lesion and exercise-induced correction. Wistar rats submitted to coronary artery ligation were, after the development of HF, assigned to losartan (Los) or vehicle (Veh) treatments and simultaneously submitted to T or sedentary ( protocol. After hemodynamic/autonomic recordings and evaluation of BBB permeability, brains were harvested for ultrastructural analyses of the barrier (tight junctions (TJ) tightness and vesicles trafficking) within capillaries of the hypothalamic paraventricular nucleus. Local angiotensin II (Ang II) expression and activation of microglial cells (IBA-1 immunofluorescence) were also evaluated. High sympathetic activity and pressure variability, reduced parasympathetic control of the heart, elevated BBB permeability, high vesicular trafficking and TJ weakness exhibited by Veh-rats were equally corrected in Veh-T, Los-and Los-T groups. The increased PVN Ang II expression and IBA-1 density in Veh-group were similarly reduced by T, Los and combination of both. Ang II, colocalized with microglia AT1 receptors, induced their remodeling from disease-associated phenotype in Veh-S rats to homeostatic-surveilling conditions in the other groups. All measured parameters exhibited strong correlations with Ang II availability. Data indicated that changes in PVN Ang II availability induced by HF, exercise and losartan is the key regulator of transcellular and paracellular transport across the BBB.

Keywords: absorptive transcytosis; angiotensin II; blood-brain barrier; heart failure; microglia; tight junctions.


Conflict of interest statement

The authors declare that there are no competing interests associated with the manuscript.

Figures

Figure 1
Figure 1. Timeline of experimental protocols.
Some rats died after heart failure (HF) induction, others were excluded for not meeting the inclusion criteria and were killed by an overdose of ketamine + xylazine. MET, maximal exercise test performed on treadmill.
Figure 2
Figure 2. Treadmill performance and values of cardiovascular and autonomic parameters in heart failure rats treated with vehicle (Veh) or losartan (Los) and submitted to sedentary (S) or training (T) protocol.
(A) Running time on treadmill: Comparisons made by three-way ANOVA with repeated measurements; time F(2,40)=4.27, P=0.027; group F(1,20)=0.96 , P=0.338; condition F(1,20)=37.69, P<0.001; time × group F(2,40)=6.26, P=0.004; time × condition F(2,40)=55.40, P<0.001; group × condition F(1,20)=0.02, P=0.884; time × group × condition F(2,40)=0.03, P=0.970. Significances (P<0.05): # vs. week 0; vs. S. Bar graphs compare resting values of arterial pressure and heart rate, their variabilities and spectral components (n = 6 rats/group). Comparisons made by two-way factorial ANOVA. (B) MAP: group F(1,20) = 1.09, P=0.310; condition F(1,20) = 2.29, P=0.146; interaction F(1,20)=12.46, P=0.002. (C) SAP variability: group F(1,20) = 10.14, P=0.005; condition F(1,20) = 10.45, P=0.004; interaction F(1,20)=1.54, P=0.229. (D) LF-SAP: group F(1,20) = 3.90, P=0.062; condition F(1,20) = 9.02, P=0.007; interaction F(1,20)=4.28, P=0.051. (E) Alpha HF: group F(1,20) = 0.02, P=0.903; condition F(1,20) = 4.93, P=0.038; interaction F(1,20)=3.82, P=0.065. (F) HR: group F(1,20) = 1.25, P=0.277; condition F(1,20) = 3.31, P=0.587; interaction F(1,20)=0.06, P=0.814. (G) PI variability: group F(1,20) = 0.02, P=0.887; condition F(1,20) = 20.26, P<0.001; interaction F(1,20)=6.86, P=0.016. (H) LF-PI: group F(1,20) = 2.56, P=0.125; condition F(1,20) = 1.57, P=0.225; interaction F(1,20)=0.06, P=0.816. (I) HF-PI: group F(1,20) = 4.56, P=0.045; condition F(1,20) = 2.47, P=0.132; interaction F(1,20)=5.69, P=0.027. Significances (P<0.05):*vs. Veh-S; vs. Veh-T
Figure 3
Figure 3. Blood–brain barrier permeability changes in heart failure rats treated with vehicle (Veh) or losartan (Los) and submitted to sedentary (S) or training (T) protocol.
(A) Photomicrographs show the capillary network (Rhodamine-70kDa, red), the FITC-10kD leakage into the brain parenchyma (green), and the colocalization of both inside vessels (white) within the paraventricular nucleus of the hypothalamus (PVN). 3V, third ventricle, scale bar: 50 µm. (B) Illustrative figure with superimposed rectangle over the ventromedial nucleus (vm) indicates the ROI in which the measurements were made. (C) Effects of treatment and exercise on FITC-10kD leakage within the PVNvm. Values obtained in 10–12 slices/rat, three rats/group. Comparisons made by two-way factorial ANOVA: group F(1,122)=69.50, P<0.001; condition F(1,122)=116.10, P<0.001; interaction F(1,122)=70.64, P<0.001. Significance (P<0.05): *vs. Veh-S.
Figure 4
Figure 4. Transcellular vesicles/capillary in heart failure rats treated with vehicle (Veh) or losartan (Los) and submitted to sedentary (S) or training (T) protocol.
(A) Electron microscopy photomicrographs depict the transcellular vesicles (yellow arrow heads) being formed in the luminal and abluminal borders of the capillary endothelial cell. Scale bar: 500 nm (B) Effects of treatment and exercise on vesicles’ number within PVNvm capillaries. values obtained in 12–15 capillaries/rat, three rats/group. Comparisons made by two-way factorial ANOVA. For F and P values, see Table 2. Significance (P<0.05): *vs. Veh-S.
Figure 5
Figure 5. Tight junction (TJ) occupancy of capillary borders in heart failure rats treated with vehicle (Veh) or losartan (Los) and submitted to sedentary (S) or training (T) protocol.
(A) Electron microscopy photomicrographs indicate the TJ extension (yellow bracket) in the border of neighboring endothelial cells. Scale bar: 500 nm. (B) Effects of Los and exercise on TJ extension/capillary border within PVNvm capillaries. values obtained in five to seven capillaries/rat, three rats/group. Comparisons made by two-way factorial ANOVA. For F and P values, see Table 2. Significance (P<0.05): *vs. Veh-S. PVN, paraventricular hypothalamic nucleus.
Figure 6
Figure 6. Angiotensin II (Ang II) and microglia (IBA-1) expression and the colocalization of both in heart failure rats treated with vehicle (Veh) or losartan (Los) and submitted to sedentary (S) or training (T) protocol.
(A) Representative PVN images illustrating Ang II (red) and IBA-1 immunoreactivity (green) within the ventromedial nucleus (superimposed rectangle) in which measurements were made. The small square indicates the microglial cell whose magnified images (insets at right) depict Ang II-microglia colocalization (yellow) in soma and processes as analyzed in merged pictures (upper corner) or quantified by means of superimposed binary images (lower corner). Scale bar: 50 μm. 3V, third cerebral ventricle. Bar graphs at the right indicate the quantitative analysis of Ang II (B) and IBA-1 (C) immunoreactivity and the colocalization of both (D). Comparisons made by two-way factorial ANOVA. Values are means of six to eight slices/rat/four rats/group. ang II: group F(1,12)=67.98, P<0.001; condition F(1,12)=18.41, P=0.001; interaction F(1,12)=15.38, P=0.002. IBA-1: group F(1,12)=13.93, P=0.003; condition F(1,12)=79.23, P<0.001; interaction F(1,12)=25.47, P<0.001. Colocalization: group F(1,12)=74.00, P<0.001; condition F(1,12)=50.67, P<0.001; interaction F(1,12)=23.48, P<0.001. Significances (P<0.05): *vs. Veh-S; vs. Veh-T. PVN, paraventricular hypothalamic nucleus.
Figure 7
Figure 7. Angiotensin type 1 receptor (AT 1 R) expression in microglial cells of heart failure rats treated with vehicle (Veh) or losartan (Los) and submitted to sedentary (S) or training (T) protocol.
Representative PVN images illustrating AT1R (red) and IBA-1 immunoreactivity (green) within the within the PVNvm (superimposed rectangle). The small square indicates the microglial cell whose magnified images (insets at right) depict Ang II-microglia colocalization (yellow) in soma and processes in merged pictures (right upper corner) and the superimposed binary images (right lower corner). Scale bar: 50 μm. 3V, third cerebral ventricle; PVN, paraventricular hypothalamic nucleus.
Figure 8
Figure 8. Morphological changes of microglia in heart failure rats treated with vehicle (Veh) or losartan (Los) and submitted to sedentary (S) or training (T) protocol.
(A) PVN images depicting IBA-1 immunoreactivity (blue) in rats representative of their experimental groups. The superimposed rectangle over the PVNvm indicates the ROI in which measurements were made; the small square indicates the microglial cell whose magnified image (insets at right) shows its morphology (upper corner) or the analysis of soma size (dark blue), processes number/length (red), and endpoints (green) quantified by means of NeurphologyJ plugin to ImageJ (lower corner). Scale bar: 50 μm. 3V, third cerebral ventricle. Bar graphs at the right indicate the quantitative analysis of cell number (B), soma size index (C), endpoints (D), processes number (E), and length (F). Comparisons made by two-way factorial ANOVA. Values are means of six to eight slices/rat/four rats/group. Cell number: group F(1,12)=0.58, P=0.461; condition F(1,12)=0.02, P=0.881; interaction F(1,12)=0.02, P=0.881. Soma size index: group F(1,12)=23.60, P<0.001; condition F(1,12)=10.45, P=0.007; interaction F(1,12)=3.67, P=0.080. Endpoints: group F(1,12)=9.78, P=0.009; condition F(1,12)=24.32, P<0.001; interaction F(1,12)=7.78, P=0.016. Processes number: group F(1,12)=0.38, P=0.551; condition F(1,12)=11.79, P=0.005; interaction F(1,12)=1.82, P=0.202. Processes length: group F(1,12)=0.04, P=0.841; condition F(1,12)=6.69, P=0.024; interaction F(1,12)=2.82, P=0.119. Significances (P<0.05): *vs. Veh-S. PVN, paraventricular hypothalamic nucleus.
Figure 9
Figure 9. Correlations between BBB permeability, transport mechanisms across the barrier, microglia activity, and autonomic control with angiotensin II (Ang II) availability within the PVNvm in heart failure rats treated with vehicle or losartan and submitted to sedentary or training protocol.
Plots in panels A–D were made with values obtained in a large number of capillaries, Ang II, and IBA-1 double-labeled slices, whereas panels E and F were made with autonomic measurements in each rat and its respective mean Ang II immunoreactivity. Linear regression equations, correlation coefficients, and P values are Vesicles/capillary × Ang II Y = 0.70 × –1.12, r = 0.895, P<0,001; TJ/capillary border × Ang II Y = –2.36 × + 94.94, r = 0.881, P<0,001; IBA-1 if × Ang II Y = 0.64 × + 6.29, r = 0.855, P<0,001; FITC leakage × Ang II Y = 0.47 × –1.18, R = 0.824, P<0,001; LF-SAP × Ang II Y = 0.43 × –0.34, R = 0.889, P<0,001; SAP variability × Ang II Y = 1.27 × + 0.53, r = 0.935, P<0,001. * denotes a significant correlation. BBB, blood–brain barrier; SAP, systolic arterial pressure; TJ, tight junction.
Figure 10
Figure 10. Schematic drawing depicting main effects of angiotensin II availability on blood–brain barrier (BBB), microglia morphology/activity, and sympathetic activity in heart failure (HF) rats treated with vehicle (Veh) or losartan (Los) and submitted to sedentary (S) or training (T) protocol.

Similar articles

References

    1. Braunwald E. Heart failure. JACC Heart Fail. 2013;1:1–20. doi: 10.1016/j.jchf.2012.10.002. - DOI - PubMed
    1. Bui A.L., Horwich T.B., Fonarow G.C. Epidemiology and risk profile of heart failure. Nat. Rev. Cardiol. 2011;8:30–41. doi: 10.1038/nrcardio.2010.165. - DOI - PMC - PubMed
    1. Fahim M., Gao L., Mousa T.M., Liu D., Cornish K.G., Zucker I.H. Abnormal baroreflex function is dissociated from central angiotensin II receptor expression in chronic heart failure. Shock. 2012;37:319–324. doi: 10.1097/SHK.0b013e31824581e8. - DOI - PMC - PubMed
    1. Zucker I.H., Xiao L., Haack K.K.V. The central renin–angiotensin system and sympathetic nerve activity in chronic heart failure. Clin. Sci. 2014;126:695–706. doi: 10.1042/CS20130294. - DOI - PMC - PubMed
    1. Florea V.G., Cohn J.N. The autonomic nervous system and heart failure. Circ. Res. 2014;114:1815–1826. doi: 10.1161/CIRCRESAHA.114.302589. - DOI - PubMed