. 2025 Aug;37(34):e2504389.
doi: 10.1002/adma.202504389. Epub 2025 May 21.

Engineering Bacterial Secretion Systems for Enhanced Tumor Imaging and Surgical Guidance

Affiliations

Engineering Bacterial Secretion Systems for Enhanced Tumor Imaging and Surgical Guidance

Dohee Lee et al. Adv Mater. 2025 Aug.

Abstract

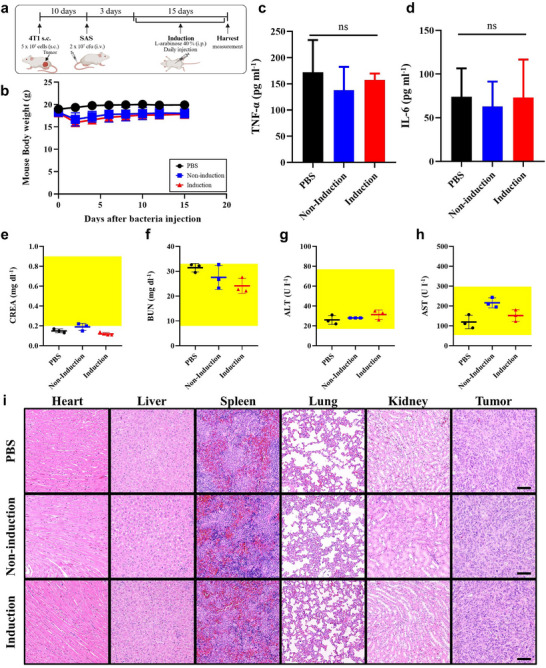
Current imaging techniques suffer from a lack of specificity and resolution, leading to inaccurate tumor imaging and limited applicability of targeted contrast agents, as they require cancer-specific development. The need for enhanced contrast through improved tumor-to-background ratio (TBR) and the toxicity from repeated injections due to fading fluorescent signals further complicate the issue. Additionally, challenges in visualizing the entire 3D tumor with surface-stained contrast agents highlight the demand for advanced imaging solutions for more precise surgical guidance. A novel approach is proposed utilizing Streptavidin Associated Salmonella (SAS) as a contrast agent for image-guided surgeries. SAS selectively proliferates in cancerous tissues and secretes streptavidin upon induction, enabling the binding of subsequently injected biotin-conjugated fluorescent dyes. This approach enhances tumor visualization with a TBR of up to 15.3, far surpassing conventional agents (TBR ∼ 2), while enabling prolonged 3-day imaging, deep tumor penetration, and precise invasive margin delineation with a single contrast agent injection. Furthermore, biosafety evaluations confirmed efficient bacterial clearance, absence of systemic toxicity, and stable physiological responses, supporting its potential for safe clinical translation. This innovative method offers substantial improvements over existing fluorescent contrast agents and holds promise for both diagnostic and therapeutic applications in cancer surgery.

Keywords: bacteria‐based tumor visualization; fluorescence image‐guided surgery; fluorescent contrast agents; streptavidin‐associated Salmonella (SAS); surgical guidance.


Conflict of interest statement

The authors declare no conflict of interest.

Figures

Figure 1
Figure 1
Schematic for fluorescence‐guided surgery system based on Streptavidin‐Associated Salmonella.
Figure 2
Figure 2
Engineering of Salmonella expressing flgM‐streptavidin fusion proteins. a) Plasmid map of flgM‐streptavidin for the expression and secretion of recombinant streptavidin, tagged with flgM at the N‐terminus and 6x His. b) Salmonella secreting FlgM‐Streptavidin was incubated in LB at 37 °C for 1 h, and secretion was induced by 0.04% L‐arabinose. After 6 h of further incubation, equal amounts of whole cells, pellet, and supernatant were obtained, and expression was analyzed by western blot using an anti‐His antibody and anti‐Flag antibody. Anti‐DnaK antibody was used as a cell lysis control. c) Growth curve (OD600) measurement. (n = 3) Data are presented as the mean ± SEM. d) Western blot analysis using an anti‐His antibody to assess secretion at indicated time points after L‐arabinose induction in a strain designed to secrete streptavidin. e) Quantification of FlgM‐Streptavidin using anti‐His ELISA in samples obtained at the end of L‐arabinose induction. f) Schematic for streptavidin secretion verification using a HABA assay. g) Absorbance at 500 nm (OD500) varying through streptavidin secretion when bound to HABA. (red: w/ biotin‐Cy7 & black: w/o biotin‐Cy7). h) Verification of streptavidin functionalization on the bacterial surface through biotin‐Cy7 dye staining (scale bar = 5 µm). i) Fluorescently labeled bacteria showing the proportion of bacteria secreting streptavidin. (red: w/o L‐arabinose & black: w/ L‐arabinose) Statistical analyses were performed using paired t‐tests. (*p < 0.05).
Figure 3
Figure 3
Validation of enhanced intra‐tumoral fluorescent signal retention via SAS. a) Schematic diagram of the in vitro experiment using agar. b) Time‐dependent fluorescence images at the Z1 position from (a). c) Fluorescent signal intensity profile (0‐255) from (b). (n = 3) (d) Fluorescent signal intensity profile from (b) normalized to the control group. (n = 3). e) Schematic diagram of the in vivo experiment. f) IVIS images of mice over time (filter set: λ exc = 745 nm, λ emi = 800 nm). g) Time‐dependent fluorescent signal intensity in the tumor, normalized to the initial radiance value, with a dotted line indicating 3 h for reference. (n = 3) h) Relative fluorescent signal from (e), normalized to the control group. (n = 3) Statistical analysis was performed using paired t‐tests, comparing SAS (+) and control groups. (*p < 0.05).
Figure 4
Figure 4
Tumor visualization and 3D contrast enhancement via SAS penetration. a) Schematic diagram of the in vivo experiment. b) Fluorescence images of tumors and adjacent skin captured using IVIS and a macroscope at 2, 6, and 12 h post‐incubation (Scale bar = 1 cm). c) TBR, with statistical comparisons between the SAS(+) group and each of the other individually. (n = 3) d) Relative fluorescent signal intensity of the tumor, normalized to each respective control group, with statistical analysis results included. (n = 3) e) Schematic diagram of the three‐dimensional visualization experiment. f) Macroscope fluorescence images of the tumor after dissection into five equal parts (Scale bar = 1 cm). g) Average fluorescent signal intensity (0‐255) across the dissected surfaces. h) Bacterial selective colonization in the hypoxic region of a 4T1 tumor, with region 1 indicating the active tumor area and region 2 indicating the hypoxic region (blue: DAPI staining; green: SAS with FITC plasmid, scale bar = 1mm). Statistical analyses were performed using paired t‐tests, comparing control and SAS (−) to SAS (+) groups. (*p < 0.05).
Figure 5
Figure 5
Analysis of surgical tissues to confirm the accuracy of FGS in the orthotopic 4T1 tumor model. Fluorescent areas were excised in two steps during surgery, while a non‐fluorescent surrounding area was excised once for analysis. a) Schematic representation of FGS using the orthotopic mouse model. b) Schematic illustration of the actual excised tissue based on the H&E image analysis from (c). c) Bright field and fluorescence filter images captured during surgery, with red dotted lines indicating excised tissues. H&E images of the excised tissues (scale bar = 500 µm) and magnified images of the boxed areas (scale bar = 50 µm) (T: Tumor, N: Normal tissue). d) Fluorescence images and H&E images in different tumor sizes (white scale bar = 2 mm, black scale bar = 200 µm) (T: Tumor, N: Normal tissue).
Figure 6
Figure 6
Streptavidin‐secreting Salmonella demonstrates biological safety in vivo. a) Experimental design in mice bearing 4T1 tumors (n = 3). Salmonella secreting streptavidin (2 x 107 CFU) was intravenously injected, and observations were made on day 15. b) Body weight changes in mice after Salmonella administration. c) TNF‐α levels measured in serum on day 15 post‐administration. d) IL‐6 levels measured in serum on day 15 post‐administration. e–h) Biochemical indicators, including CREA, BUN, ALT, and AST, measured in serum on day 15 post‐administration. The yellow‐shaded areas represent the average normal range (n = 3). Data are presented as mean ± SEM. e) 0.2–0.9 mg/dL. f) 8–33 mg/dL. g) 17–77 U/I. h) 54–298 U/I. i) Representative histological images of various tissues from tumor‐bearing mice treated with Salmonella. Tissue sections (heart, liver, spleen, lung, kidney, and tumor) were prepared on day 15 after Salmonella treatment and stained with H&E. (Scale bar = 50 µm) Statistical analyses were performed using paired t‐tests. (*p < 0.05).

References

    1. Lyon F., global Cancer Burden Growing, Amidst Mounting Need For Services, https://www.who.int/news/item/01‐02‐2024‐global‐cancer‐burden‐growing–am..., “[Online; World Health Organization News]” 2024. - PMC - PubMed
    1. Orosco R. K., Tapia V. J., Califano J. A., Clary B., Cohen E. E., Kane C., Lippman S. M., Messer K., Molinolo A., Murphy J. D., Tapia V. J., Califano J. A., Clary B., Cohen E. E. W., Kane C., Lippman S. M., Messer K., Molinolo A., Murphy J. D., Pang J., Sacco A., Tringale K. R., Wallace A., Nguyen Q. T., Sci. Rep. 2018, 8, 5686. - PMC - PubMed
    1. Mieog J. S. D., Achterberg F. B., Zlitni A., Hutteman M., Burggraaf J., Swijnenburg R.‐J., Gioux S., Vahrmeijer A. L., Nat. Rev. Clin. Oncol. 2022, 19, 9. - PubMed
    1. Wang K., Chi C., Hu Z., Liu M., Hui H., Shang W., Peng D., Zhang S., Ye J., Liu H., et al., Engineering 2015, 1, 309.
    1. Stewart H. L., Birch D. J., Methods and Applications in Fluorescence 2021, 9, 042002. - PubMed

LinkOut - more resources