Capture of Longitudinal Change in Real-Life Walking in Cerebellar Ataxia Increases Patient Relevance and Effect Size
- PMID: 40395207
- PMCID: PMC12273614
- DOI: 10.1002/mds.30230
Capture of Longitudinal Change in Real-Life Walking in Cerebellar Ataxia Increases Patient Relevance and Effect Size
Abstract
Background: With disease-modifying drugs for degenerative ataxias on the horizon, ecologically valid measures of gait performance that can detect patient-relevant changes in trial-like time frames are highly warranted.
Objectives: In this 2-year longitudinal study, we aimed to unravel ataxic gait measures sensitive to longitudinal changes in patients' real lives using wearable sensors.
Methods: We assessed longitudinal gait changes of 26 participants with degenerative cerebellar disease (Scale for the Assessment and Rating of Ataxia [SARA]: 9.4 ± 4.1) at baseline, 1-year, and 2-year follow-up using three body-worn inertial sensors in two conditions: (1) laboratory-based walking (LBW); and (2) real-life walking (RLW). In RLW, a context-sensitive analysis was performed by selecting comparable walking bouts according to macroscopic gait characteristics. Gait analysis focused on measures of spatio-temporal variability, particularly stride length variability, lateral step deviation, and a compound measure of spatial variability (SPCmp).
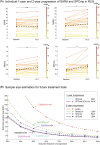
Results: Gait variability measures showed high test-retest reliability in both walking conditions (intraclass correlation coefficient [ICC], ≥0.82). Cross-sectional analyses revealed high correlations of gait measures with ataxia severity (SARA, effect size ρ ≥ 0.75); and with patients' subjective balance confidence (Activity-specific Balance Confidence scale [ABC]: ρ ≥ 0.71). Although SARA showed longitudinal changes only after 2 years, the gait measure SPCmp revealed changes after 1 year with high effect size (rprb = 0.80). Sample size estimation for the gait measure SPCmp showed a required cohort size of n = 42 participants (n = 38; spinocerebellar ataxias [SCA]1/2/3 subgroup) to detect a 50% reduction in progression at 1 year with a hypothetical intervention, compared to n = 147 for SARA at 2 years.
Conclusions: Because of their ecological validity and larger effect sizes, real-life gait characteristics represent promising performance measures as outcomes for future treatment trials. © 2025 The Author(s). Movement Disorders published by Wiley Periodicals LLC on behalf of International Parkinson and Movement Disorder Society.
Keywords: biomarker; cerebellar ataxia; digital health; real‐life walking; wearable sensors.
© 2025 The Author(s). Movement Disorders published by Wiley Periodicals LLC on behalf of International Parkinson and Movement Disorder Society.
Figures


References
-
- Klockgether T, Ashizawa T, Brais B, et al. Paving the way toward meaningful trials in ataxias: an ataxia global initiative perspective. Mov Disord 2022;37:1125–1130. - PubMed
-
- Globas C, du Montcel ST, Baliko L, et al. Early symptoms in spinocerebellar ataxia type 1, 2, 3, and 6. Mov Disord 2008;23:2232–2238. - PubMed
-
- Ilg W, Branscheidt M, Butala A, et al. Consensus paper: neurophysiological assessments of ataxias in daily practice. Cerebellum 2018;17:628–653. - PubMed
MeSH terms
Grants and funding
LinkOut - more resources
Full Text Sources
Research Materials

