

A proteotranscriptomic approach to dissect the molecular landscape of human retinoblastoma
- PMID: 40395327
- PMCID: PMC12088971
- DOI: 10.3389/fonc.2025.1571702
A proteotranscriptomic approach to dissect the molecular landscape of human retinoblastoma
Abstract
Background: Retinoblastoma is a rare pediatric eye cancer caused by mutations in the RB1 gene, which regulates retinal cell growth. Early detection and treatment are critical for preventing vision loss and improving survival outcomes. This study aimed to perform an integrated proteotranscriptomic characterization of human retinoblastoma to provide a deeper understanding of disease biology and to identify novel therapeutic targets.
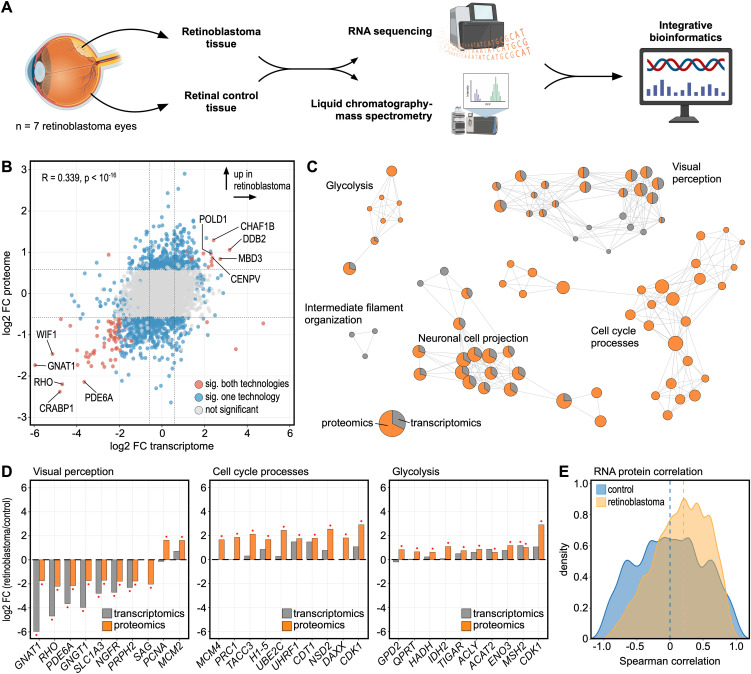
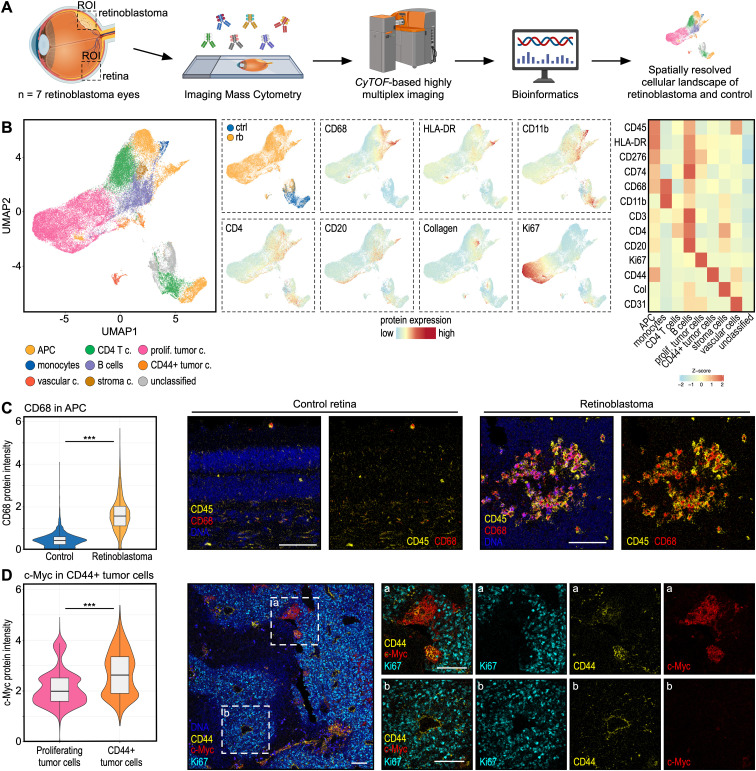
Methods: Paired tumor and adjacent retinal tissue samples were dissected from seven eyes. RNA sequencing and liquid chromatography-mass spectrometry were performed on the same samples. The spatially resolved cellular landscape was assessed using Imaging Mass Cytometry (IMC).
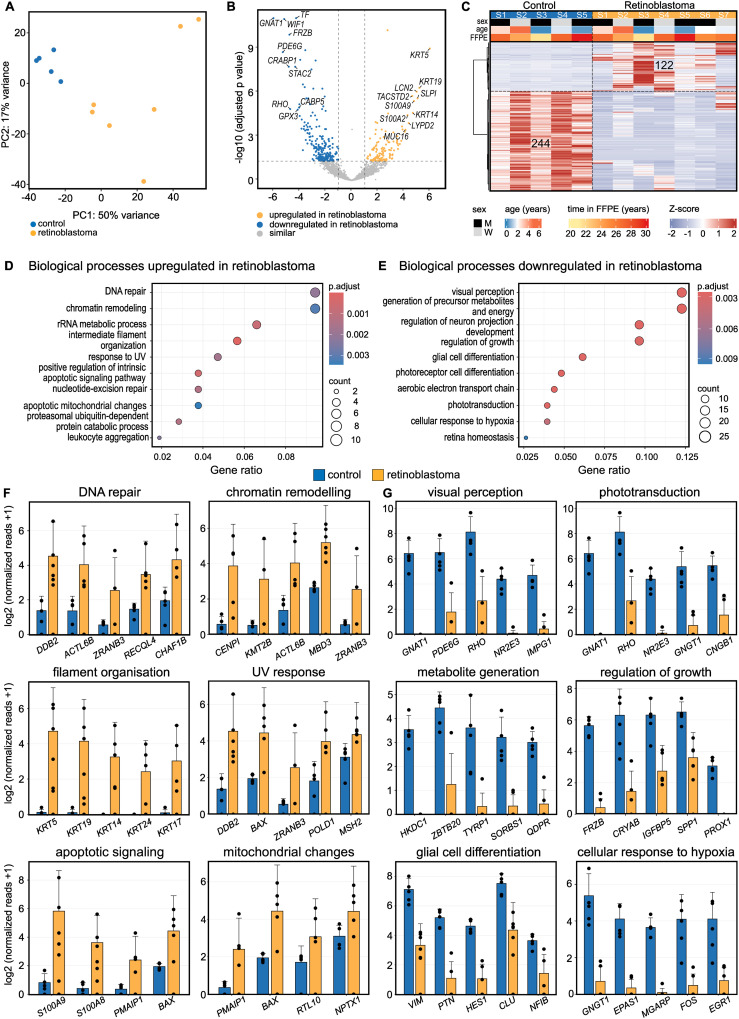
Results: The correlation between RNA and protein level was moderate with variations across different pathways, underscoring the value of an integrated proteotranscriptomic approach. IMC identified more than 67,000 single cells in 11 distinct clusters, including antigen presenting cells, T cells, stroma cells, vascular cells and two clusters of proliferating and CD44/c-Myc positive tumor cells. Antigen presenting cells expressed higher levels of CD68 in retinoblastoma compared to controls.
Conclusions: CD44+ and high-c-Myc-expressing tumor cells may represent cancer stem cells with possible involvement in metastasis, warranting further validation. Our multilayered approach could pave the way for enhanced molecular assessments and novel targeted therapies for human retinoblastoma.
Keywords: IMC; proteomics; proteotranscriptomics; retinoblastoma; transcriptomics; translational medicine.
Copyright © 2025 Wolf, Hajdu, Boneva, Godbole, Stürzbecher, Auw-Haedrich, Lagrèze, Agostini, Reinhard, Tholen, Schilling, Schlunck, Bengsch and Lange.
Conflict of interest statement
The authors declare that the research was conducted in the absence of any commercial or financial relationships that could be construed as a potential conflict of interest. The author(s) declared that they were an editorial board member of Frontiers, at the time of submission. This had no impact on the peer review process and the final decision.
Figures
Similar articles
-
Retinoblastoma.2025 Feb 17. In: StatPearls [Internet]. Treasure Island (FL): StatPearls Publishing; 2025 Jan–. 2025 Feb 17. In: StatPearls [Internet]. Treasure Island (FL): StatPearls Publishing; 2025 Jan–. PMID: 31424860 Free Books & Documents.
-
Dissecting the Transcriptional and Chromatin Accessibility Heterogeneity of Proliferating Cone Precursors in Human Retinoblastoma Tumors by Single Cell Sequencing-Opening Pathways to New Therapeutic Strategies?Invest Ophthalmol Vis Sci. 2021 May 3;62(6):18. doi: 10.1167/iovs.62.6.18. Invest Ophthalmol Vis Sci. 2021. PMID: 34003213 Free PMC article.
-
Simultaneous identification of clinically relevant RB1 mutations and copy number alterations in aqueous humor of retinoblastoma eyes.Ophthalmic Genet. 2020 Dec;41(6):526-532. doi: 10.1080/13816810.2020.1799417. Epub 2020 Aug 17. Ophthalmic Genet. 2020. PMID: 32799607 Free PMC article.
-
Genetics and Molecular Diagnostics in Retinoblastoma--An Update.Asia Pac J Ophthalmol (Phila). 2017 Mar-Apr;6(2):197-207. doi: 10.22608/APO.201711. Asia Pac J Ophthalmol (Phila). 2017. PMID: 28399338 Review.
-
Differential expression of genes in retinoblastoma.Clin Chim Acta. 2011 Nov 20;412(23-24):2015-21. doi: 10.1016/j.cca.2010.10.009. Epub 2010 Oct 14. Clin Chim Acta. 2011. PMID: 20951689 Review.
References
-
- Munier FL, Beck-Popovic M, Chantada GL, Cobrinik D, Kivela TT, Lohmann D, et al. . Conservative management of retinoblastoma: Challenging orthodoxy without compromising the state of metastatic grace. “Alive, with good vision and no comorbidity. Prog Retin Eye Res. (2019) 73:100764. doi: 10.1016/j.preteyeres.2019.05.005 - DOI - PubMed
LinkOut - more resources
Full Text Sources
Miscellaneous