

Predicting recurrence risk in endometrial cancer: a multisequence MRI intratumoral and peritumoral radiomics nomogram approach
- PMID: 40395329
- PMCID: PMC12088970
- DOI: 10.3389/fonc.2025.1569729
Predicting recurrence risk in endometrial cancer: a multisequence MRI intratumoral and peritumoral radiomics nomogram approach
Abstract
Objective: To assess the predictive value of a nomogram model incorporating clinical factors and multisequence MRI intratumoral and peritumoral radiomics features for estimating recurrence risk in endometrial cancer (EC) patients.
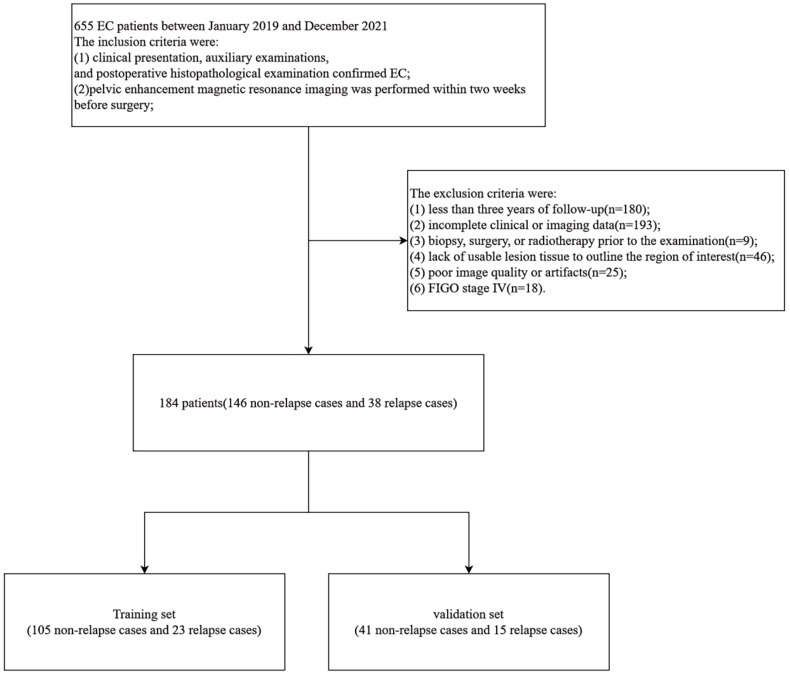
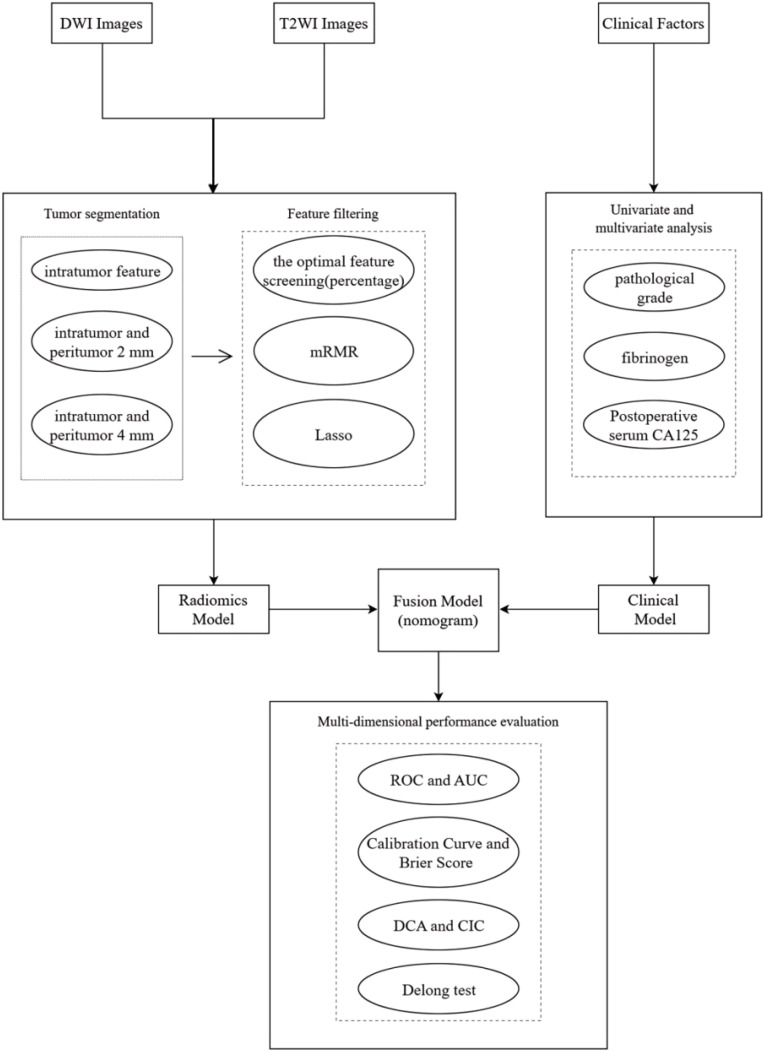
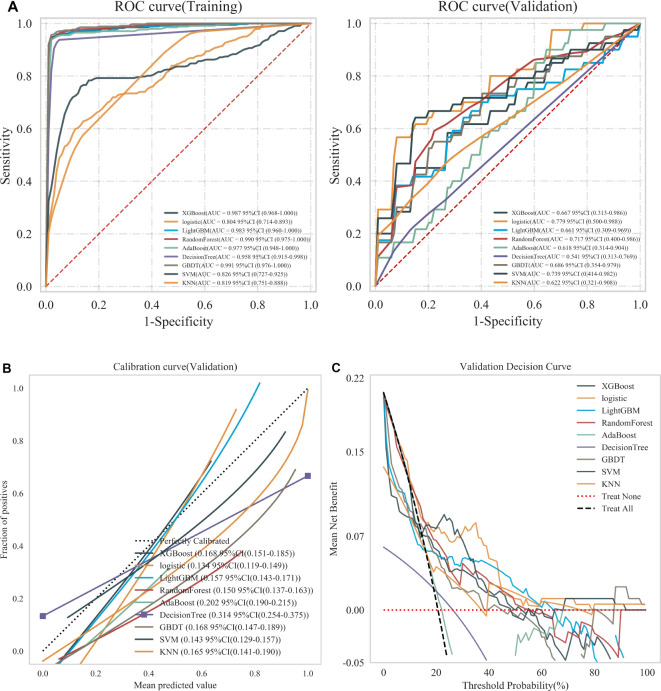
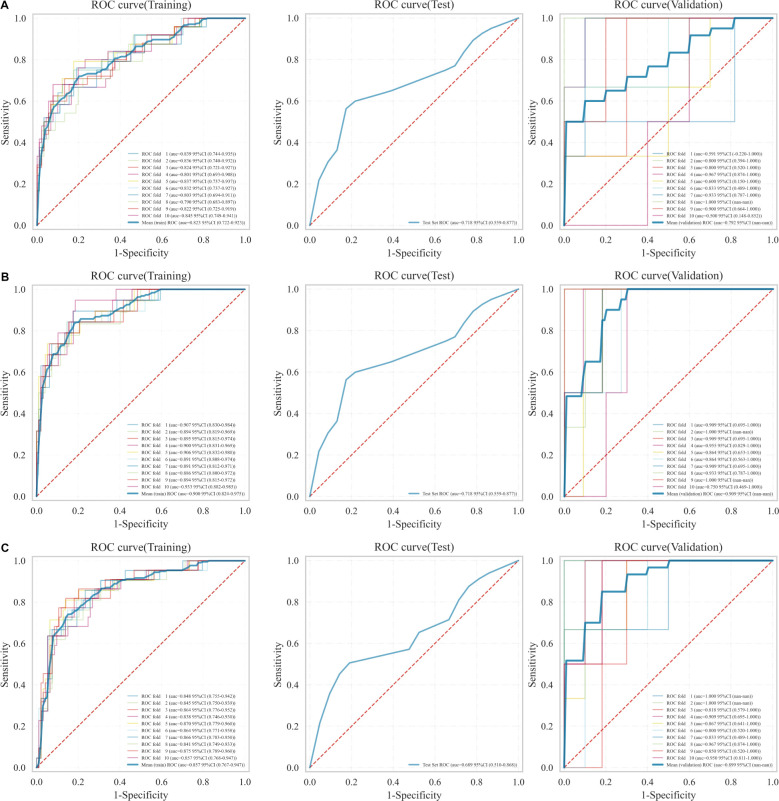
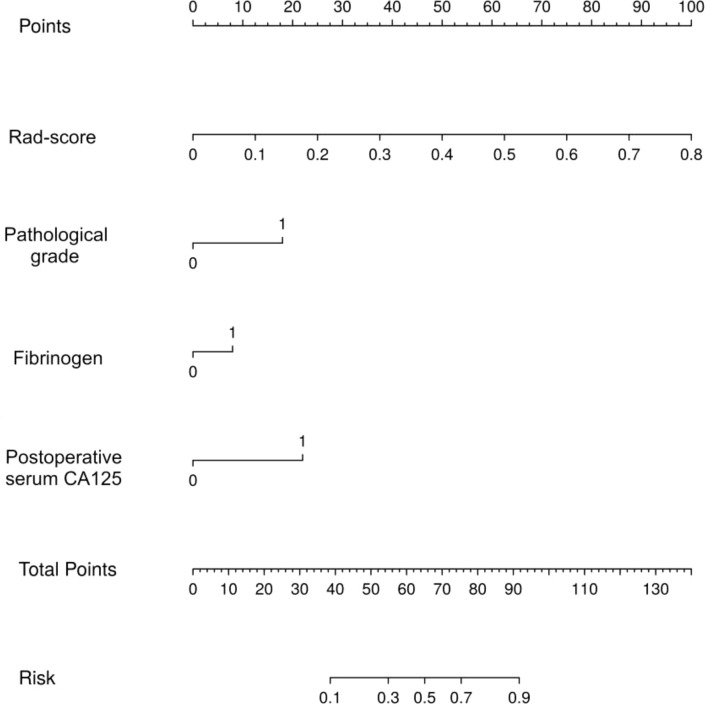
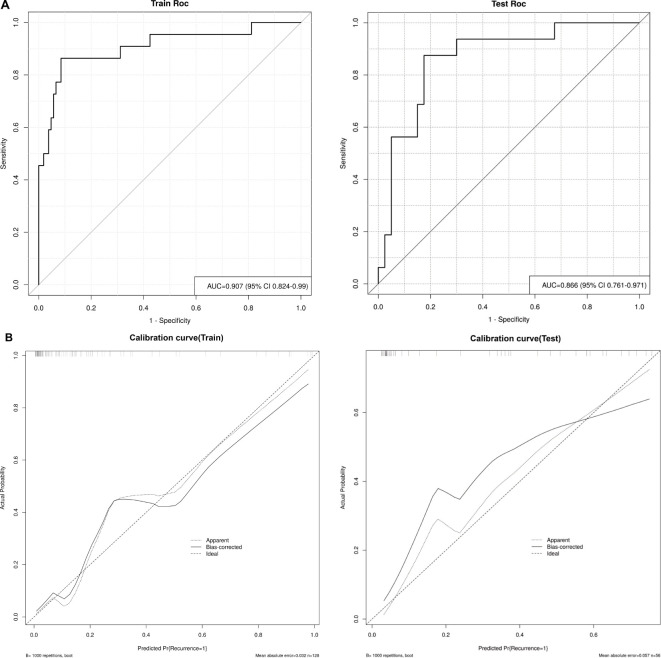
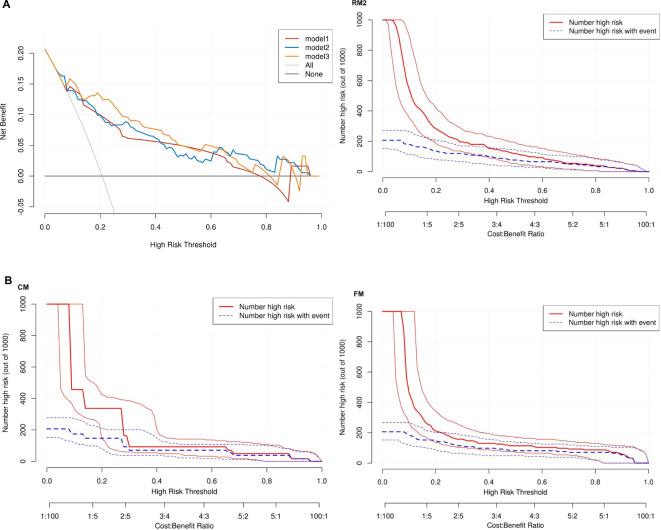
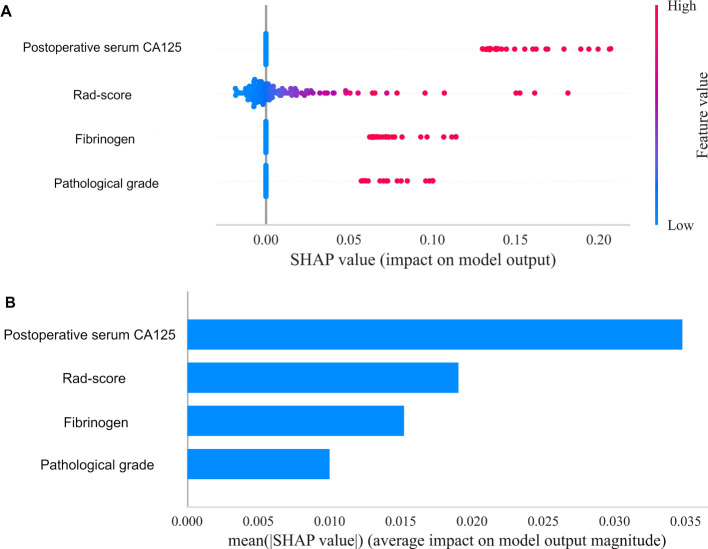
Materials and methods: This retrospective study included 184 patients with EC. The samples were randomly divided into a training set and a test set according to a 7:3 ratio, and intratumoral and peritumoral radiomics features were extracted from diffusion-weighted imaging (DWI) and T2-weighted imaging (T2WI) sequences. Optimal radiomics features were selected using the f-classification function, minimum redundancy maximum relevance (mRMR) method, and least absolute shrinkage and selection operator (Lasso). Nine machine learning classifiers were employed to construct the intratumoral model (RM1). The best-performing classifiers were then used to develop the intratumoral and peritumoral 2 mm radiomics model (RM2) and the intratumoral and peritumoral 4 mm radiomics model (RM3). The radiomics scores (Rad-score) from the top-performing radiomics model were combined with clinical factors to create the nomogram model (FM). The predictive performance of the FM model was evaluated using receiver operating characteristic (ROC) curve analysis, calibration curve assessment, clinical decision curve analysis (DCA), clinical impact curve (CIC), and the DeLong test. Feature importance analysis using the SHapley Additive exPlanations (SHAP) methodology.
Results: The logistic regression classifier (LR) showed optimal predictive efficacy, and RM2 demonstrated the best diagnostic performance. The clinical decision curve and DeLong test results indicated that the FM model was the optimal recurrence model in EC patients.
Conclusion: A nomogram model integrating MRI radiomics features from intratumoral and peritumoral regions and clinical factors effectively predicts recurrence in EC patients.
Keywords: endometrial cancer; machine learning; magnetic resonance imaging; peritumoral radiomics; recurrence.
Copyright © 2025 Li, Ma, Chen, Wei, Xu, Zhao and Gao.
Conflict of interest statement
The authors declare that the research was conducted in the absence of any commercial or financial relationships that could be construed as a potential conflict of interest.
Figures
References
LinkOut - more resources
Full Text Sources
Miscellaneous