. 2025 May 6:15:1530166.
doi: 10.3389/fcimb.2025.1530166. eCollection 2025.

Impaired K48-polyubiquitination downmodulates mouse norovirus propagation

Affiliations

Impaired K48-polyubiquitination downmodulates mouse norovirus propagation

Emmrich Wakeford et al. Front Cell Infect Microbiol. .

Abstract

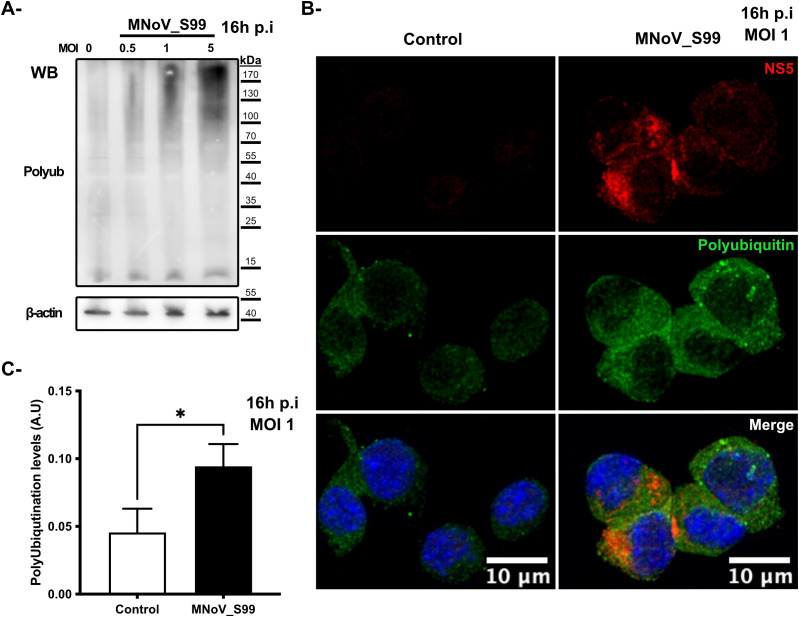
Introduction: Noroviruses are small non-enveloped, single stranded positive-sense RNA viruses that belong to the family Caliciviridae. They are highly contagious and resistant to multiple detergents and are the infectious agents in the majority of viral gastroenteritis in adults. Due to a lack of approved preventive or curative therapy options, intensive research effort is ongoing to better understand the pathogenesis mechanisms of noroviruses.

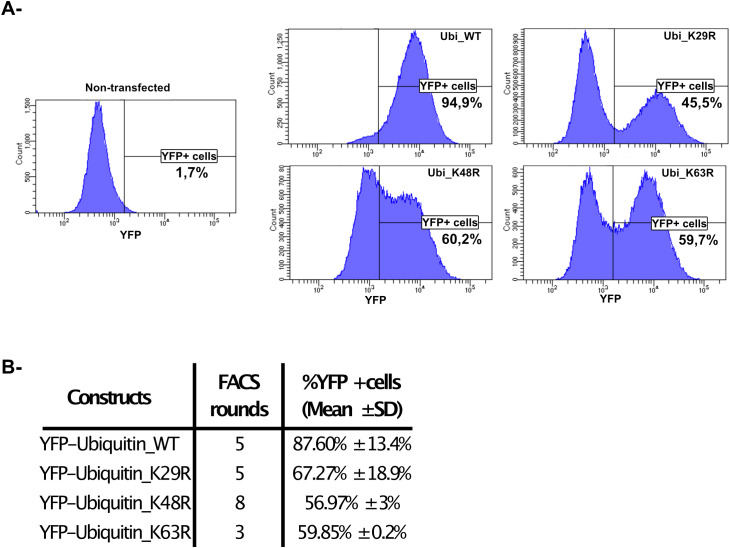
Methods: In this study, using the persistent murine norovirus S99 strain (MNoV_S99), we have investigated the role in the regulation of anti-noroviral responses of ubiquitination, a post-translational modification that covalently adds one or multiple ubiquitin molecules onto lysine residues of target proteins. To that end, we have first generated RAW264.7 cells overexpressing YFP-Ubiquitin_WT, _K29R, _K48R or_K63R constructs. All non-WT constructs encode a ubiquitin fusion protein with one lysine mutated into an arginine residue, thus preventing the formation of the K29-, K48- or K63-dependent polyubiquitin chains respectively.

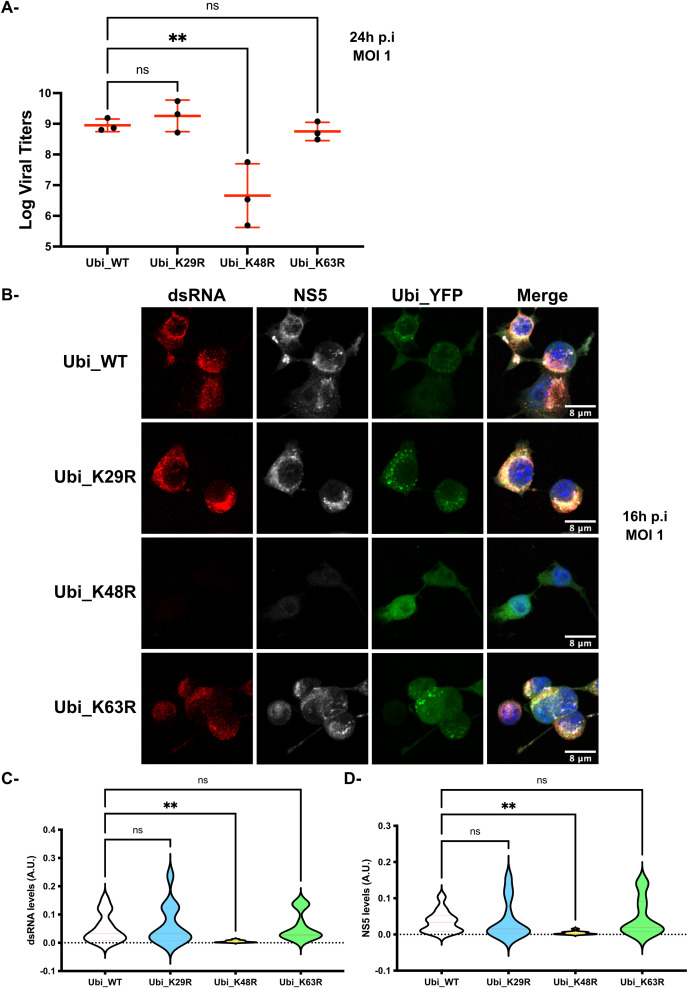
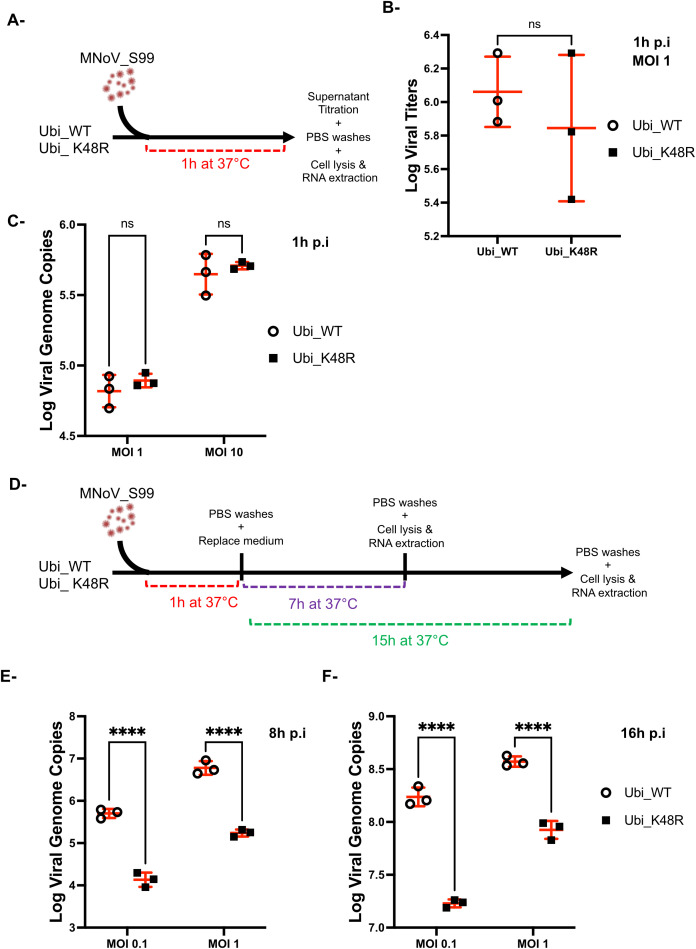
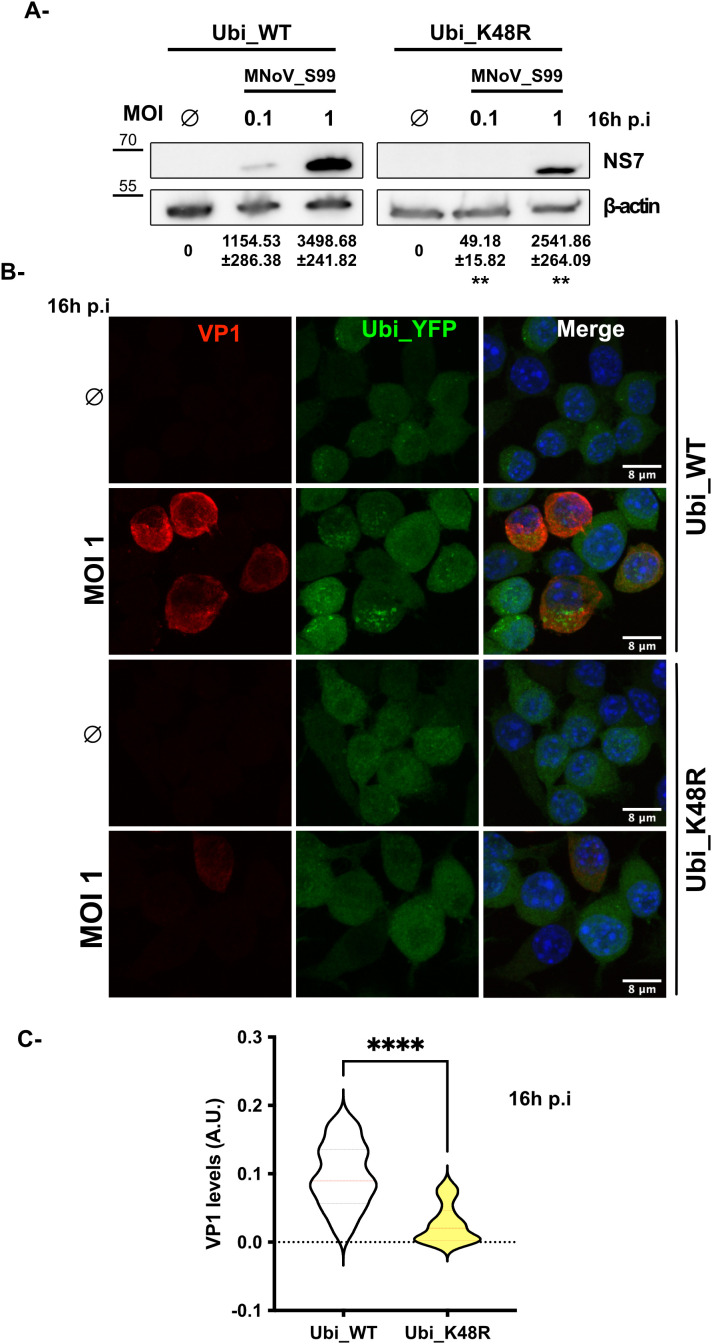
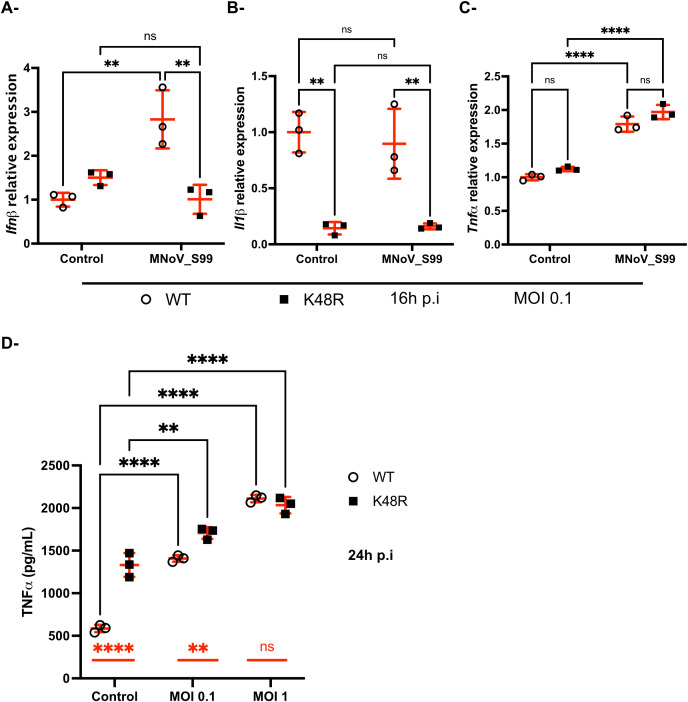
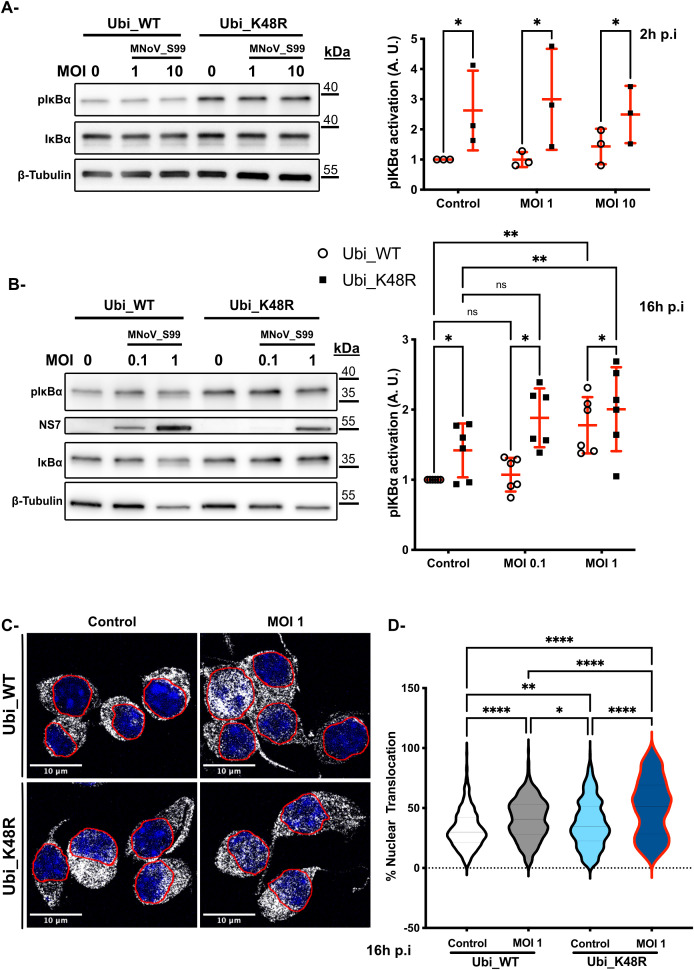
Results: Upon infection of these cells with MNoV_S99, we unexpectedly observed that only cells expressing the YFP-Ubiquitin_K48R protein showed a significantly impaired expression of several viral markers: NS5, NS7, VP1 and the replication intermediate dsRNA. Consequently, the number of viral genome copies or viral titers were also significantly decreased in the YFP-Ubiquitin_K48R cells compared to the YFP-Ubiquitin_WT cells. This negative regulation cannot be explained by perturbed viral entry, but rather a constitutive hypersecretion of the pro-inflammatory cytokine TNF and downstream upregulation of IκBα phosphorylation and the subsequent NF-κB nuclear translocation.

Conclusion: Overall, these consequences combined impose a non-permissive environment for MNoV_S99 replication and propagation.

Keywords: inflammation; innate immunity; macrophage; norovirus; signaling; ubiquitn.


Conflict of interest statement

The authors declare that the research was conducted in the absence of any commercial or financial relationships that could be construed as a potential conflict of interest. The author(s) declared that they were an editorial board member of Frontiers, at the time of submission. This had no impact on the peer review process and the final decision.

Figures

Figure 1
Figure 1
Ubiquitination response modification following MNoV_S99 infection. (A) RAW264.7 cells were infected with MNoV-S99 (MOI 0.5, 1, 5 or mock infected (0) for 16h). Lysates were subjected to a Western Blot detection using antibodies against polyubiquitin and ß-actin. (B) RAW264.7 cells were infected with MnoV_S99 (MOI 1, 16h), or mock treated (Control). Fixed and labelled cells were imaged using confocal spinning-disk microscope with a 40x objective. Viral protein NS5 is displayed in red (NS5) and the polyubiquitin chains in green (Polyubiquitin). The nuclei are counterstained with DAPI shown in blue in the merged images. (C) The area of the polyubiquitination signal was quantified using FIJI/ImageJ and was normalized according to total cell surface, 3 images per condition were used with at least 20 cells per images. Mean ± SD from n = 3 independent experiments are represented, statistical significance was determined with Mann-Whitney test, *p= 0.04.
Figure 2
Figure 2
Generation of RAW264.7-YFP-Ubiquitin_WT, _K29R, K48R or K63R cells. (A) A representative analysis of the selection and gating performed in the FACS used in the quantification and sorting of YFP positive cells. (B) The table shows the number of sorting over the time of selection for each cell line and the obtained % YFP+ cells populations analysed by flow cytometry (mean ± SD, n=3, at least 1x10⁵ events analysed/cell line/measure).
Figure 3
Figure 3
MNoV_S99 propagation is impaired in Ubi_K48R cells. (A) The different cell lines were infected with MNoV_S99 (MOI 1, 24h). Viral titers were determined from supernatants using the TCID50 titration method (mean ± SD, n=3). Statistical differences were determined with one-way ANOVA test, ** p= 0,0044. (B) RAW264.7-YFP-Ubiquitin_WT, K29R, K48R- and K63R transfected cells (termed Ubi_WT, Ubi_K29R, Ubi_K48R and Ubi_K63R respectively) were exposed to MNoV_S99 (MOI 1, 16h). Fixed cells were marked with anti-dsRNA antibodies (shown in red) and anti-NS5 antibodies (in grey), the nuclei were counterstained with DAPI (blue). Cells were imaged by spinning-disk confocal microscopy with a 40x objective. (C) Total cell areas of the viral dsRNA and (D) NS5 expression were quantified using FIJI/ImageJ and was normalized according to total cell surface. 4-5 images were used per condition with at least 20 cells per images. Mean ± SD from n = 3 independent experiments are represented, statistical significance was determined with ANOVA test, **p<0.005; ns indicates non-significant differences.
Figure 4
Figure 4
MNoV_S99 entrance is not compromised in Ubi_K48R cells. (A) Schematic representation of the experimental plan used to measure the viral entrance in Ubi_WT and Ubi_K48R cells infected with MNoV_S99 at MOI 1 for 1h, at 37°C. (B) Residual non-internalised viruses’ amounts were compared using TCID50 titration method (mean ± sd, n = 3). (C) Viral genome copies were quantified with RT-qPCR analysis from Ubi_WT or Ubi_K48 cells infected with MNoV_S99 MOI 1 or 10 for 1h, at 37°C. (D) Schematic representation of the experimental plan used to measure viral genome copies from Ubi_WT or Ubi K48 cells at MOI of 0.1 or 1 for a total of 8h or 16h of infection with MNoV_S99. The respective measures are shown in (E, F) as total number of MNoV genome copies (mean ± SD) from n = 3 independent experiments. Statistical significances were determined with 2-ways ANOVA test, ****p<0.0001; ns indicates non-significant differences.
Figure 5
Figure 5
MNoV_S99 lifecycle is impaired in Ubi_K48R cells. (A) Ubi_WT and Ubi_K48R cells were infected with MNoV_S99 (MOI 0.1, 1 or mock infected (0) for 16h). Total proteins lysates were subjected to WB. The viral marker NS7 band intensities were measured and normalized with ß-actin (mean ± sd, n = 3). The variations of NS7’s levels were compared at both MOIs between the two cell types using Student’s T.test (**p = 0.0013 and **p= 0.0049 respectively at MOI 0.1 and MOI 1). (B) MNoV_S99 infected (MOI 1, 16h) Ubi_WT or Ubi_K48R fixed cells were stained for the late viral marker VP1 (in red). The YFP_Ubiquitin signal is shown in green. The nuclei were counterstained with DAPI (blue). Cells were imaged by spinning-disk confocal microscopy with a 60x objective. (C) The area of the viral VP1 signal was quantified using FIJI/ImageJ and was normalized according to total cell surface (5 images/condition and at least 30 cells per image from n = 3 independent experiments were analyzed). Statistical significance was determined with Mann-Whitney test ****p<0.0001.
Figure 6
Figure 6
Differences in the regulation of anti-viral immunity against MNoV_S99 in Ubi_WT versus Ubi_K48R cells. Ubi_WT or _K48 cells mock infected (Control) or infected with MNoV_S99 (MOI 0.1, 16h) were analyzed by RT-qPCR for expression of Ifnb in (A), Il1b in (B) and Tnf in (C) relatively to housekeeping genes. Statistical significances were determined with 2-ways ANOVA test, **p=0.002 and ****p<0.0001. (D) Quantification by ELISA of secreted TNF in the supernatants from Ubi_WT or _K48R cells infected with MNoV_S99 (MOI 1, 24h) or mock infected (Control). Mean ± sd are shown from n = 3 independent experiments, statistical significances were determined with 2-ways ANOVA test, **p=0.002 and ****p<0.0001; ns indicates non-significant differences. The differences between non-infected and infected cells are shown with bars in black for both cell lines. The differences between Ubi_WT and Ubi_K48R cells are shown with red bars.
Figure 7
Figure 7
Upregulation of NF-κB activation in Ubi_K48R cells. (A) Total proteins lysates from Ubi_WT and Ubi_K48R cells infected for 2h with MNoV_S99 (MOI 1, 10 or mock infected (0)) or were subjected to a Western Blot analysis (left panel). Quantification (mean ± sem, n = 3) of protein expression levels were compared after normalization with ß -Tubulin expression and relative to pIκBα levels in the control Ubi_WT mock infected condition (right panel). Statistical differences were analyzed using 2-ways ANOVA test *p=0.03. (B) Comparisons of the indicated proteins levels by WB (left panel) in cells lysates from 16h infected cells (MOI 0.1 or 1) and quantifications (mean ± sem, n = 6) of pIκBα levels normalized with ß -Tubulin expression and relative to pIκBα levels in the control Ubi_WT mock infected condition are presented in the right panel. Statistical differences were analysed using 2-ways ANOVA test *p=0.01, **p=0.002, ****p<0.0001; ns indicates non-significant differences. (C) MNoV_S99 infected (MOI 1, 16h) Ubi_WT or _K48R fixed cells were stained with anti-Nf-κB antibodies (in gray). The nuclei were counterstained with DAPI (blue). Cells were imaged by spinning-disk confocal microscopy with a 60x objective. (D) Quantification of the percentages of Nf-κB nuclear translocation were measured with Imaris (5 images/condition and at least 20 cells per image from n=3 independent experiments were analyzed). Statistical significance was determined with one-way ANOVA test *p=0.04, **p=0.005, ****p<0.0001.

Similar articles

References

    1. Bartsch S. M., Lopman B. A., Ozawa S., Hall A. J., Lee B. Y. (2016). Global economic burden of norovirus gastroenteritis. PLoS One 11, e0151219. doi: 10.1371/journal.pone.0151219 - DOI - PMC - PubMed
    1. Bharaj P., Atkins C., Luthra P., Giraldo M. I., Dawes B. E., Miorin L., et al. . (2017). The host E3-ubiquitin ligase TRIM6 ubiquitinates the ebola virus VP35 protein and promotes virus replication. J. Virology. 91, e00833–e00817. doi: 10.1128/JVI.00833-17 - DOI - PMC - PubMed
    1. Byk L. A., Iglesias N. G., De Maio F. A., Gebhard L. G., Rossi M., Gamarnik A. V. (2016). Dengue virus genome uncoating requires ubiquitination. mBio. 7, e00804–e00816. doi: 10.1128/mBio.00804-16 - DOI - PMC - PubMed
    1. Davis M. E., Gack M. U. (2015). Ubiquitination in the antiviral immune response. Virology 479–480, 52–65. doi: 10.1016/j.virol.2015.02.033 - DOI - PMC - PubMed
    1. Dejarnac O., Hafirassou M. L., Chazal M., Versapuech M., Gaillard J., Perera-Lecoin M., et al. . (2018). TIM-1 ubiquitination mediates dengue virus entry. Cell Rep. 23, 1779–1793. doi: 10.1016/j.celrep.2018.04.013 - DOI - PubMed