. 2024 Jan 5;3(1):2296209.
doi: 10.1080/27694127.2023.2296209. eCollection 2024.

Gentiacaulein inhibits glucose transport to induce PRKAA1-mediated autophagy to clear amyloid beta and associated inflammation in primary astrocytes

Affiliations

Gentiacaulein inhibits glucose transport to induce PRKAA1-mediated autophagy to clear amyloid beta and associated inflammation in primary astrocytes

Ankita Sharma et al. Autophagy Rep. .

Abstract

Being present in substantial numbers, astrocytes play an indispensable role in maintaining homeostasis in the brain. However, their positive or negative involvement in pathological conditions in the brain has not been explored much. In recent years, an emerging thought of targeting astrocytes for the resolution of neurodegenerative diseases has gained momentum. In this study, we have attempted to explore the likelihood of targeting astrocytes by using a natural compound, gentiacaulein (GENT), for clearance of amyloid-β (Aβ) through autophagy and amelioration of neuroinflammation associated with Aβ. We found that GENT treatment of astrocytes hampered the transport of glucose across the cell membrane, which resulted in a reduction in ATP production. With increased treatment time, AMP: ATP ratio was increased significantly, which caused the induction of PRKAA1-mediated autophagy. We further show that increased autophagy considerably enhanced the clearance of amyloid-β by astrocytes. GENT reduced the Aβ mediated inflammation by inhibiting the nuclear translocation of NF-κB and decreased the release of inflammatory cytokines TNF-α and IL-6. The role of PRKAA1 in GENT-induced autophagy and anti-inflammatory activity was confirmed when its knockdown reversed these effects. Our data suggest that targeting astrocytes can be a good strategy to prevent/treat Alzheimer's disease.

Keywords: Alzheimer disease; Amyloid-β; Astrocytes; Autophagy; Gentiacaulein; Neuroinflammation; PRKAA1/AMPK.


Conflict of interest statement

Authors declare no conflict of interest.

Figures
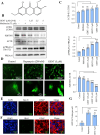
Figure 1.
Figure 1.
GENT induced autophagy in primary astrocytes. (A) Chemical structure of Gentiacaulein. (B) Western blot examination for LC3B-II, SQSTM1, and p-PRKAA1 (Thr 172) after concentration-dependent treatment of astrocytes with GENT for 24 h. (C) Densitometry of the western blots for LC3B-II, SQSTM1, and p-PRKAA1 (Thr 172). The normalization of LC3B-II was done with LC3B-I and SQSTM1 was done using ACTB while that of p-PRKAA1 (Thr 172) was done with PRKAA1. (D) Confocal microscopy analysis for GFP-LC3 puncta formation after treating primary astrocytes with rapamycin (200 nM) as a standard and GENT (5 µM) for 24 h. The puncta were counted manually after taking the images at 40x. (E, F) Confocal microscope images of GFAP, NEUN, and IBA1 as markers for astrocytes and neurons respectively to check the purity of astrocytes at 40x.(G) Graphical representation of the average number of puncta per cell from three similar experiments. ImageJ software was used to insert the scale bar in confocal images and for densitometric analysis of western blots while one-way ANOVA and post-hoc Bonferroni test appertained to test the statistical significance. The p-value < 0.05 was considered to be significant with values defined as *p< 0.05, **p<0.01, ***p<0.001.
Figure 2.
Figure 2.
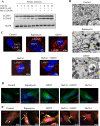
Analysis of autophagy flux in astrocytes after treatment with GENT in the presence or absence of bafilomycin A1. (A) Examination of autophagy flux through Western blotting of LC3B-II with or without bafilomycin A1. (B) TEM images to show the autophagosomes in primary astrocytes treated with Rapamycin and GENT (5 µM). Different color arrows indicate yellow (autolysosomes), purple (autophagosome), orange (autophagophore), and black (lysosome). Scale bars were drawn using ImageJ software. (C) Confocal images to check the expression of LAMP1 in primary astrocytes after treatment with GENT (5 µM) in the presence and absence of bafilomycin A1. The presented images are from one of the three similar experiments. The scale bar was inserted using ImageJ software. (D) Confocal images of primary astrocyte stained with Cathepsin D antibody (Green) to show lysosome acidification after treatment with GENT which was comparable to standard rapamycin. Scale bar 15 μm. (E) Colocalization of LC3B-II and LAMP1 after treatment with GENT. Immunofluorescence of primary astrocytes stained for LAMP1 (Red) and LC3B-II (Green). The green puncta represent LC3 positive structures and the red dots represent the LAMP1 positive structures. Merged images indicate colocalization of LAMP 1 and LC3B-II (yellow dots indicated with white arrows) giving more details of their overlap. Scale bar 14 μm. The fluorescent images were quantified by using CellPathfinder software. One-way ANOVA was applied for statistical comparisons with the post-hoc Bonferroni test. The p-value <0.05 was considered significant with values defined as *p< 0.05, **p<0.01, ***p<0.001
Figure 3.
Figure 3.
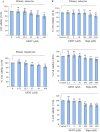
MTT assay to check the effect of GENT on cell viability. (A) GENT did not show any significant toxicity for 24 h even at 25 μM concentration in two different cell types including primary astrocytes and primary hepatocytes. (B) Comparison of the effect of GENT and rapamycin on cell viability of astrocytes. GENT did not show any cytotoxicity at the working concentrations through 72 h of treatment of astrocytes. Statistical comparisons were made by using one-way ANOVA followed by the Bonferroni test. The value of control was calculated as 100 percent in each experiment and each data point represents one independent experiment and the p-value <0.05 was considered significant with values shown as *p< 0.05, **p<0.01, ***p<0.001.
Figure 4.
Figure 4.
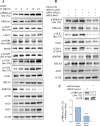
GENT-induced autophagy in astrocytes is mediated by the PRKAA1 pathway. (A) GENT at a concentration of 5 μM, time-dependently increased the expression level of p-PRKAA1 (Thr 172) while it had no effect on p-MTOR (Ser 2448) level as shown by the representative images of Western blotting. Which was also evident by no effect on 4E-BP1. It also enhanced the levels of proteins involved in autophagy machinery viz p-ULK 1 (Ser 317), p-ULK 1 (Ser 555), BECN1, SQSTM1, ATG5, and, ATG7 in a time-dependent manner at the same concentration. In order to normalize the protein level, β-Actin was used and the quantification was done using ImageJ software. (B) Western blots representing the effect of knockdown of PRKAA1 with siPrkaa1in GENT-treated astrocytes on the expression levels of pPRKAA1 (Thr 172), PRKAA1, pULK-1 (Ser 317), ULK1, LCB-II, SQSTM1, BECN and ATG 5. (C) Transfection of primary astrocytes with siPrkaa1 significantly reduced PRKAA1 expression when compared to the control cells transfected with mock siRNA. Data shown here are the mean ±SD of three independent experiments and the Bonferroni test was employed to calculate the statistical significance. The value of siRNA control was taken as 1 arbitrary unit (AU) in each experiment and each data point on the graph corresponds to one independent experiment. The p-value <0.05 was considered significant with values defined as *p< 0.05, **p<0.01, ***p<0.001.
Figure 5.
Figure 5.
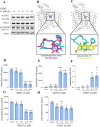
GENT inhibits GLUT 1 to reduce glucose transport and energy levels of astrocytes. (A) Western blots representing the effect of GENT on the expression levels of pSTK11 and pCAMKK2. (B) Superimposition of the crystallographic (cyan) and docking (magenta) poses of Cytochalasin B to human GLUT1 (white ribbon). (C) Superimposition of the crystallographic pose of Cytochalasin B (cyan) and the docked pose of GENT (yellow). LC-MS was used to assess the different parameters governing the energy status of the cell. (D) LCMS-based measurement of intracellular levels of various energy-related parameters in astrocytes including ATP (E) Intracellular AMP (F) Ratio of AMP: ATP (G) Intracellular glucose (H) Pyruvate following treatment with GENT (5 µM) in a time-dependent manner. Statistical significance for analysis of metabolites was calculated by using two-way ANOVA and post-hoc Dunnett’s test was applied. The p-value < 0.05 was appraised to be significant.
Figure 6.
Figure 6.
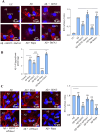
GENT leads to amyloid-β clearance in primary astrocytes. (A) Confocal images of primary astrocytes that were treated with fluorescently tagged Aβ Hilyte Fluor 555 displayed relatively lower fluorescence intensity (red color) in the cells treated with GENT (5 µM) in comparison to the cells treated with Aβ alone. Rapamycin (200 nM) treatment, which was used as a positive control, the red intensity was decreased indicating the clearance of Aβ protein. Bafilomycin A1 significantly enhanced red fluorescence indicating decreased Aβ was clearance. Quantification of relative fluorescence intensity (RFI) was done using FV-10-ASW (Version 1.7) software while scale bar was inserted using ImageJ software. For calculating RFI at least five cells from each sample were taken and then the overall average was calculated from at least three independent experiments, the data are presented here in the form of a bar graph. RFI of Aβ treated sample was normalized to 1 AU. (B) ELISA of the similarly treated samples as in Figure A was done to measure extracellular Aβ present in the supernatant of cultured primary astrocytes. (C) Confocal microscope analysis of primary astrocytes transfected with siPrkaa1 and treated with tagged Aβ Hilyte Fluor 555 with or without GENT. Knockdown of Prkaa1 led to the reversal of effect of GENT on Aβ clearance when compared to the non-transfected cells. These images were obtained using Olympus Fluoview, FV-1000 confocal laser scanning microscope at 60x and ImageJ software was used to insert the scale bar in the images. At least five cells in the sample were taken to evaluate the relative fluorescence intensity as average RFI while final average RFI was calculated after performing three independent experiments. Data presented here are mean ±SD of three independent experiments and statistical significance was calculated by using one way ANOVA and Bonferroni test was used to compare multiple samples. The p-values are represented as *p< 0.05, **p<0.01, ***p<0.001, ns = not significant.
Figure 7.
Figure 7.
GENT reduced the release of Aβ prompted pro-inflammatory cytokines TNF-α and IL-6 by inhibiting nuclear translocation of NF-κB in primary astrocytes. (A) ELISA for analyzing the release of TNF-α and (B) IL-6 in primary astrocytes. Primary astrocytes were initially given treatment with Aβ for 12 h followed by treatment with GENT (5 µM), which was followed by measurement of TNF-α and IL-6 in supernatant through ELISA. (C) Western blot analysis for the effect of GENT on p-NF-ĸB, p65 (Ser 536), NF-ĸB, p65, p-IKKβ (Ser 177), and IKKβ in the whole cell lysates. (D) GENT inhibited the Aβ induced nuclear translocation of p-NF-ĸB, p65, and p-NF-ĸB, p50 as analyzed by Western blotting of cytosolic and nuclear fractions. ACTB was used as a marker for cytosolic fraction while LMNA was used as a nuclear fraction marker. The blots presented here are representative of one of three independent experiments. (E) Immunofluorescence examination for effect of GENT on translocation of p-NF-ĸB, p65 (Ser 536) to the nucleus. GENT treatment significantly intensified the red fluorescence in the cytoplasm of astrocytes when compared to the cytoplasm of cells treated with Aβ alone. Dexamethasone in this experiment was used as a standard. In this figure, ImageJ was used to insert the scale bar, and statistical comparisons were made using one-way ANOVA followed by the Bonferroni test where a p-value of < 0.05 was considered significant with ***p<0.001, **p<0.01.*p< 0.05 as significance order.
Figure 8.
Figure 8.
PRKAA1 knockdown reversed the anti-inflammatory effect of GENT in Aβ activated astrocytes (A) Primary astrocytes were transfected with siPrkaa1 and the expression of p-PRKAA1 (Thr 172) was analyzed through western blotting, which showed significantly reduced levels as compared to cells transfected with mock siRNA. (B, C) ELISA of TNF-α and IL-6 from the supernatants of primary astrocytes treated with GENT (5 µM) in the presence and absence of siPrkaa1. The knockdown of PRKAA1 significantly reduced the inhibitory effect of GENT on the release of TNF-α and IL-6. (D) Western blot analysis in whole cell lysate for the effect of GENT on the expression of different proteins p-PRKAA1 (Thr 172) and p-NF-ĸB, p65 (Ser 536) in the presence and absence of siPrkaa1. Knockdown of PRKAA1 strongly compromised the inhibitory effect of GENT on p-NF-ĸB, p65 (Ser 536) expression. (E) Western blotting of p-NF-κB, p65 (Ser 536) in the cytosolic and the nuclear fraction of the primary astrocytes treated with GENT and siPrkaa1. As a cytosolic marker, ACTB was used and for the nuclear marker, LMNA was used. The blots depicted the enhanced shifting of p-NF-κB, p65 (Ser 536) from the cytoplasm to the nucleus in the astrocytes treated with GENT in the presence of siPrkaa1.Western blots presented here are representative of one of three experiments. For calculating statistical significance, one-way ANOVA was used and post-hoc Bonferroni test was applied. The p-values *p < 0.05, **p <0.01, ***p<0.001 are considered to be significant.

Similar articles

Cited by

References

    1. Von Bartheld CS, Bahney J, Herculano-Houzel S.. The search for true numbers of neurons and glial cells in the human brain: A review of 150 years of cell counting. The Journal of comparative neurology 2016; 524:3865–31. - PMC - PubMed
    1. Herculano-Houzel S. The glia/neuron ratio: how it varies uniformly across brain structures and species and what that means for brain physiology and evolution. Glia 2014; 62:1377–91. - PubMed
    1. Verkhratsky A, Nedergaard M.. Physiology of Astroglia. Physiological reviews 2018; 98:239–389. - PMC - PubMed
    1. Khakh BS, Sofroniew MV.. Diversity of astrocyte functions and phenotypes in neural circuits. Nature neuroscience 2015; 18:942–52. - PMC - PubMed
    1. Marina N, Christie IN, Korsak A, Doronin M, Brazhe A, Hosford PS, et al. Astrocytes monitor cerebral perfusion and control systemic circulation to maintain brain blood flow. Nature communications 2020; 11:131. - PMC - PubMed

LinkOut - more resources