. 2025 May 6:16:1540400.
doi: 10.3389/fphys.2025.1540400. eCollection 2025.

Acute ischaemia and gap junction modulation modify propagation patterns across Purkinje-myocardial junctions

Affiliations

Acute ischaemia and gap junction modulation modify propagation patterns across Purkinje-myocardial junctions

Richard J Jabbour et al. Front Physiol. .

Abstract

Background: The Purkinje network is essential for normal electrical impulse propagation in the heart but has also been implicated in ventricular arrhythmias. Previous experimental work has suggested that not all Purkinje-myocardial junctions (PMJs) are active at rest due to source-sink mismatch at the PMJs.

Objective: We hypothesized that pathological conditions that cause gap junction uncoupling (e.g., acute ischaemia), would increase the number of active PMJs, leading to more complex activation patterns.

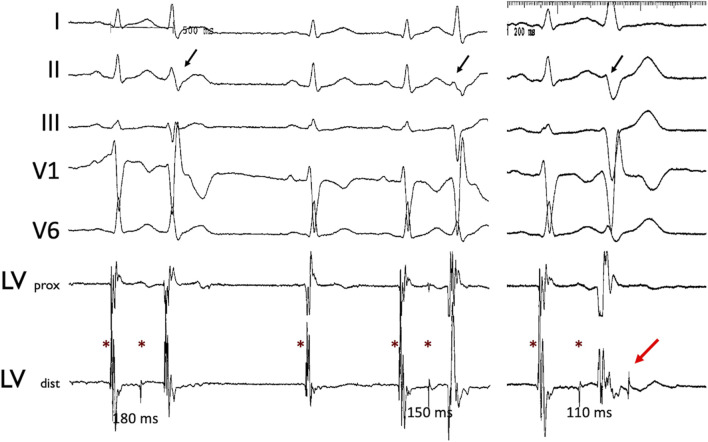
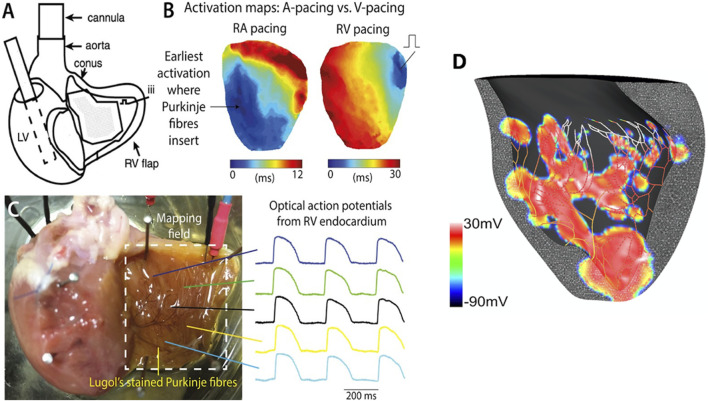
Methods: We investigated this using a whole-heart intact Purkinje system preparation that allowed direct high-resolution endocardial mapping to interrogate PMJ function. Twelve (7 control, five rotigaptide) Langendorff-perfused hearts from New Zealand white rabbits were subjected to an ischaemia-reperfusion protocol and optically mapped. Computational modelling was performed to determine the effects of gap junction coupling on PMJ function, and on the complexity of endocardial activation.

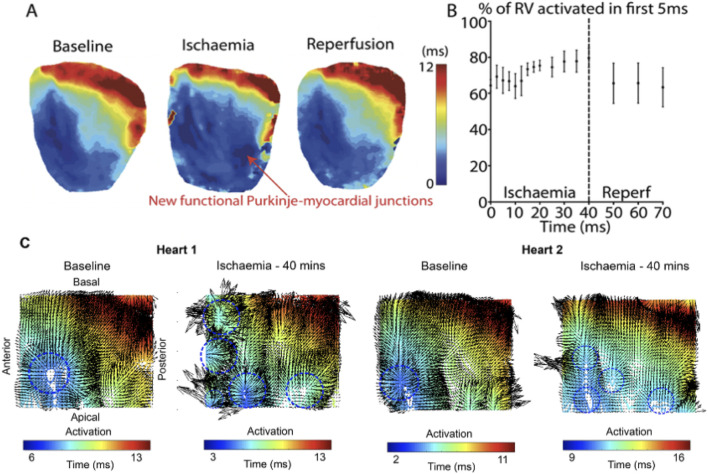
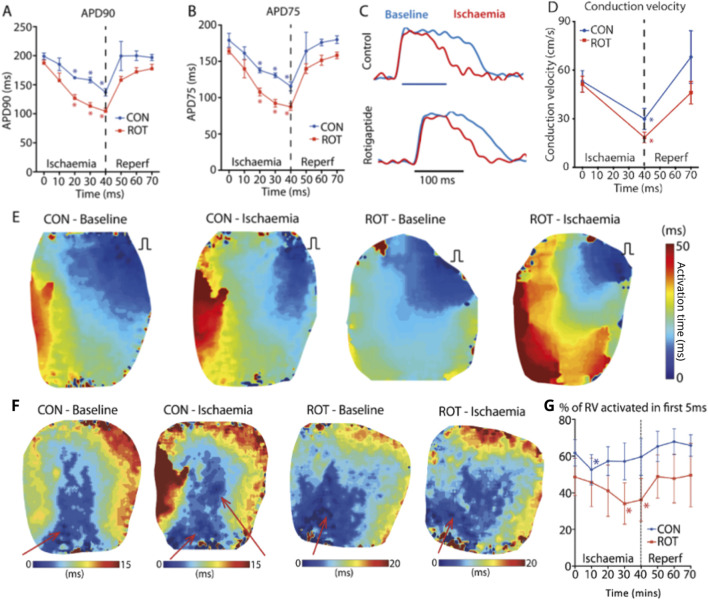
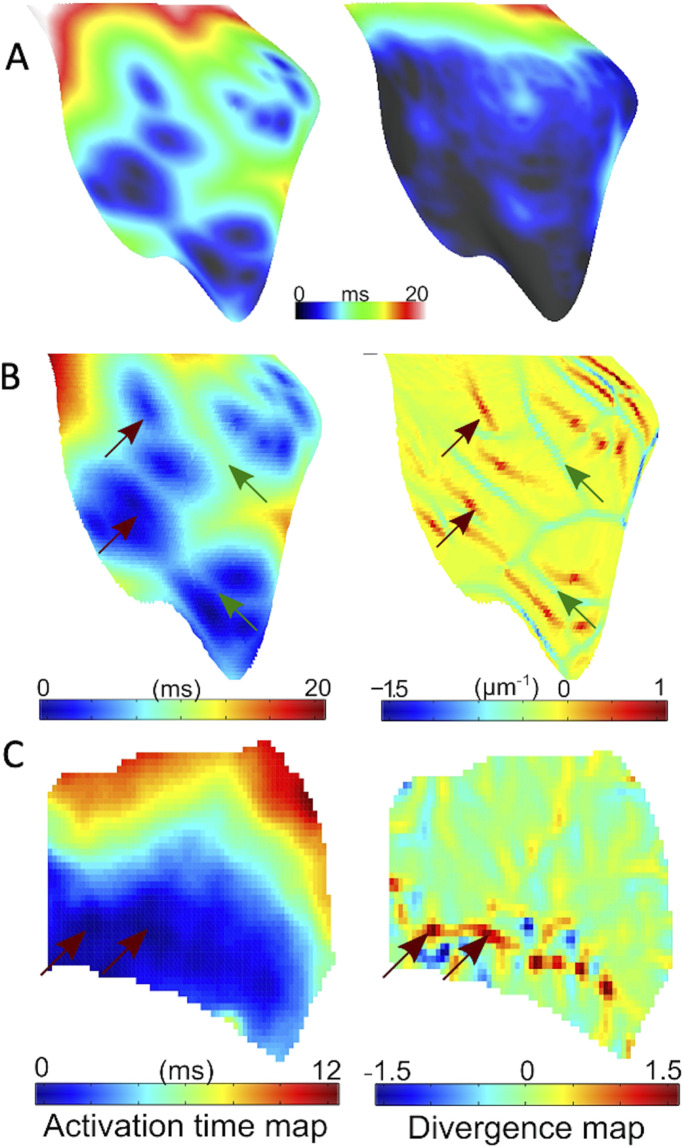
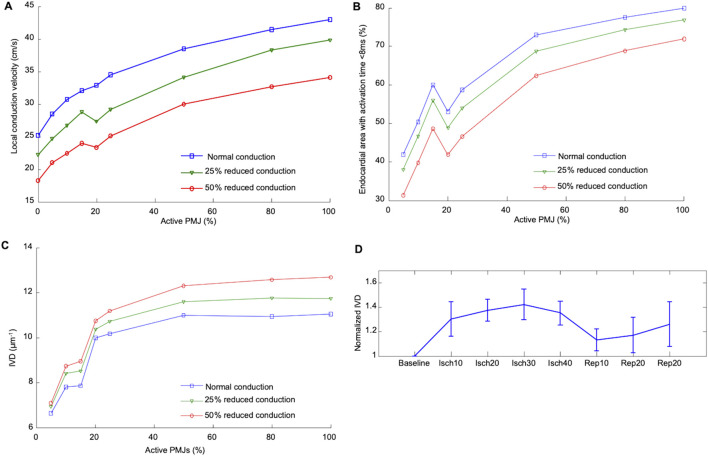
Results: During ischaemia, the percentage of right ventricle area activated within the first 5 ms decreased from baseline 62% ± 7% to 52% ± 8% during early ischaemia (p = 0.04), consistent with slowing of conduction. This was followed by a paradoxical increase in late-ischaemia (60% ± 8%) due to extra regions of early activation. Gap junction enhancement with rotigaptide during ischaemia abolished the aforementioned pattern. Parallel computational experiments replicated experimental findings only when the number of functional PMJs was increased during ischaemia. With more active PMJs, there were more breakthrough sites with increased complexity of activation, as also measured in biological preparations.

Conclusion: Normally-quiescent PMJs can become active in the context of gap junction uncoupling during acute ischaemia. Pharmacological gap junction modulation may alter propagation patterns across PMJs and may be used as a therapeutic strategy for Purkinje system associated arrhythmias.

Keywords: Purkinje-myocardial junction; cardiac electrophysiology; computer modelling; ischaemia; purkinje system.


Conflict of interest statement

Author EV was employed by IMB, UMR5251. The remaining authors declare that the research was conducted in the absence of any commercial or financial relationships that could be construed as a potential conflict of interest. The author(s) declared that they were an editorial board member of Frontiers, at the time of submission. This had no impact on the peer review process and the final decision.

Figures

FIGURE 1
FIGURE 1
Concealed Purkinje discharge. Examples of ectopic beats arising from the LV Purkinje system, recorded during an invasive electrophysiological procedure in a patient. Left ventricle Purkinje beats with varying conduction times. Stars indicate the Purkinje potential. Note the varying Purkinje to ventricular muscle conduction times associated with the different QRS morphologies (black arrow) as well as non-conducted Purkinje beat (red arrow). Abbreviations: LV: left ventricle; prox: proximal; dist: distal.
FIGURE 2
FIGURE 2
Experimental setup for the global ischaemia-reperfusion optical mapping. (A) Schematic diagram of aortic-perfused RV endocardial mapping preparation (modified from Cates et al., AJP Heart 2001). (B) Representative RV endocardial activation maps for RA and RV pacing. (C) Representative optical APs recorded at multiple sites on RV flap. potential map shows areas of early activation (surrogate of active PMJs) in red (+30 mV). (D) Computational model of RV endocardium and Purkinje fibers after His stimulation. This transmembrane voltage map shows areas of early activation (surrogate of active PMJs) in red (+30 mV).
FIGURE 3
FIGURE 3
Representative activation maps during ischaemia and reperfusion (A) Activation maps following RA pacing during baseline, ischaemia and reperfusion. (B) Percentage of RV activated in first 5 ms during ischaemia and reperfusion. Data are presented from four control hearts where there were more frequent recordings during early ischaemia (every 2.5 min during the first 20 min), to provide more detail on the time course of these changes. (C) Representative activation maps with local conduction vectors at baseline and after 40 mins ischaemia. At baseline, the earliest activation is at the anterior-apical region of the RV, but multiple areas of early activation can be seen at peak ischaemia. Blue circles indicate breakthorough sites.
FIGURE 4
FIGURE 4
Effect of Gap Junction Enhancer Rotigaptide. Compared to control, rotigaptide shortened (A) APD90 and (B) APD75 over the course of the ischaemia. (C) Representative action potentials at baseline (blue) and 40 min ischaemia (red) for control and rotigaptide treated heart. (D) Conduction velocity for control and rotigaptide treated hearts. (E) RV pacing activation maps at baseline and 40 min of ischaemia for control and rotigaptide treated hearts. (F) RA pacing activation maps at baseline and 40 min of ischaemia for control and rotigaptide treated hearts. There are new areas of early activation (functional PMJs indictaed by red arrow) in a control heart during RA pacing, which was not seen in the rotigaptide treated heart. (G) Effect of ischaemia and reperfusion on control and rotigaptide treated hearts on percentage of right ventricle activated within the first 5 ms. Likely because of more functional PMJs during ischaemia, the percentage of RV area activated early (within 5 ms) was maintained around 60% in control group, but not in the rotigaptide group. CON–control; ROT–rotigaptide. Data are for control (n = 7) and rotigaptide (n = 5) groups in their entirety. Asteriskes indicate statistical significance.
FIGURE 5
FIGURE 5
Endocardial activation and divergence maps (A) Simulated RV endocardial area isochoronal activation maps during His bundle pacing for 5% (left panel) and 80% (right panel) active junctions. (B) Representative simulated activation (left panel) with 10% active junctions, and corresponding endocardial divergence map (right panel). Sites of breakthrough are indicated in red arrows on the activation map. Corresponding points on divergence map have large positive divergence, while green arrows represent wave collisions with matching points indicating a large negative divergence. (C) Representative experimental activation (left panel) and corresponding endocardial divergence map (right panel). Arrows point to breakthrough sites on activation maps that match the location of large positive divergence on the divergence map.
FIGURE 6
FIGURE 6
Effect of percentage active PMJs on activation time and conduction velocities (A) Alteration in median local CV in ischaemic computer model by conductivity and number of active PMJs following RV pacing. (B) Variations in the activated area with changes of percentage of active PMJs and myocardial conductance in computer model of sinus activation. The endocardial area that activated within the first 8 ms mainly was increased by increasing PMJ density and reduced by decreasing myocardial conductivity. (C) Calculated IVD relative to number of active PMJs and myocardial conductance in computer model during sinus activation. (D) Experimental effect of ischaemia and reperfusion on calculated IVD during atrial pacing.

Similar articles

References

    1. Argentieri T., Frame L., Colatsky T. (1990). Electrical properties of canine subendocardial Purkinje fibers surviving in 1-day-old experimental myocardial infarction. Circulation Res. 66, 123–134. 10.1161/01.res.66.1.123 - DOI - PubMed
    1. Aslanidi O., Sleiman R., Boyett M., Hancox J., Zhang H. (2010). Ionic mechanisms for electrical heterogeneity between rabbit Purkinje fiber and ventricular cells. Biophysical J. 98, 2420–2431. 10.1016/j.bpj.2010.02.033 - DOI - PMC - PubMed
    1. Azarov J., Shmakov D., Vityazev V., Roshchevskaya I., Roshchevsky M. (2007). Activation and repolarization patterns in the ventricular epicardium under sinus rhythm in frog and rabbit hearts. Mol. and Integr. physiology 146, 310–316. 10.1016/j.cbpa.2006.10.036 - DOI - PubMed
    1. Barber F., Langfield P., Lozano M., Garcia-Fernandez I., Duchateau J., Hocini M., et al. (2021). Estimation of personalized minimal Purkinje systems from human electro-anatomical maps. IEEE Trans. Med. imaging 40, 2182–2194. 10.1109/TMI.2021.3073499 - DOI - PubMed
    1. Behradfar E., Nygren A., Vigmond E. (2014). The role of Purkinje-myocardial coupling during ventricular arrhythmia: a modeling study. PloS one 9, e88000. 10.1371/journal.pone.0088000 - DOI - PMC - PubMed

LinkOut - more resources