. 2025 Apr 16;28(5):112443.
doi: 10.1016/j.isci.2025.112443. eCollection 2025 May 16.

Control of odor sensation by light and cryptochrome in the Drosophila antenna

Affiliations

Control of odor sensation by light and cryptochrome in the Drosophila antenna

Dhananjay Thakur et al. iScience. .

Abstract

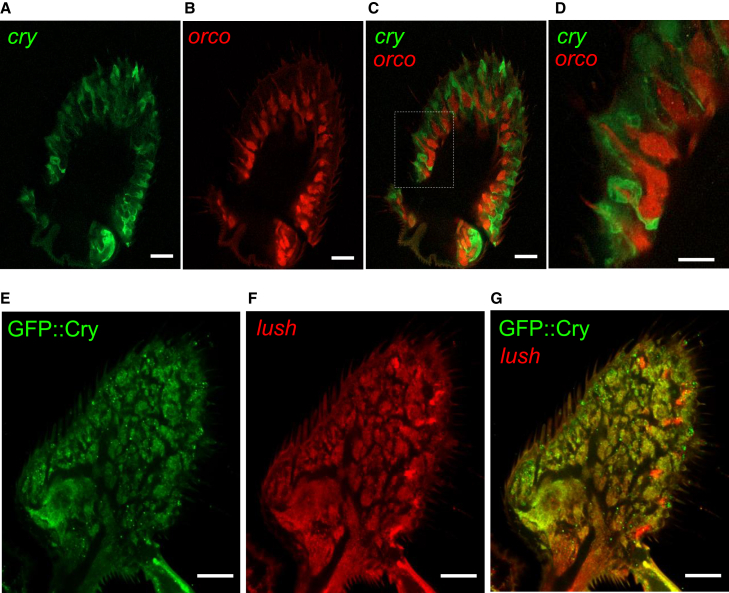
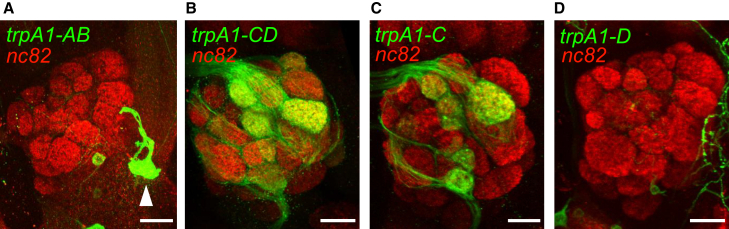
Olfaction is employed by the fruit fly, Drosophila melanogaster, to differentiate safe from harmful foods and for other behaviors. Here, we show that ultraviolet (UV) or blue light reduces the fly's behavioral aversion and the responses of olfactory receptor neurons (ORNs) to certain repellent odors, such as benzaldehyde. We demonstrate that cryptochrome (cry) is expressed in antennal support cells and is required for the light-dependent reduction in aversion. Light activation of Cry creates reactive oxygen species (ROS), and ROS activate the TRPA1 channel. We found that TRPA1 is required in ORNs for benzaldehyde repulsion and is activated in vitro by benzaldehyde. We propose that light-activation of Cry and creation of ROS persistently stimulates and then desensitizes TRPA1, preventing activation by benzaldehyde. Since flies begin feeding at dawn, we suggest that the light-induced reduction in odor avoidance serves to lower the barrier to feeding following the transition from night to day.

Keywords: Entomology; Neuroscience; Sensory neuroscience.


Conflict of interest statement

The authors declare no competing interests.

Figures

None
Graphical abstract
Figure 1
Figure 1
DART2 assay for monitoring olfactory behavior (A) A two-way choice DART2 assay set up using glass tubes with meshed chambers carrying odorants or solvents. Flies were imaged using reflected near-infrared (N-IR) light. (B) Calibration of the number of flies used per tube. Summary of variance and effect size plotted against number of flies per tube, which were exposed to 1% BA. Each population test was repeated 5–6 times. (C–I) Testing the impact of using different numbers of flies in the DART2 assay on the variability of the CoM. (C) 1 fly per tube. (D) 2 flies per tube. (E) 4 flies per tube. (F) 8 flies per tube. (G) 16 flies per tube. (H) 32 flies per tube. (I) 64 flies per tube. See also Figure S1.
Figure 2
Figure 2
Impact of light on olfactory aversion (A) Average CoM of control flies in response to 1% BA under dark conditions (0–0.01 μW/cm2) or under ‘white light,’ which was supplied by simultaneously applying red, green, blue and UV LEDs (with light intensity at ∼100 μW/cm2 for each wavelength). n = 14. Mann-Whitney U test. (B) Average CoM of control flies in response to 1% BA with red, green, blue or UV illumination, with the light intensity at ∼100 μW/cm2 for each wavelength. n = 12. ANOVA followed by Dunn’s multiple comparisons test. (C) Average CoM of control flies in response to 1% BA as a function of UV intensity. n = 13. ANOVA followed by Dunn’s multiple comparisons test. (D) Average CoM of control flies in response to 1% BA as a function of intensity of blue light (450 nm). n = 12. ANOVA followed by Dunn’s multiple comparisons test. (E) Average CoM of control flies in response to varying concentrations of BA under UV illumination at 100 μW/cm2. n = 12. Mann-Whitney U test. (F) Average CoM of control flies in response to 1% propionic acid (PA), 1% R-limonene (R-lim), 0.1% allyl isothiocyanate (AITC), 3% citronellal (Citr), 0.01% isovaleric acid (IVA) and 3% lemongrass (LG) under UV illumination at 100 μW/cm2. n = 12. Mann-Whitney U test. Error bars indicate means ± SEMs. ∗∗p < 0.01, ∗∗∗p < 0.001.
Figure 3
Figure 3
Direct effect of light on antennal odor responses (A) EAG responses in control flies exposed to 1% BA in the dark (left) or under blue light (450 nm) for 5 min (right). (B) Peak EAG responses of control flies. n = 8. Paired Wilcoxon test. (C) Average position of CoM of control, norpAP24, rh1 (ninaE), rh3, rh4 and rh7 null mutants from 20 to 60 min during the assay under UV illumination at 100 μW/cm2. n = 11–13. Mann-Whitney U test. (D) Average CoM of control, cry01 and cry01/Df in response to 1% BA from 20 to 60 min during the assay under UV illumination (365 nm, 100 μW/cm2) or blue illumination (450 nm, 250 μW/cm2). n = 8–13. ANOVA followed by Dunn’s multiple comparisons test. (E) EAG responses in control and cry01 flies exposed to 1% BA in the dark (left) or under blue light (450 nm) for 5 min (right). (F) Summary of peak EAG responses of cry01 flies. n = 8. Paired Wilcoxon test. ns = not significant. Error bars indicate means ± SEMs. ∗∗p < 0.01. ∗∗∗p < 0.001. See also Figure S2.
Figure 4
Figure 4
Testing for co-localization of the cry reporter in antenna with ORN and support cell markers (A) Antennal cross-section showing UAS-mCD8::GFP expression driven by the cry-GAL4 and stained with an anti-GFP antibody. (B) Same sample as (A) showing expression of RFP driven directly by the orco promoter (orco-RFP) and stained with anti-RFP. (C) Merge of (A) and (B). In (A), (B), and (C) the length of each scale bar is 20 μm. (D) Magnified section, marked in (C) indicated by white dotted rectangle. The length of the scale bar is 10 μm. (E) Antennal cross-section showing expression of GFP-tagged Cry (GFP::Cry) stained with anti-GFP. (F) Same sample as (E) showing expression of UAS-DsRed driven by the lush-GAL4 and stained with anti-DsRed. (G) Overlay of (E) and (F). In (E), (F), and (G) the length of each scale bar is 20 μm. See also Figures S3–S5.
Figure 5
Figure 5
Characterizing the role of cry in the antenna (A) cry expression (UAS-cry) in lush expressing cells (lush-GAL4) in the cry01 mutant causes a similar reduction in aversion to BA under UV illumination as do control flies. The control flies carried w+ and the 2nd and 3rd chromosomes were from w1118 (BDSC #5905). n = 8–10. ANOVA followed by Dunn’s multiple comparisons test. (B) Levels of ROS generation in isolated antennae under UV stimulation, shown in terms of change in fluorescence intensity (ΔF/F) using DCFDA. n = 10–11. Mann-Whitney U test. (C) Induction of oxidative stress in support cells is sufficient to reduce aversion to BA in the dark. H. sapiens UAS-duox was expressed using the lush-GAL4. n = 4–5. ANOVA followed by Dunn’s multiple comparisons test. Error bars indicate means ± SEMs. ∗p < 0.05. ∗∗p < 0.01. ns = not significant.
Figure 6
Figure 6
Staining of the antennal lobes using reporters for different trpA1 isoforms (A) Antennal lobe expressing UAS-GFP under the control of the trpA1-AB-GAL4, and stained with anti-GFP and anti-nc82. The white arrowhead indicates an anterior cell (AC) neuron. (B) Antennal lobe expressing UAS-GFP under the control of the trpA1-CD-GAL4, and stained with anti-GFP and anti-nc82. (C) Antennal lobe expressing UAS-GFP under the control of the trpA1-C-T2A-GAL4, and stained with anti-GFP and anti-nc82. (D) Antennal lobe expressing UAS-GFP under the control of the trpA1-D-T2A-GAL4, and stained with anti-GFP and anti-nc82. The length of each scale bar is 20 μm. See also Figure S6.
Figure 7
Figure 7
TRPA1 activity in response to benzaldehyde and ROS (A) Average CoM of control, trpA11, trpA-KO and trpA1-C-KI flies in response to 1% BA from 20 to 60 min during the assay. n = 11. ANOVA followed by Dunn’s multiple comparisons test. (B) Average CoM of trpA11 flies expressing UAS-TRPA1-C or UAS-TRPA1-D driven by the trpA1-CD-GAL4 in response to 1% BA from 20 to 60 min during the assay. ANOVA followed by Dunn’s multiple comparisons test. (C) Average CoM of flies expressing UAS-Kir2.1 driven by trpA1-C-T2A-GAL4 or the orco-GAL4 in response to 1% BA from 20 to 60 min during the assay. n = 5–11. ANOVA followed by Dunn’s multiple comparisons test. (D) Representative whole-cell currents from S2 cells expressing TRPA1-C in response to 0.1% BA and 0.1% AITC. Low concentrations of BA and AITC were sufficient to activate large whole-cell currents because TRPA1-C was overexpressed. (E) Representative whole-cell currents from S2 cells expressing TRPA1-D in response to 0.1% BA and 0.1% AITC. (F) Summary of peak current responses to 0.1% BA from cells expressing only GFP (control), TRPA1C or TRPA1D. n = 3–7. ANOVA followed by Dunn’s multiple comparisons test. (G) Representative whole-cell currents from S2 cells expressing only GFP (control) in response to 100 μM H2O2. (H) Representative whole-cell currents from S2 cells expressing TRPA1-C in response to 100 μM H2O2 and 0.1% BA. (I) Summary of peak current responses to 0.1% BA from cells expressing either GFP only (control) or TRPA1-C. n = 4–6. Mann-Whitney U test. Error bars indicate means ± SEMs. ∗p < 0.05. ∗∗p < 0.01. ∗∗∗p < 0.001. ns = not significant.

References

    1. Spence C. Eating with our ears: assessing the importance of the sounds of consumption on our perception and enjoyment of multisensory flavour experiences. Flavour. 2015;4:3.
    1. Hochenberger R., Ohla K. A bittersweet symphony: Evidence for taste-sound correspondences without effects on taste quality-specific perception. J. Neurosci. Res. 2019;97:267–275. doi: 10.1002/jnr.24308. - DOI - PubMed
    1. Tu Y., Yang Z., Ma C. The taste of plate: how the spiciness of food is affected by the color of the plate used to serve it. J. Sens. Stud. 2016;31:50–60. doi: 10.1111/joss.12190. - DOI
    1. Spence C., Velasco C., Knoeferle K. A large sample study on the influence of the multisensory environment on the wine drinking experience. Flavour. 2014;3:8.
    1. Oberfeld D., Hecht H., Allendorf U., Wickelmaier F. Ambient lighting modifies the flavor of wine. J. Sens. Stud. 2009;24:797–832. doi: 10.1111/j.1745-459X.2009.00239.x. - DOI

LinkOut - more resources