

The Effects of the Ethanol Extract of Allium Ascalonicum L. in High-Fat-High-Fructose-Induced Insulin Resistance Swiss-Webster Male Mice
- PMID: 40395837
- PMCID: PMC12091064
- DOI: 10.2147/JEP.S513301
The Effects of the Ethanol Extract of Allium Ascalonicum L. in High-Fat-High-Fructose-Induced Insulin Resistance Swiss-Webster Male Mice
Abstract
Background: Insulin resistance (IR) is a condition where the body cannot respond properly to insulin, leading to elevated blood glucose and the development of type 2 diabetes mellitus (T2DM). The first-line anti-T2DM drug is metformin, however, it has shown adverse effects, challenging the search for alternative natural drugs. Plant flavonoids stimulate cellular glucose uptake, decrease hyperglycemia, and regulate key signaling pathways in glucose metabolism. Brebes shallots (Allium ascalonicum L.) are known to contain flavonoids and thus may have the potential to inhibit IR.
Purpose: To evaluate the effects of the ethanol extract of Brebes shallots in improving IR conditions.
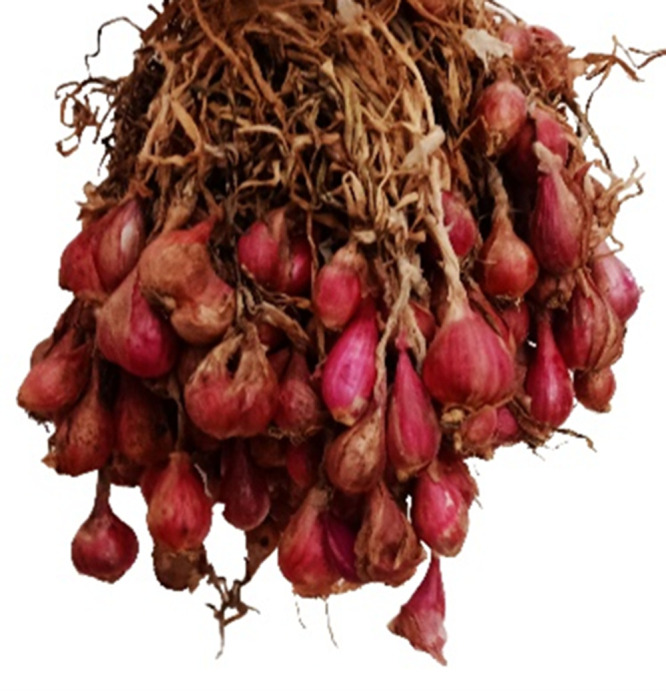
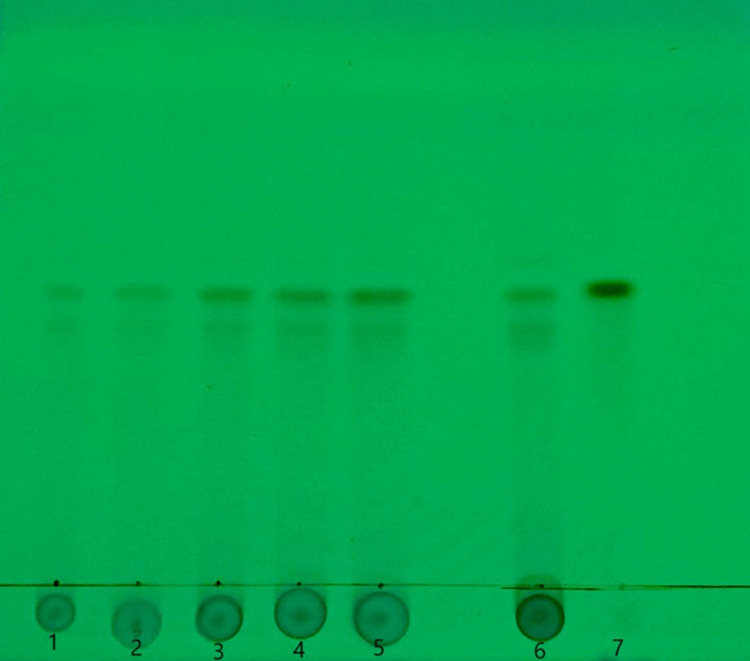
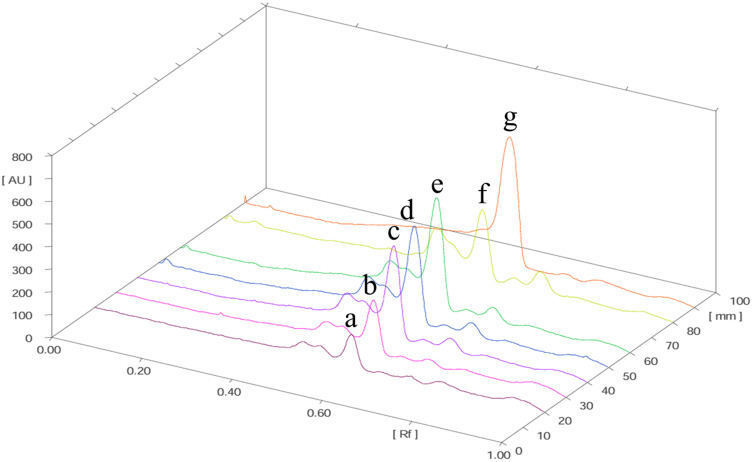
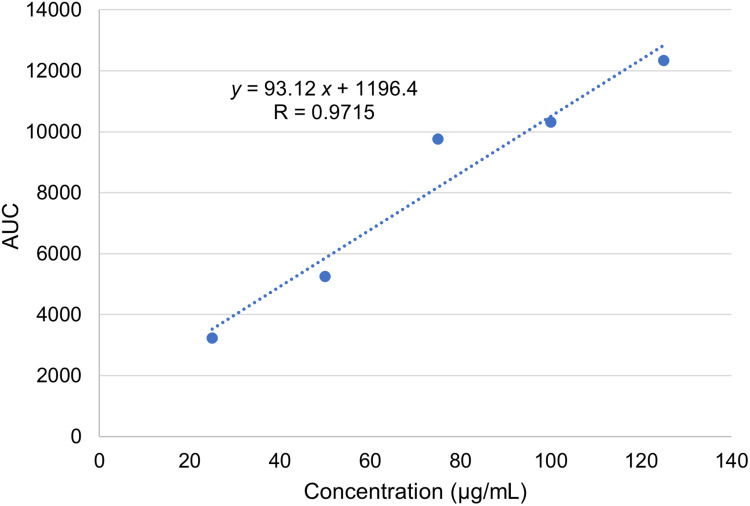
Methods: Brebes shallots were collected from West Java, Indonesia. 500 g of the shallots were oven-dried and extracted using 70% ethanol for 3×24 h, the solvent was evaporated to a thick consistency, and the extract was abbreviated as EAA. The effects of EAA were studied in high-fat-high-fructose (HFHF)-induced Swiss-Webster male mice by performing the insulin tolerance test (ITT) and oral glucose tolerance test (OGTT), and the liver and pancreas index. The nutritional composition and quercetin levels in the extract were also determined.
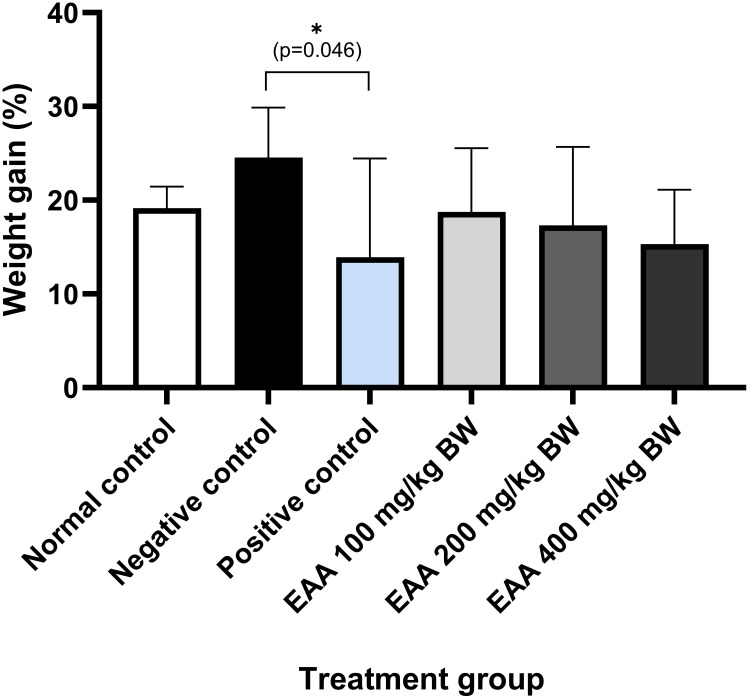
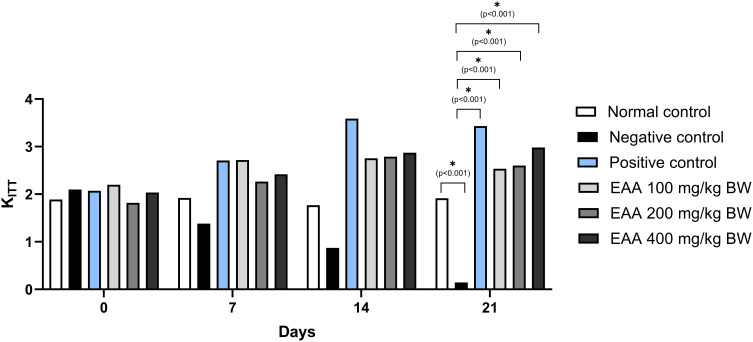
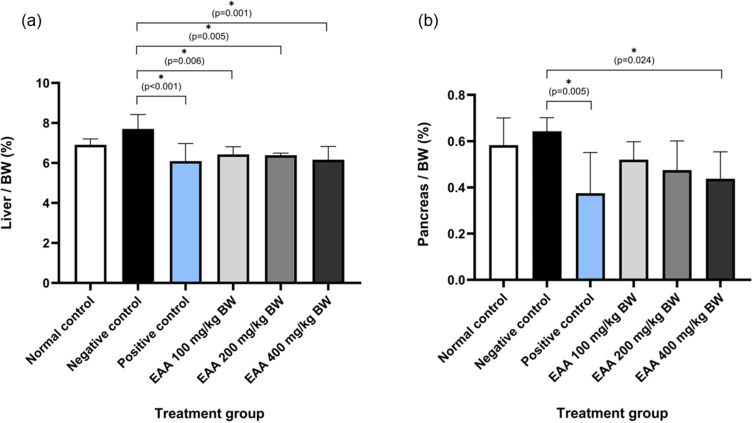
Results: The extraction process yielded a 28.1% EAA. EAA reduces % weight gain, blood glucose levels in OGTT, and liver and pancreas index. EAA significantly improved insulin tolerance in the HFHF-induced mice (p < 0.05). Proximate analysis resulted in 3.92% ash, 0.12% fat, 13.45% protein, and 60.69% carbohydrate, while quercetin was at 0.0065%.
Conclusion: Allium ascalonicum L. extract may improve IR conditions as confirmed by its ability to increase the ITT value and reduce blood glucose levels. However, further studies are needed to confirm its role in alleviating metabolic disorders.
Keywords: Allium sp; diabetes mellitus; flavonoids; hypoglycemia; insulin resistance; quercetin.
© 2025 Elkanawati et al.
Conflict of interest statement
The authors declared no potential conflicts of interest to the research, authorship, or publication of this article.
Figures
Similar articles
-
Erythrina subumbrans (Hassk) Merr. (Fabaceae) Inhibits Insulin Resistance in the Adipose Tissue of High Fructose-Induced Wistar Rats.Drug Des Devel Ther. 2024 Aug 27;18:3825-3839. doi: 10.2147/DDDT.S472660. eCollection 2024. Drug Des Devel Ther. 2024. PMID: 39219697 Free PMC article.
-
Flavonoids extracted from mulberry (Morus alba L.) leaf improve skeletal muscle mitochondrial function by activating AMPK in type 2 diabetes.J Ethnopharmacol. 2020 Feb 10;248:112326. doi: 10.1016/j.jep.2019.112326. Epub 2019 Oct 19. J Ethnopharmacol. 2020. PMID: 31639486
-
A refined-JinQi-JiangTang tablet ameliorates prediabetes by reducing insulin resistance and improving beta cell function in mice.J Ethnopharmacol. 2014;151(1):675-85. doi: 10.1016/j.jep.2013.11.024. Epub 2013 Nov 25. J Ethnopharmacol. 2014. PMID: 24286962
-
Dietary ginger improves glucose dysregulation in a long-term high-fat high-fructose fed prediabetic rat model.Indian J Exp Biol. 2017 Mar;55(3):142-50. Indian J Exp Biol. 2017. PMID: 30184415
-
Cellular Senescence in Diabetes Mellitus: Distinct Senotherapeutic Strategies for Adipose Tissue and Pancreatic β Cells.Front Endocrinol (Lausanne). 2022 Mar 31;13:869414. doi: 10.3389/fendo.2022.869414. eCollection 2022. Front Endocrinol (Lausanne). 2022. PMID: 35432205 Free PMC article. Review.
References
-
- Magliano DJ, Boyko EJ. IDF Diabetes Atlas 10th edition scientific committee. In: IDF DIABETES ATLAS. 10th edition. Brussels. International Diabetes Federation. 2021. Available from https://www.ncbi.nlm.nih.gov/books/NBK581934/. Accessed May 14, 2025.
-
- WHO. Health Topics: diabetes. 2023. Available from: https://www.who.int/health-topics/diabetes. Accessed December 20, 2023.
LinkOut - more resources
Full Text Sources
Research Materials
Miscellaneous
