

This is a preprint.
SCOPE-MRI: Bankart Lesion Detection as a Case Study in Data Curation and Deep Learning for Challenging Diagnoses
- PMID: 40395941
- PMCID: PMC12091705
SCOPE-MRI: Bankart Lesion Detection as a Case Study in Data Curation and Deep Learning for Challenging Diagnoses
Abstract
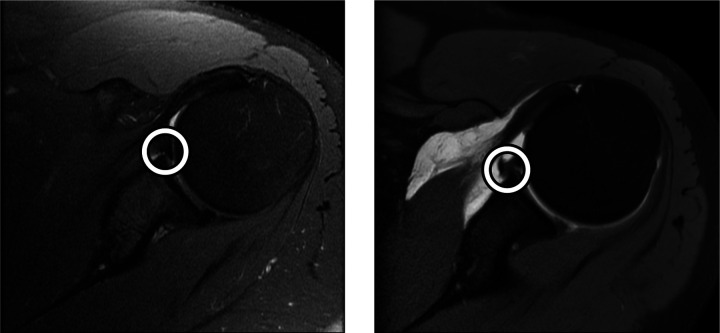
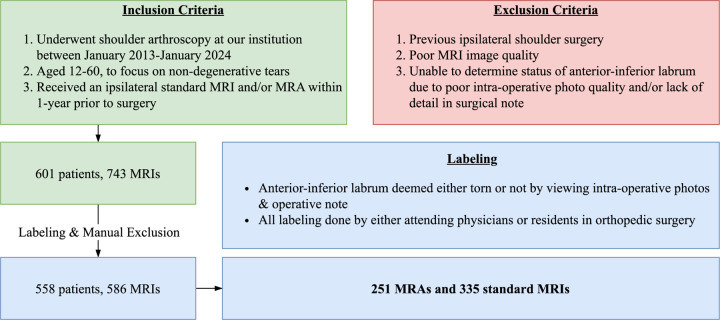
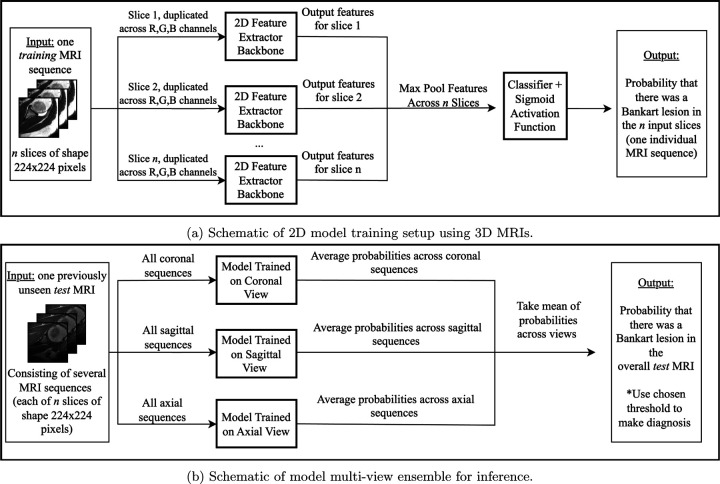
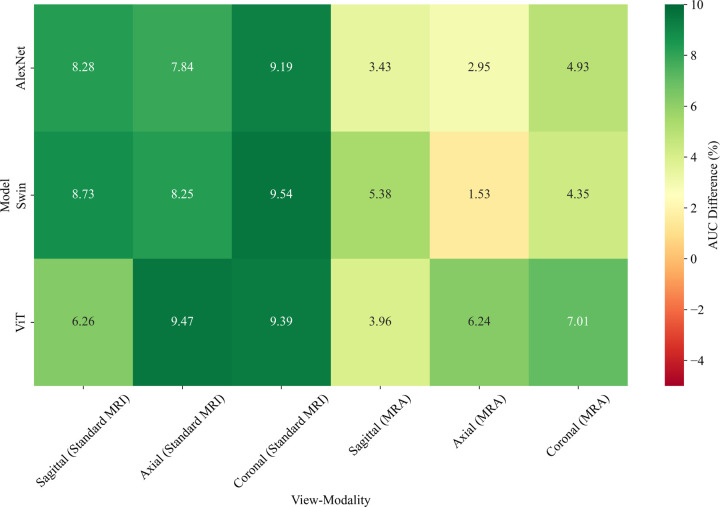
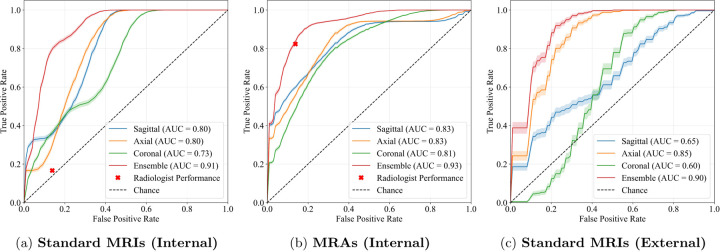
While deep learning has shown strong performance in musculoskeletal imaging, existing work has largely focused on pathologies where diagnosis is not a clinical challenge, leaving more difficult problems underexplored-such as detecting Bankart lesions (anterior-inferior glenoid labral tears) on standard MRIs. Diagnosing these lesions is challenging due to their subtle imaging features, often leading to reliance on invasive MRI arthrograms (MRAs). This study introduces ScopeMRI, the first publicly available, expert-annotated dataset for shoulder pathologies, and presents a deep learning (DL) framework for detecting Bankart lesions on both standard MRIs and MRAs. ScopeMRI includes 586 shoulder MRIs (335 standard, 251 MRAs) from 558 patients who underwent arthroscopy. Ground truth labels were derived from intraoperative findings, the gold standard for diagnosis. Separate DL models for MRAs and standard MRIs were trained using a combination of CNNs and transformers, pre-trained on a public knee MRI dataset. Predictions from sagittal, axial, and coronal views were ensembled to optimize performance. The models were evaluated on a 20% hold-out test set (117 MRIs: 46 MRAs, 71 standard MRIs). The models achieved an AUC of 0.91 and 0.93, sensitivity of 83% and 94%, and specificity of 91% and 86% for standard MRIs and MRAs, respectively. Notably, model performance on non-invasive standard MRIs matched or surpassed radiologists interpreting MRAs. External validation on independent hospital data demonstrated initial generalizability across imaging protocols. This study demonstrates that DL models can achieve radiologist-level diagnostic performance on standard MRIs, reducing the need for invasive MRAs. By releasing ScopeMRI and a modular codebase for training and evaluating deep learning models on 3D medical imaging data, we aim to accelerate research in musculoskeletal imaging and support the development of new datasets for clinically challenging diagnostic tasks.
Keywords: Bankart Lesion; Computer-Aided Diagnosis; Deep Learning; Glenoid Labrum; Labral Tear; Magnetic Resonance Imaging (MRI); Medical Imaging; Orthopedic Surgery.
Conflict of interest statement
Conflict of interest/Competing interests: The authors declare no conflicts of interest.
Figures
Similar articles
-
Toward Non-Invasive Diagnosis of Bankart Lesions with Deep Learning.ArXiv [Preprint]. 2024 Dec 9:arXiv:2412.06717v1. ArXiv. 2024. PMID: 39764408 Free PMC article. Preprint.
-
Shoulder Arthrogram.2023 Apr 3. In: StatPearls [Internet]. Treasure Island (FL): StatPearls Publishing; 2025 Jan–. 2023 Apr 3. In: StatPearls [Internet]. Treasure Island (FL): StatPearls Publishing; 2025 Jan–. PMID: 35593869 Free Books & Documents.
-
Deep-learning-assisted diagnosis for knee magnetic resonance imaging: Development and retrospective validation of MRNet.PLoS Med. 2018 Nov 27;15(11):e1002699. doi: 10.1371/journal.pmed.1002699. eCollection 2018 Nov. PLoS Med. 2018. PMID: 30481176 Free PMC article.
-
A Comprehensive Evaluation of Deep Learning Models on Knee MRIs for the Diagnosis and Classification of Meniscal Tears: A Systematic Review and Meta-Analysis.Diagnostics (Basel). 2024 May 24;14(11):1090. doi: 10.3390/diagnostics14111090. Diagnostics (Basel). 2024. PMID: 38893617 Free PMC article. Review.
-
Anterior Labrum Periosteal Sleeve Avulsion Lesions of the Shoulder: A Scoping Review.Orthop J Sports Med. 2024 Aug 23;12(8):23259671241258198. doi: 10.1177/23259671241258198. eCollection 2024 Aug. Orthop J Sports Med. 2024. PMID: 39183972 Free PMC article.
References
-
- Barnett A. J., Schwartz F. R., Tao C., Chen C., Ren Y., Lo J. Y., and Rudin C., “A case-based interpretable deep learning model for classification of mass lesions in digital mammography,” Nature Machine Intelligence 3, 1061–1070 (Dec. 2021). Publisher: Nature Publishing Group.
-
- Çallı E., Sogancioglu E., van Ginneken B., van Leeuwen K. G., and Murphy K., “Deep learning for chest X-ray analysis: A survey,” Medical Image Analysis 72, 102125 (Aug. 2021). - PubMed
-
- Sun R., Li Y., Zhang T., Mao Z., Wu F., and Zhang Y., “Lesion-Aware Transformers for Diabetic Retinopathy Grading,” in [2021 IEEE/CVF Conference on Computer Vision and Pattern Recognition (CVPR)], 10933–10942, IEEE, Nashville, TN, USA: (June 2021).
-
- Zhang L., Li M., Zhou Y., Lu G., and Zhou Q., “Deep Learning Approach for Anterior Cruciate Ligament Lesion Detection: Evaluation of Diagnostic Performance Using Arthroscopy as the Reference Standard,” Journal of Magnetic Resonance Imaging 52(6), 1745–1752 (2020). _eprint: https://onlinelibrary.wiley.com/doi/pdf/10.1002/jmri.27266. - DOI - PubMed
Publication types
Grants and funding
LinkOut - more resources
Full Text Sources