Air Pollution Exposure, Prefrontal Connectivity, and Emotional Behavior in Early Adolescence
- PMID: 40396529
- PMCID: PMC12093475
Air Pollution Exposure, Prefrontal Connectivity, and Emotional Behavior in Early Adolescence
Abstract
Introduction: Emerging evidence suggests that ambient air pollution may affect the developing brain and contribute to an increased risk of mental health problems. However, most studies have focused on prenatal or early postnatal periods of exposure, with less attention given to the dynamic neurodevelopment period of early adolescence. Moving forward, it is necessary to consider additional periods of exposure, such as adolescence, and the biological mechanisms that may drive potential neurotoxicological effects. This project aimed to investigate whether 1-year exposure to ambient fine particulate matter (PM2.5) and nitrogen dioxide (NO2) at 9-10 years of age was associated with (1) concurrent prefrontal white matter connectivity at ages 9-10 years and (2) emotional health problems at ages 9-10 years as well as 1 year later. Lastly, we hypothesized that poor prefrontal white matter connectivity might be an intermediate marker (i.e., mediator) for the association between 1-year ambient exposure and mental health outcomes.
Methods: We leveraged data from the multisite, nationwide Adolescent Brain Cognitive Development Study (ABCD Study; N = 11,880), with cross-sectional data on diffusion-weighted imaging at 9-10 years (baseline visit) and longitudinal emotional health outcomes at 9-10 (baseline visit) and 10-11 years (1-year follow-up). Based on residential addresses at ages 9-10 years, novel hybrid spatiotemporal exposure models were applied to estimate 1-year average ambient exposure to PM2.5 and NO2. Diffusion tensor imaging (DTI) was used to measure white matter microstructure in tracts that innervate the prefrontal cortex. Emotional behavioral problems were measured based on caregiver reports using the Child Behavioral Checklist (CBCL). Mixed-effect two-pollutant models were fit using both PM2.5 and NO2 and adjusted for the study site, several potential sociodemographic and lifestyle characteristics, and magnetic resonance imaging (MRI) precision variables when necessary. For emotional health outcomes, longitudinal models included interaction terms for pollutant-by-time for both pollutants. Sensitivity analyses were conducted that also accounted for the number of years the child resided at the residential address, as well as adjusting for prenatal PM2.5 and NO2 exposures.
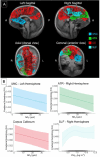
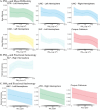
Results: The final analytic sample included 7,546 participants with DTI data and 9,334 participants with emotional behavior data. The annual exposures to PM2.5 and NO2 across 21 study sites were 7.66 μg/m3 [1.72-15.90 μg/m3] and 18.61 ppb [0.73-37.94 ppb], respectively. Annual exposure to PM2.5 was found to be significantly related to prefrontal structural connectivity, including fractional anisotropy (FA) in the right superior longitudinal fasciculus and widespread differences in mean diffusivity (MD) in the corpus callosum, bilateral uncinate fasciculus, left cingulum-hippocampal region, left anterior thalamic radiation, and left superior longitudinal fasciculus. The observed associations between PM2.5 and MD were negative and nonlinear, with greater decreases in MD seen at higher exposure levels. Annual exposure to NO2 was found to have significant, negative linear associations with FA in the right anterior thalamic radiation, left uncinate fasciculus, and corpus callosum. In terms of emotional behavior, 1-year PM2.5 annual exposure was related to slightly less internalizing, anxiety/depression, and aggression problems at the 1-year follow-up. Similarly, 1-year NO2 annual exposure was related to slightly less internalizing and total problems at the 1-year follow-up. Although some of these associations were statistically significant, small parameter estimates suggest these noted effects on emotional outcomes may not be of clinical importance. Given the later findings, the required conditions to test mediation formally were not met.
Conclusions: Our analyses indicate that white matter microstructure is uniquely associated with annual exposure to PM2.5 and NO2 at ages 9-10 years. Against our hypotheses, annual exposure was not related to more emotional problems at ages 9-10 years or after a 1-year follow-up period. These findings suggest air pollution exposure levels below US national ambient air quality standards may have important implications for child white matter development and add to the literature suggesting neurotoxicity at low exposure levels of air pollution may be critical to include in the continuing review and risk assessment for the National Ambient Air Quality Standard.
© 2025 Health Effects Institute. All rights reserved.
Figures


Similar articles
-
Mortality and Morbidity Effects of Long-Term Exposure to Low-Level PM2.5, BC, NO2, and O3: An Analysis of European Cohorts in the ELAPSE Project.Res Rep Health Eff Inst. 2021 Sep;2021(208):1-127. Res Rep Health Eff Inst. 2021. PMID: 36106702 Free PMC article.
-
Mortality-Air Pollution Associations in Low Exposure Environments (MAPLE): Phase 2.Res Rep Health Eff Inst. 2022 Jul;2022(212):1-91. Res Rep Health Eff Inst. 2022. PMID: 36224709 Free PMC article.
-
Assessing Adverse Health Effects of Long-Term Exposure to Low Levels of Ambient Air Pollution: Implementation of Causal Inference Methods.Res Rep Health Eff Inst. 2022 Jan;2022(211):1-56. Res Rep Health Eff Inst. 2022. PMID: 36193708 Free PMC article. Review.
-
Associations of Air Pollution on the Brain in Children: A Brain Imaging Study.Res Rep Health Eff Inst. 2022 Feb;2022(209):1-61. Res Rep Health Eff Inst. 2022. PMID: 36106707 Free PMC article.
-
Ambient air pollution exposure and adult asthma incidence: a systematic review and meta-analysis.Lancet Planet Health. 2024 Dec;8(12):e1065-e1078. doi: 10.1016/S2542-5196(24)00279-1. Lancet Planet Health. 2024. PMID: 39674196
References
-
- Achenbach TM, McConaughy SH, Howell CT. 1987. Child/adolescent behavioral and emotional problems: Implications of cross-informant correlations for situational specificity. Psychol Bull 101(2):213–232. - PubMed
-
- Achenbach TM, Rescorla LA. 2001. Manual for the ASEBA School-Age Forms and Profiles. Burlington, VT, USA, Research Center for Children, Youth and Families, University of Vermont.
-
- Ahmed SM, Mishra GD, Moss KM, Yang IA, Lycett K, Knibbs LD. 2022. Maternal and childhood ambient air pollution exposure and mental health symptoms and psychomotor development in children: An Australian population-based longitudinal study. Environ Int 158:107003; doi:10.1016/j.envint.2021.107003. - PubMed
-
- Allen JL, Liu X, Weston D, Prince L, Oberdörster G, Finkelstein JN, et al. . 2014. Developmental exposure to concentrated ambient ultrafine particulate matter air pollution in mice results in persistent and sex-dependent behavioral neurotoxicity and glial activation. Toxicol Sci 140(1):160–178; doi:10.1093/toxsci/kfu059. - PMC - PubMed
MeSH terms
Substances
LinkOut - more resources
Full Text Sources
Medical
Miscellaneous
