. 2025 Jul 2;31(37):e202500844.
doi: 10.1002/chem.202500844. Epub 2025 May 30.

Two Key Ferredoxins for Nitrogen Fixation Have Different Specificities and Biophysical Properties

Affiliations

Two Key Ferredoxins for Nitrogen Fixation Have Different Specificities and Biophysical Properties

Holly Addison et al. Chemistry. .

Abstract

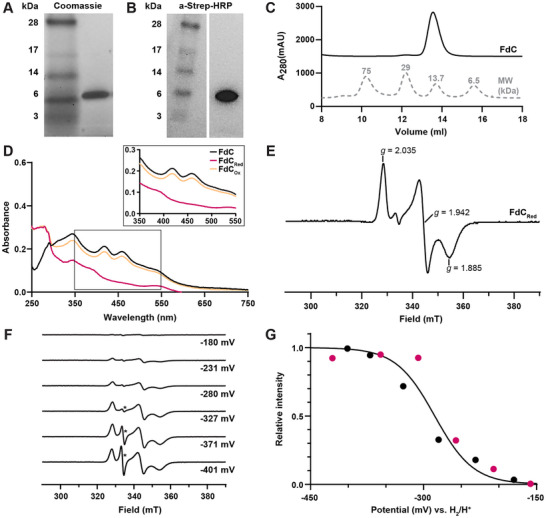
Ferredoxins deliver electrons to drive many challenging biochemical transformations, including enzyme-catalyzed nitrogen fixation. We recently showed two distinct ferredoxins, FdC and FdN, were essential for iron nitrogenase-mediated nitrogen fixation in R. capsulatus. In this study, we perform investigations on FdC and FdN to establish their key differences in terms of specificity, structure, and electronic properties. In vivo complementation studies of both the genes encoding FdC (fdxC) and FdN (fdxN), into ∆fdxC and ∆fdxN R. capsulatus-deletion strains under N2-fixing conditions, showed that plasmid-based expression of fdxN recovered diazotrophic growth and Fe-nitrogenase activity in both ∆fdxC and ∆fdxN strains, while plasmid-based fdxC expression could only complement the ∆fdxC strain. Spectroscopic analysis of FdC and FdN using electron paramagnetic resonance spectroscopy revealed large differences in the electronic features of FdC and FdN. These differences were accompanied by large structural differences between FdC and FdN, assessed by a crystallographic structure of FdC and an AlphaFold model of FdN. We report novel features in the FdC structure, in terms of secondary structure and hydrogen-bonding network, compared with structures of other [Fe2S2]-cluster ferredoxins. Overall, we explore the biophysical properties that influence ferredoxin specificity, while providing new insights into the properties of ferredoxins essential for N2-fixation.

Keywords: electron transport; ferredoxin; metalloenzyme; nitrogen fixation; nitrogenase.


Conflict of interest statement

The authors declare no conflicts of interest.

Figures

Figure 1
Figure 1
Ferredoxins are a structurally diverse group of enzymes. Fd structures and corresponding FeS‐clusters of Fd from Z. mays (left, green, PDB: 3B2F[ 4 ]), FdI from A. vinelandii (middle, orange, PDB: 7FD1[ 5 ]) and Fd from C. pasteurianum (right, pink, PDB: 1CLF[ 6 ]). (Top) Structures of ferredoxins (Fds) that coordinate different types of FeS‐clusters. Fd structures are shown as overlaid surface and cartoon representations. Labelled boxes match the labeling for the FeS‐cluster types below. The star icon is used to indicate which [Fe4S4]‐cluster is visualized on the bottom right. The amino acid (aa) sequence length of the individual Fds is shown in grey below. (Bottom) FeS‐cluster types and coordinating cysteine residues visualized as ball‐and‐stick representations. Iron atoms are colored in orange and sulfur atoms in yellow.
Figure 2
Figure 2
fdxN complements a ∆fdxC R. capsulatus strain while fdxC cannot complement a ∆fdxN R. capsulatus strain. (A, C) Fe‐nitrogenase dependent diazotrophic growth of (A) ∆fdxC R. capsulatus strains, (C) ∆fdxN R. capsulatus strains. (B, D) In vivo Fe‐nitrogenase activity determined by acetylene reduction assays for (B) ∆fdxC R. capsulatus strains, (D) ∆fdxN R. capsulatus strains. An unpaired t‐test with a 95% confidence level was used to determine significance in Fe‐nitrogenase activity between different strains. “ns” stands for “not significant” and “**” indicated a significant difference, with a P‐value < 0.0021, between two groups. (A‐D) The use of “∆” before an italicized gene name indicates this gene has been deleted from the genome of the R. capsulatus strain. A complemented gene expressed from a plasmid, within a R. capsulatus strain, is indicated by the italicized gene name. All R. capsulatus strains have deletions of ∆nifD and ∆modABC to promote the expression of the Fe‐nitrogenase genes (anf). The negative control ∆anfDGK R. capsulatus strain has the genes encoding the Fe‐nitrogenase catalytic component deleted. The optical density (OD) at 660 nm reports on cell growth, as the turbidity is proportional to the number of cells per volume.
Figure 3
Figure 3
Purification and spectroscopic characterization of R. capsulatus ferredoxin C. (A, B) Protein electrophoresis of FdC stained with (A) Coomassie for SDS‐Page analysis and (B) a‐Strep‐HRP for western blot analysis. Ladder is SeeBlue Plus2 prestained ladder. (C) Size exclusion chromatography trace of FdC with low MW standards shown. (D) UV‐Vis absorbance spectra of FdC in the wavelength range of 250 nm–750 nm. FdC traces are in the absence of reductant (FdC, black), reduced with sodium dithionite (FdCred, pink) and oxidized by exposure to air (FdCox, yellow). Highlighted in the box is the wavelength range (350 nm – 550 nm) where unique features of the [Fe2S2]‐cluster containing FdC are observed. (E‐G) EPR spectroscopy of FdC at 15 K. EPR conditions: microwave frequency 9.35 GHz, 13 µW microwave power, 1.0 mT modulation amplitude (0.4 mT in panel E). (E) EPR spectrum of the S = ½ region of the reduced FdC at pH 7.8, with g values indicated. (F) EPR spectra of a reductive titration of FdC. Samples are poised at the reduction potentials indicated, between ‐401 mV and ‐180 mV. The pronounced signal at = 2.002 (*) is from semiquinone radicals of the methyl‐ and benzylviologen mediators. (G) Normalized EPR amplitudes of FdC spectra from two independent reductive titrations, fit to the Nernst equation with n = 1 and an Em of–285 mV. Points represent individual samples and are either black, for the titration shown in (F), or pink, for a second separate titration.
Figure 4
Figure 4
Purification and spectroscopic characterization of R. capsulatus ferredoxin N. (A, B) Protein electrophoresis of FdN stained with (A) Coomassie for SDS‐Page analysis and (B) a‐Strep‐HRP for western blot analysis. Ladder is SeeBlue Plus2 prestained ladder. (C) Size exclusion chromatography trace of FdN with low MW standards shown (same low MW equilibration mix as shown in Figure 3C). (D) UV‐Vis spectra of FdN. FdN traces are in the absence of reductant (FdN, black), reduced with sodium dithionite (FdNred, brown) and oxidized by exposure to air (FdNox, blue). Highlighted in the box is the wavelength range (300 nm–550 nm) showing the unique features of the two [Fe4S4]‐clusters within FdN. (E) EPR spectrum at 10 K of the S = ½ region of the reduced FdN at pH 9.0, with g values indicated. EPR conditions: microwave frequency 9.35 GHz, 0.2 mW microwave power, 1.0 mT modulation amplitude.
Figure 5
Figure 5
The FdC structure reveals the environment of the [Fe2S2]‐cluster. (A) Protein structure of the FdC monomer shown in an overlaid cartoon and surface representation. The model is rotated by ‐90° in the y‐axis plane to show another view. (B) Omit map (black mesh, σ = 3.0) of [Fe2S2]‐cluster and coordinating Cys residues (dashed black lines): C38, C43, C46, and C81. (C‐E) Residues contributing to the hydrogen‐bonding network around the [Fe2S2]‐centre in FdC. Coordinating Cys residues are shown in grey. Blue dashed lines indicate hydrogen bonds. (C) Residues form hydrogen‐bonds with the thiolate side chains of coordinating Cys residues. (D) Residues form hydrogen‐bonds with the sulfides of the [Fe2S2]‐cluster. (E) Hydrogen‐bonds formed between the side chains of residues T45 and Q82 and the [Fe2S2]‐cluster. (F) Magnification of charged residues in close proximity to the [Fe2S2]‐cluster of FdC. (Left box) Charged residues situated on the top helix. (Right box) Charged residues situated on the loop. (G) (Left) Comparison of FdC (shown in red) and ferredoxin I from Equisetum arvense (PDB: 1FRR) (shown in green), with a magnification on the regions with the [Fe2S2]‐clusters (right). (A‐G) FeS‐clusters and highlighted residues are shown as ball‐and‐stick models with iron in orange, sulfur in yellow, oxygen in red and nitrogen in blue.
Figure 6
Figure 6
AlphaFold model of FdN containing two [Fe4S4]‐clusters. (A‐D) AlphaFold model of FdN (AF‐D5ARY6), overlaid with [Fe4S4]‐clusters from C. pasteurianum ferredoxin (PDB: 1CLF).[ 6 ] (A) FdN model shown in an overlaid cartoon and surface representation. 90% of residues in the FdN AlphaFold model have very high predicted local distance difference test (pLDDT > 90) values shown in deep olive, while 10% of the residues have high confidence values (90 > pLLDT > 70) shown in olive. The two [Fe4S4]‐clusters are magnified in panel B and C as labelled. (B‐C) [Fe4S4]‐clusters and coordinating cysteine residues of FdN are shown in ball‐and‐stick representation. Black dashed lines represent coordinate bonds between Cys residues and Fe ions. (D) Overlay of FdN AlphaFold model (AF‐D5ARY6) and C. pasteurianum ferredoxin (1CLF) in cartoon representation. 1CLF is colored blue (color slate). [Fe4S4]‐clusters of 1CLF and coordinating cysteine residues of both Fds are shown in stick representation. The global RMSD between the backbone carbons (Cα) of the two proteins is 2.32 Å as indicated.

Similar articles

References

    1. Goldman A. D., Weber J. M., LaRowe D. E., Barge L. M., Proc. Natl. Acad. Sci. USA 2023, 120, e2210924120. - PMC - PubMed
    1. Jordan S. F., Ioannou I., Rammu H., Halpern A., Bogart L. K., Ahn M., Vasiliadou R., Christodoulou J., Maréchal A., Lane N., Nat. Commun. 2021, 12, 5925. - PMC - PubMed
    1. Mettert E. L., Kiley P. J., Annu. Rev. Microbiol. 2015, 69, 505. - PMC - PubMed
    1. Sakakibara Y., Kimura H., Iwamura A., Saitoh T., Ikegami T., Kurisu G., Hase T., J. Biochem. 2012, 151, 483. - PubMed
    1. Schipke C. G., Goodin D. B., McRee D. E., Stout C. D., Biochemistry 1999, 38, 8228. - PubMed

LinkOut - more resources