. 2025 Oct 1;157(7):1316-1332.
doi: 10.1002/ijc.35480. Epub 2025 May 21.

Associations of sarcopenia, sarcopenia components and sarcopenic obesity with cancer incidence: A prospective cohort study of 414,094 participants in UK Biobank

Affiliations

Associations of sarcopenia, sarcopenia components and sarcopenic obesity with cancer incidence: A prospective cohort study of 414,094 participants in UK Biobank

Panagiotis Filis et al. Int J Cancer. .

Abstract

Sarcopenia is characterised by low grip strength, muscle quantity or quality, and physical performance. This study investigated the associations of sarcopenia and its components with cancer incidence. A prospective cohort study was conducted utilising data from the UK Biobank. Sarcopenia and its components were defined according to the European Working Group on Sarcopenia in Older People criteria (EWGSOP2 2019). Cox proportional hazard models adjusted for sociodemographic, lifestyle, and health-related factors were performed. Overall, 63,379 out of 414,094 study participants had an incident diagnosis of cancer during a median follow-up of 11.7 years. In total, 32,286 participants had probable sarcopenia and 934 confirmed/severe sarcopenia at recruitment. Combined probable, confirmed, and severe sarcopenia was associated with a higher risk of liver (hazard ratio [HR] = 1.65, 95% confidence interval [CI]: 1.17-2.33), haematological (HR = 1.22, 95% CI: 1.01-1.46), and colorectal cancer (HR = 1.21, 95% CI: 1.04-1.41) in males, but not in females. The components of sarcopenia were associated with a higher risk of several cancers, including low grip strength (with liver, haematological and colorectal cancer in males), low muscle mass index (oesophageal in females and oral cancer in males), and slow walking pace (liver and lung in males, lung and overall cancer in females). Compared to participants with non-sarcopenic obesity, those with sarcopenic obesity had a higher risk of colorectal cancer in males (HR = 1.31, 95% CI: 1.03-1.68). Our study suggests that sarcopenia, sarcopenia components, and sarcopenic obesity can be associated with risk for several cancers, mainly of the gastrointestinal tract and in males. Thus, early identification of sarcopenia components may benefit cancer prevention.

Keywords: cancer; grip strength; muscle mass; sarcopenia; sarcopenic obesity.


Conflict of interest statement

All authors declare that they have no conflict of interest.

Figures

FIGURE 1
FIGURE 1
Flowchart of the study.
FIGURE 2
FIGURE 2
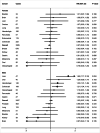
Sex‐specific associations between probable/confirmed/severe sarcopenia versus non‐sarcopenia and cancer incidence for 19 cancers. The same associations are observed for low grip strength, a main component of sarcopenia (<27 kg for males and <16 kg for females), which is included in the definition of all the sarcopenia categories. Data are presented in hazard ratio with 95% confidence intervals. X indicates statistically non‐significant associations; • indicates statistically significant associations; * indicates statistically significant associations after adjustment for false discovery rate (FDR). Probable sarcopenia was defined as low grip strength (<27 kg for males and <16 kg for females). Confirmed sarcopenia was defined as low grip strength and low muscle mass index (<7 kg/m2 for males and <5.5 kg/m2 for females). Severe sarcopenia was defined as low grip strength, low muscle mass index, and slow walking pace. Models adjusted for age, gender (female, male), body mass index (BMI, continuous), Townsend deprivation index (TDI, continuous), smoking status (never/former/current), alcohol frequency intake (never drinker, 1–3 times/month, 1–2 times/week, >3 times/week), metabolic equivalent of task (MET‐minutes/week, continuous), family history of (no/yes), 9‐item dietary intake score (continuous), sedentary behaviour (continuous), cardiovascular disease (no/yes), diabetes (no/yes), nonsteroidal anti‐inflammatory drugs (NSAID) use (no/yes). Prostate cancer was further adjusted for testosterone (continuous) and sex hormone‐binding globulin (SHBG, continuous) concentrations. Breast cancer was further adjusted for history of mammography (no/yes), while additional adjustments for female‐specific cancers were menopausal status (no/yes), oral contraceptive use (no/yes), hormone replacement therapy (HRT) use (no/yes), and age at menarche (continuous).
FIGURE 3
FIGURE 3
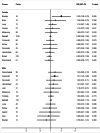
Sex specific associations for the other components of sarcopenia, including low muscle mass index and slow walking pace. (A) Associations between low muscle mass index (<7 kg/m2 for males and <5.5 kg/m2 for females) versus normal muscle mass index and cancer incidence for 19 cancers. (B) Associations between slow walking pace versus normal walking pace and cancer incidence for 19 cancers. Data are presented in hazard ratio with 95% confidence intervals. X indicates statistically non‐significant associations; • indicates statistically significant associations; * indicates statistically significant associations after adjustment for false discovery rate (FDR). Models adjusted for age, gender (female, male), body mass index (BMI, continuous), Townsend deprivation index (TDI, continuous), smoking status (never/ former/current), alcohol frequency intake (never drinker, 1–3 times/month, 1–2 times/week, >3 times/week), metabolic equivalent of task (MET‐minutes/week, continuous), family history of (no/yes), 9‐item dietary intake score (continuous), sedentary behaviour (continuous), cardiovascular disease (no/yes), diabetes (no/yes), nonsteroidal anti‐inflammatory drugs (NSAID) use (no/yes). Prostate cancer was further adjusted for testosterone (continuous) and sex hormone‐binding globulin (SHBG, continuous) concentrations. Breast cancer was further adjusted for history of mammography (no/yes), while additional adjustments for female‐specific cancers were menopausal status (no/yes), oral contraceptive use (no/yes), hormone replacement therapy (HRT) use (no/yes), and age at menarche (continuous).
FIGURE 4
FIGURE 4
Sex‐specific associations between sarcopenic obesity versus non‐sarcopenic obesity and cancer incidence for 19 cancers. Data are presented in hazard ratio with 95% confidence intervals. X indicates statistically non‐significant associations; • indicates statistically significant associations; * indicates statistically significant associations after adjustment for false discovery rate (FDR). Models adjusted for age, gender (female, male), body mass index (BMI, continuous), Townsend deprivation index (TDI, continuous), smoking status (never/ former/current), alcohol frequency intake (never drinker, 1–3 times/month, 1–2 times/week, >3 times/week), metabolic equivalent of task (MET‐minutes/week, continuous), family history of (no/yes), 9‐item dietary intake score (continuous), sedentary behaviour (continuous), cardiovascular disease (no/yes), diabetes (no/yes), nonsteroidal anti‐inflammatory drugs (NSAID) use (no/yes). Prostate cancer was further adjusted for testosterone (continuous) and sex hormone‐binding globulin (SHBG, continuous) concentrations. Breast cancer was further adjusted for history of mammography (no/yes), while additional adjustments for female‐specific cancers were menopausal status (no/yes), oral contraceptive use (no/yes), hormone replacement therapy (HRT) use (no/yes), and age at menarche (continuous).
FIGURE 5
FIGURE 5
Heatmap for the associations of sarcopenia, sarcopenia components and sarcopenic obesity with the incidence of 17 different types of cancer in UK Biobank in (A) females and (B) males. Colour represents the direction of the log hazard ratio (red: higher risk for cancer; blue: lower risk for cancer) from the fully adjusted model. The colour depth indicates association magnitudes (the darker the stronger). The dashed squares indicate non‐applicable associations or associations with zero cases. The boxed full‐line squares denote nominally statistically significant associations. The symbol (*) denotes significance after correction for multiple testing (FDR < 5%). The symbol (§) denotes the associations that survived the sensitivity analysis of excluding participants who had any type of cancer diagnosis or died within a period of 2 years after recruitment. Models adjusted for age, gender (female, male), body mass index (BMI, continuous), Townsend deprivation index (TDI, continuous), smoking status (never/former/current), alcohol frequency intake (never drinker, 1–3 times/month, 1–2 times/week, >3 times/week), metabolic equivalent of task (MET‐minutes/week, continuous), family history of (no/yes), 9‐item dietary intake score (continuous), sedentary behaviour (continuous), cardiovascular disease (no/yes), diabetes (no/yes), nonsteroidal anti‐inflammatory drugs (NSAID) use (no/yes). Prostate cancer was further adjusted for testosterone (continuous) and sex hormone‐binding globulin (SHBG, continuous) concentrations. Breast cancer was further adjusted for history of mammography (no/yes), while additional adjustments for female‐specific cancers were menopausal status (no/yes), oral contraceptive use (no/yes), hormone replacement therapy (HRT) use (no/yes), and age at menarche (continuous).

References

    1. Anker SD, Morley JE, von Haehling S. Welcome to the ICD‐10 code for sarcopenia. J Cachexia Sarcopenia Muscle. 2016;7(5):512‐514. - PMC - PubMed
    1. Walston JD. Sarcopenia in older adults. Curr Opin Rheumatol. 2012;24(6):623‐627. - PMC - PubMed
    1. Rosenberg IH. Summary comments. Am J Clin Nutr. 1989;50(5):1231‐1233.
    1. Cruz‐Jentoft AJ, Bahat G, Bauer J, et al. Sarcopenia: revised European consensus on definition and diagnosis. Age Ageing. 2019;48(1):16‐31. - PMC - PubMed
    1. Cruz‐Jentoft AJ, Baeyens JP, Bauer JM, et al. Sarcopenia: European consensus on definition and diagnosis: report of the European Working Group on Sarcopenia in Older People. Age Ageing. 2010;39(4):412‐423. - PMC - PubMed