. 2025 Jun 17;10(6):e0008425.
doi: 10.1128/msystems.00084-25. Epub 2025 May 21.

Linking oral microbiota to periodontitis and hypertension unveils that Filifactor alocis aggravates hypertension via infiltration of interferon-γ+ T cells

Affiliations

Linking oral microbiota to periodontitis and hypertension unveils that Filifactor alocis aggravates hypertension via infiltration of interferon-γ+ T cells

Jun Zhang et al. mSystems. .

Abstract

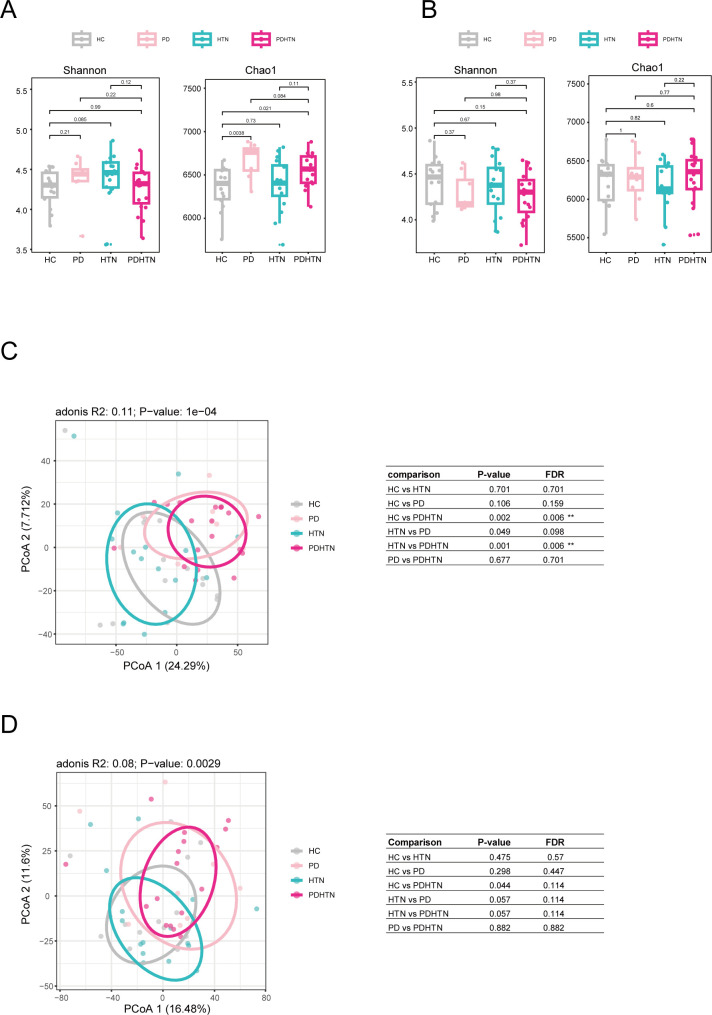
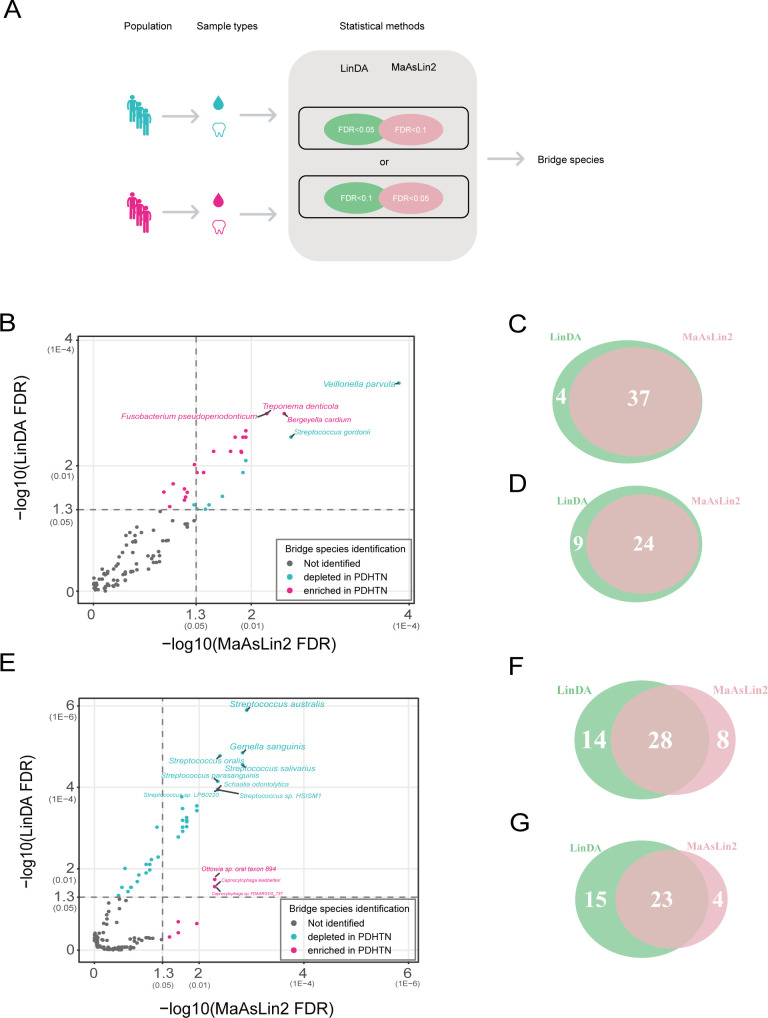
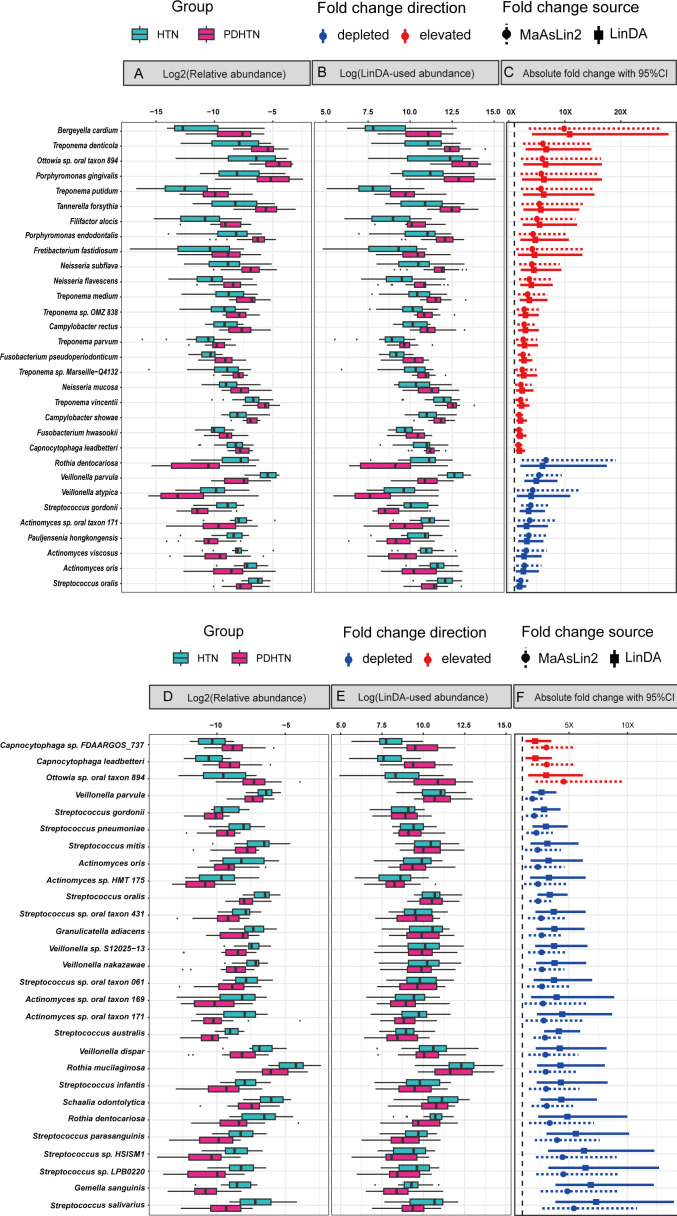
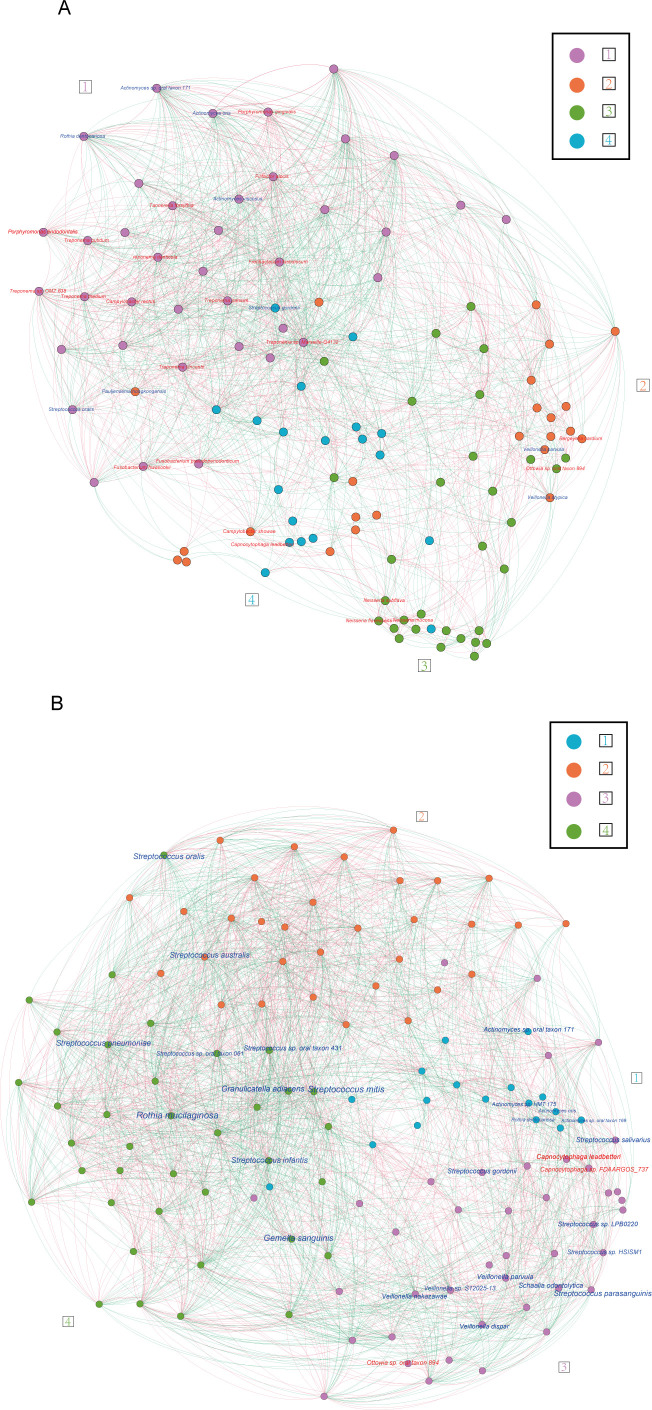
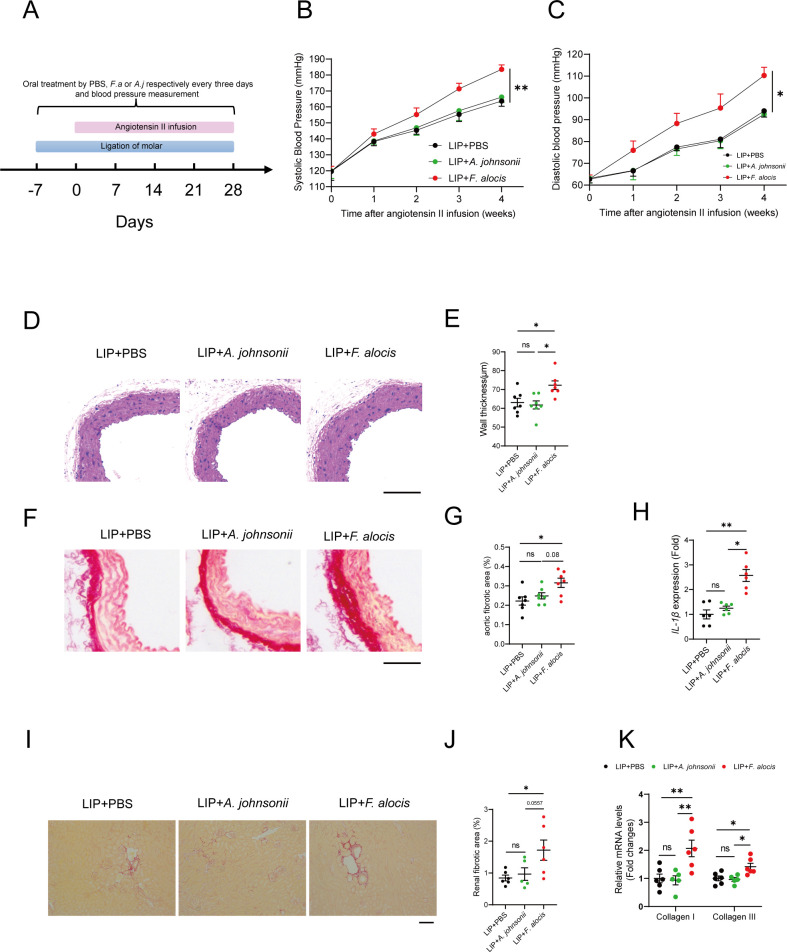
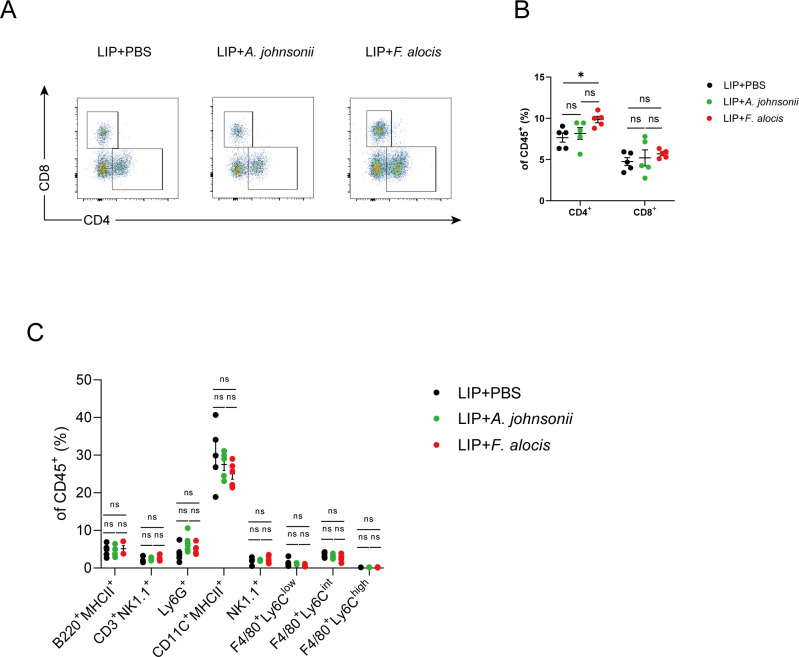
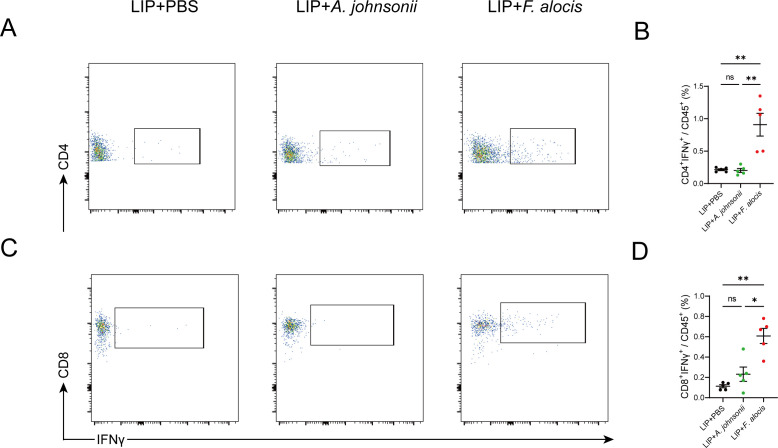
Periodontal disease (PD), an inflammatory disease initiated by oral microbiota, may aggravate hypertension (HTN). Few studies were employed to characterize the oral microbiota in hypertensive patients with periodontitis. To investigate the interplay between oral microbiota and hypertension in individuals with periodontitis, we initiated a metagenomic sequencing study on subgingival plaque and saliva samples sourced from HTN patients and those with hypertension and periodontitis (PDHTN). Our primary objective was to characterize species serving as pivotal links (bridge species) in exacerbating hypertension induced by periodontal disease. Within subgingival plaque and saliva specimens, we pinpointed 31 and 28 bridge species, respectively. Furthermore, we noted a decrease in the abundance of nitrate-reducing bacteria, such as Actinomyces spp., Rothia spp., and Veillonella spp., in PDHTN samples. Employing network analysis, we distinguished distinct polymicrobial clusters within the two patient groups. These bridge species coalesced into polymicrobial clusters, revealing intricate symbiotic and competitive relationships. To substantiate our findings, we leveraged an angiotensin II-infused animal model of ligature-induced periodontitis (LIP), confirming the contributory role of Filifactor alocis-a selectively analyzed subgingival bridge species-in exacerbating hypertension and upregulating the frequency of renal CD4+IFNγ+ and CD8+IFNγ+ T cells. Our study screened a list of species linking PD and HTN. PD may aggravate HTN by decreasing the abundance of nitrate-reducing bacteria and increasing the abundance of pathogens. Using an animal model, we demonstrated that F. alocis aggravates HTN via the accumulation of IFNγ+ T cells in the kidneys.

Importance: Both periodontal disease and hypertension are widely prevalent all over the world. PD may aggravate the development of HTN via oral microbiota. However, few studies were employed to characterize the oral microbiota in hypertensive patients with periodontitis. Here, the present study profiled the oral microbiota in hypertensive participants with periodontitis. We found that the depleted abundance of nitrate-reducing bacteria and the enriched abundance of pathogens. Finally, we validated the role of Filifactor alocis in exacerbating HTN via infiltration of IFNγ+ T cells in mice kidneys. Our study improved the understanding of oral microbiota linking PD and HTN.

Keywords: Filifactor alocis; IFNγ+ T cell; hypertension; oral microbiota; periodontitis.


Conflict of interest statement

The authors declare no conflict of interest.

Figures

Fig 1
Fig 1
Alterations of the diversity in oral microbiota of participants with PD and HTN. (A, B) Chao1 and Shannon index of microbiota in subgingival plaques (A) and saliva (B) of healthy participants, participants with PD, participants with HTN, and participants with PDHTN. (C, D) Principal component analysis (PCoA) and the paired P value (right table) based on Aitchison distances of microbiota in subgingival plaques (C) and saliva (D) of four groups. n = 14:8:16:19 for healthy, PD, HTN, and PDHTN in subgingival plaques and saliva. Wilcoxon rank-sum test was used for statistical analysis in A and B, and permutational multivariate analysis of variance in panels C and D.
Fig 2
Fig 2
Identification of bridge species. (A) Visual summary of the two statistical methods to identify bridge species. (B) Identification of subgingival bridge species (bridge species, namely species associated with the HTN-aggravating effect of PD). A total of 113 species (selected by mean relative abundance > 0.001) in subgingival plaques were calculated via two methods (LinDA and MaAsLin2) to define the bridge species with FDR (false discovery rate) of <0.05 by one method and FDR < 0.1 by the other. 31 subgingival bridge species were identified, including 9 depleted and 22 enriched in PDHTN. The X-axis shows the −log10 of FDR obtained by MaAsLin2, and the Y-axis refers to the −log10 of FDR achieved by LinDA. The untransformed FDRs are displayed in parentheses. (C, D) Venn diagrams showing the overlap number of species in subgingival plaques tested by the two methods with FDR < 0.1 (C) and FDR < 0.05 (D). (E) Identification of salivary bridge species. A total of 127 species (selected by mean relative abundance >0.001) in saliva were tested the same as panel B. 28 salivary bridge species were identified, including 25 depleted and 3 enriched in PDHTN. (F, G) Venn diagrams showing the overlap number of species in saliva tested by the two methods with FDR < 0.1 (F) and FDR < 0.05 (G).
Fig 3
Fig 3
Differential abundances and fold changes of bridge species. (A) Boxplots showing the log2-transformed relative abundance values of subgingival bridge species used in MaAsLin2. (B) Boxplots showing natural log-transformed LinDA-modified abundance values of subgingival bridge species. (C) Absolute fold changes of subgingival bridge species in HTN vs PDHTN. (D) Boxplots showing the log2-transformed relative abundance values of salivary bridge species used in MaAsLin2. (E) Boxplots showing natural log-transformed LinDA-modified abundance values of salivary bridge species. (F) Absolute fold changes of salivary bridge species in HTN vs PDHTN.
Fig 4
Fig 4
Polymicrobial clusters of co-correlated species in the subgingival plaques and saliva of participants with periodontitis and hypertension. (A, B) Network analysis of the species in the subgingival (A) and salivary (B) microbiota of participants with PDHTN. Species selected by mean relative abundance >0.001 were calculated for co-correlated analysis using SparCC correlations and used to construct a network if the |r| > 0.2 and P-value < 0.05. The Louvain algorithm was used to define the clusters, and all clusters were randomly assigned a number and a color. Bridge species were marked into the network and colored in blue if decreased in PDHTN or red if increased in PDHTN. N = 19 for subgingival plaques and saliva.
Fig 5
Fig 5
Filifactor alocis exacerbates angiotensin II-induced HTN in LIP mice. (A) Scheme of the experimental design. Mice were treated by ligation of the molar at day −7 and were orally swabbed with PBS, Actinomyces johnsonii (A. johnsonii) or Filifactor alocis (F. alocis) every 3 days from day −7 to day 28. Hypertensive mice were treated with angiotensin II (Ang II) via subcutaneous infusion using an osmotic pump at day 0 for 4 weeks. (B, C) Noninvasive tail-cuff monitoring of systolic (B) and diastolic blood pressure (C) of LIP mice treated with PBS, A. johnsonii, or F. alocis before and after angiotensin II infusion. (D) Representative H&E staining of the thoracic aortas. Scale bar, 100 µm. (E) Quantification of the aortic wall thickness. (F) Representative picrosirius red staining of the thoracic aortas. Scale bar, 100 µm. (G) Quantification of aortic fibrotic areas. (H) qRT-PCR analysis of IL-1β in aortic tissues. (I) Representative picrosirius red staining of the kidneys. (J) Quantification of renal fibrotic areas. (K) qRT-PCR analysis of fibrotic genes in kidneys. Scale bars, 100 µm. LIP, ligature-induced periodontitis. Data were presented as mean ± SEM and analyzed using one-way ANOVA and two-way ANOVA. N = 6:6:6 for blood pressure measurement, N = 7:7:7 for aortas and N = 6:5:6 for kidneys. *adjusted P < 0.05, ** adjusted P < 0.01.
Fig 6
Fig 6
Filifactor alocis increases CD4+ T-cell infiltration in kidneys of angiotensin II-infused LIP mice. (A) Representative flow cytometry analysis of T cells in the mice kidneys. (B) Quantification of the percentage of CD4+ T cells and CD8+ T cells in CD45+ cells in the mice kidneys. (C) Quantification of the percentage of lymphoid and myeloid cells in CD45+ cells in the mice kidneys. LIP, ligature-induced periodontitis. Data were presented as mean ± SEM and analyzed using one-way ANOVA. N = 5:5:5 in each group. * adjusted P < 0.05.
Fig 7
Fig 7
Filifactor alocis increases CD4+IFNγ+ and CD8+IFNγ+ T-cell infiltration in kidneys of angiotensin II-infused LIP mice. (A) Representative flow cytometry analysis of CD4+IFNγ+ T cells in the mice kidneys. (B) Quantification of the percentage of CD4+IFNγ+ T cells in CD45+ cells in the mice kidneys. (C) Representative flow cytometry analysis of CD8+IFNγ+ T cells in the mice kidneys. (D) Quantification of the percentage of CD8+IFNγ+ T cells in CD45+ cells in the mice kidneys. LIP, ligature-induced periodontitis. Data were presented as mean ± SEM and analyzed using one-way ANOVA. N = 5:5:5 in each group. *Adjusted P < 0.05, ** adjusted P < 0.01.

Similar articles

References

    1. Forouzanfar MH, Liu P, Roth GA, Ng M, Biryukov S, Marczak L, Alexander L, Estep K, Hassen Abate K, Akinyemiju TF, et al. 2017. Global burden of hypertension and systolic blood pressure of at least 110 to 115 mm hg, 1990-2015. JAMA 317:165–182. doi: 10.1001/jama.2016.19043 - DOI - PubMed
    1. Joffres M, Falaschetti E, Gillespie C, Robitaille C, Loustalot F, Poulter N, McAlister FA, Johansen H, Baclic O, Campbell N. 2013. Hypertension prevalence, awareness, treatment and control in national surveys from England, the USA and Canada, and correlation with stroke and ischaemic heart disease mortality: a cross-sectional study. BMJ Open 3:e003423. doi: 10.1136/bmjopen-2013-003423 - DOI - PMC - PubMed
    1. Williams B, Mancia G, Spiering W, Agabiti Rosei E, Azizi M, Burnier M, Clement DL, Coca A, de Simone G, Dominiczak A, et al. 2018. 2018 ESC/ESH guidelines for the management of arterial hypertension. Eur Heart J 39:3021–3104. doi: 10.1093/eurheartj/ehy339 - DOI - PubMed
    1. Hajishengallis G, Chavakis T. 2021. Local and systemic mechanisms linking periodontal disease and inflammatory comorbidities. Nat Rev Immunol 21:426–440. doi: 10.1038/s41577-020-00488-6 - DOI - PMC - PubMed
    1. Pietropaoli D, Del Pinto R, Ferri C, Wright JT Jr, Giannoni M, Ortu E, Monaco A. 2018. Poor oral health and blood pressure control among US hypertensive adults. Hypertension 72:1365–1373. doi: 10.1161/HYPERTENSIONAHA.118.11528 - DOI - PubMed

Substances