. 2025 Aug 4;224(8):e202410206.
doi: 10.1083/jcb.202410206. Epub 2025 May 21.

Structure of the microtubule-anchoring factor NEDD1 bound to the γ-tubulin ring complex

Affiliations

Structure of the microtubule-anchoring factor NEDD1 bound to the γ-tubulin ring complex

Hugo Muñoz-Hernández et al. J Cell Biol. .

Abstract

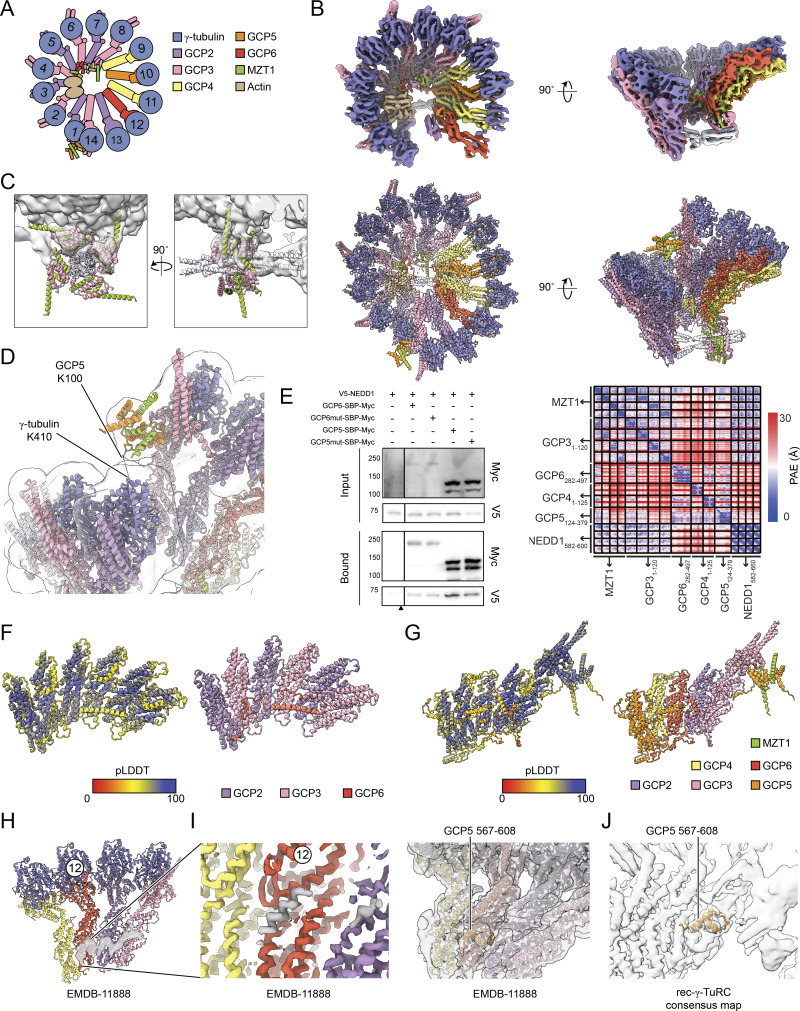
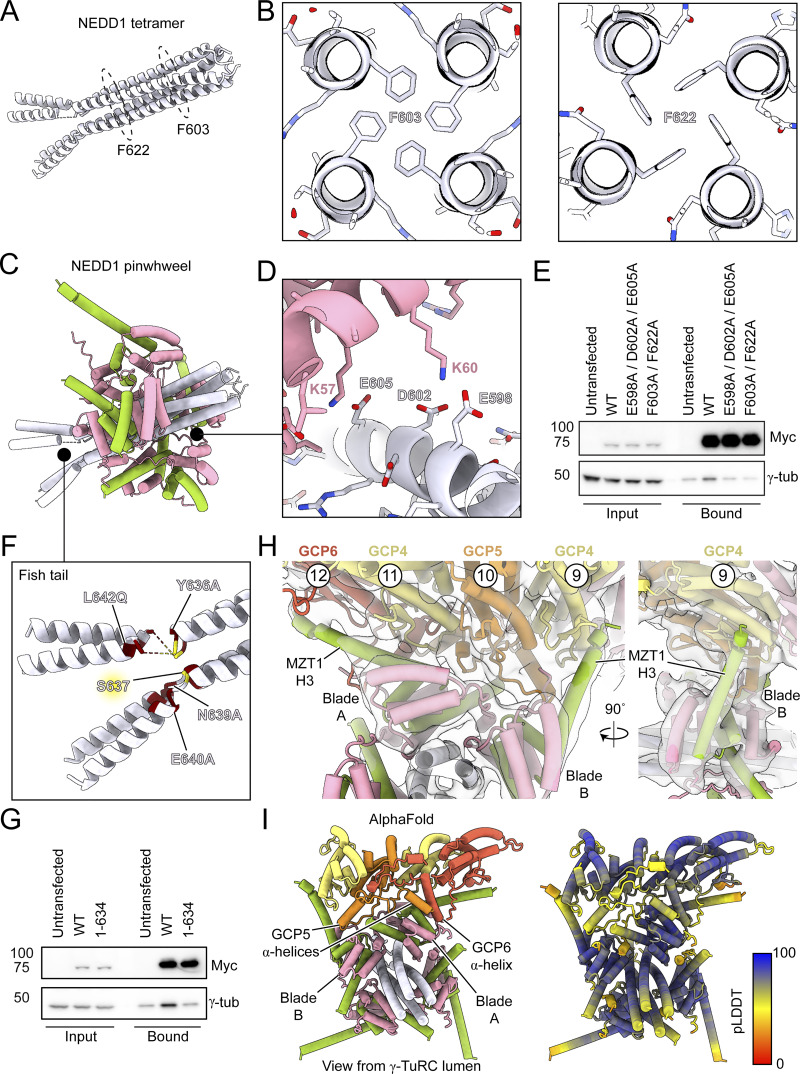
The γ-tubulin ring complex (γ-TuRC) is an essential multiprotein assembly that provides a template for microtubule nucleation. The γ-TuRC is recruited to microtubule-organizing centers (MTOCs) by the evolutionarily conserved attachment factor NEDD1. However, the structural basis of the NEDD1-γ-TuRC interaction is not known. Here, we report cryo-EM structures of NEDD1 bound to the human γ-TuRC in the absence or presence of the activating factor CDK5RAP2. We found that the C-terminus of NEDD1 forms a tetrameric α-helical assembly that contacts the lumen of the γ-TuRC cone and orients its microtubule-binding domain away from the complex. The structure of the γ-TuRC simultaneously bound to NEDD1 and CDK5RAP2 reveals that both factors can associate with the "open" conformation of the complex. Our results show that NEDD1 does not induce substantial conformational changes in the γ-TuRC but suggest that anchoring of γ-TuRC-capped microtubules by NEDD1 would be structurally compatible with the significant conformational changes experienced by the γ-TuRC during microtubule nucleation.


Conflict of interest statement

Disclosures: The authors declare no competing interests exist.

Figures

Figure 1.
Figure 1.
A pinwheel-shaped structure consisting of a tetrameric NEDD1 helical bundle and four MZT1:GCP3-NHD modules docks onto the base of the asymmetric cone-shaped human γ-TuRC. (A) Schematic of the human NEDD1 sequence. A zoom in on the C-terminal helical region predicted to form several α-helices is shown. Secondary structure predictions are taken from UniProt Consortium (2023). (B) Cartoon representation of the MZT1:GCP3-NHD structure in the γ-TuRC lumenal bridge, from PDB ID: 6X0U (Wieczorek et al., 2020a). (C) Two views of an AlphaFold prediction containing four copies each of NEDD1 residues 571–660, MZT1, and GCP3 residues 1–120. The model on the left is colored according to the predicted local distance difference test (pLDDT) score from the AlphaFold prediction. (D) Two views of the consensus rec-γ-TuRC density map (surface representation). The seam, lumenal bridge, and pinwheel-shaped densities are labeled; the pinwheel-shaped density is colored in lavender. Map resolution is 4.7 Å, but is shown at a low threshold to include features with weaker density. Higher resolution features can be found in Fig. S3 B. (E) Two views of the pinwheel density postprocessed using EMready (He et al., 2023) (light pink surface representation). The CryoSPARC postprocessed map is shown at the same threshold as in D as a transparent white surface for reference. The pinwheel axle containing the fishtail and α-helical tetramer, as well as pinwheel blades A–D, are indicated. (F) Two views of the refined γ-TuRC model in the rec-γ-TuRC consensus map, focusing on the pinwheel density. Blades C and D are omitted for clarity, and pinwheel features are labeled as in E.
Figure S1.
Figure S1.
AlphaFold predictions and NEDD1 conservation analysis. (A) Cartoon representation of AlphaFold 3 prediction of four copies each of human NEDD1(571–660), MZT1, and GCP3(1–120) colored by subunit (left) and pLDDT (right). (B) Partial alignment error plot for the prediction in A. (C) Cartoon representation of AlphaFold 3 prediction of four copies each of human NEDD1(571–660), MZT2A, and GCP2(1–120) colored by subunit (left) and pLDDT (right). (D) Partial alignment error plot for the prediction in C. (E) Cartoon representation of AlphaFold 3 prediction of full-length A. thaliana NEDD1, MZT1A, and GCP3 colored by subunit (left) and pLDDT (right). (F) Partial alignment error plot for the prediction in E. (G) Cartoon representation of AlphaFold 3 prediction of full-length A. thaliana NEDD1, MZT1A, and GCP5A colored by subunit (left) and pLDDT (right). (H) Partial alignment error plot for the prediction in G. Yellow boxes in F and H highlight expected regions for the formation of NEDD1:MZT:GCP–NHD subcomplexes. (I) Cartoon representation of AlphaFold 3 model of the NEDD1 pinwheel in A. MZT1 and GCP3-NHD are colored according to the legend in A; NEDD1 is colored according to conservation as scored in the color key. A multiple sequence alignment of 141 annotated protein sequences across various species was used to score conservation. Residues mutated in this study are shown in stick representation on the right-hand model of NEDD1 alone. (J) Conservation of NEDD1 residues 571–660. Generated using WebLogo (Crooks et al., 2004).
Figure S2.
Figure S2.
Cryo-EM processing pipeline. (A) Summary of the new rec-γ-TuRC cryo-EM data processing strategy. Cryo-EM collection details were reported in Aher et al. (2024). (B) Gold-standard Fourier shell correlation (FSC) plot for the consensus rec-γ-TuRC density map. The FSC at 0.143 is indicated by a dashed line. (C) Summary of new rec-γ-TuRC + sDK5RAP2 cryo-EM data processing strategy. Cryo-EM collection details for datasets 1–4 (marked by asterisks) were reported in Xu et al. (2024). (D) Gold-standard FSC plot for the consensus rec-γ-TuRC + CDK5RAP2 density map. The FSC at 0.143 is indicated by a dashed line. (E) Two views of the consensus rec-γ-TuRC density map analyzed by CryoSPARC, showing a resolution distribution ranging from 2.5 to >12.5 Å. (F) Two views of the particle angular distribution overlaid onto the rec-γ-TuRC consensus map. (G) Two views of the consensus rec-γ-TuRC + CDK5RAP2 density map analyzed by CryoSPARC, showing a resolution distribution ranging from 2.5 to >12.5 Å. (H) Two views of the particle angular distribution overlaid onto the rec-γ-TuRC + CDK5RAP2 consensus map.
Figure S3.
Figure S3.
Details regarding rec-γ-TuRC consensus reconstruction and model building. (A) Schematic of the γ-TuRC highlighting subunit composition and numbering across the complex. (B) Top: two views of the rec-γ-TuRC consensus map showing higher resolution features. Map was sharpened in CryoSPARC and postprocessed with EMready (He et al., 2023). Bottom: two views of the refined rec-γ-TuRC model, including the NEDD1 pinwheel. (C) Two views of the NEDD1 pinwheel predicted by AlphaFold 3 (cartoon representation) fitted into the pinwheel density in the rec-γ-TuRC consensus map (transparent surface). (D) Cartoon representation view of MZT1:GCP5-NHD at the rec-γ-TuRC seam with the consensus density map in transparent surface representation. GCP5 K100 and γ-tubulin K410, identified as cross-linked residues in the native human γ-TuRC, are indicated (Consolati et al., 2020). (E) Left: western blot of inputs and bound fractions of SBP pulldowns of GCP-SBP-Myc constructs from HEK293T cells. GCP6mut corresponds to a deletion of GCP6 residues 329–341, while GCP5mut corresponds to a quadruple mutant of GCP5 R213A/R228G/L256E/V258E. Cells untransfected with any GCP-SBP-Myc constructs served as a negative control. Black triangle indicates location where blots were cropped for final figure generation. The experiment was performed three times with similar results. Right: partial alignment error plot for the AlphaFold prediction in Fig. 2 I. (F) Cartoon representation of AlphaFold 3 prediction of three copies each of GCP2 and GCP3 GRIP1 domains, together with the GCP6 belt and residues 191–252, colored by pLDDT (left) and subunit (right). (G) Segmented surface representation of the previously described helical element lining the lumenal face of GCP6, 2, and 3 in EMDB-11888 (Zimmermann et al., 2020). Map was postprocessed with EMready (He et al., 2023). The γ-TuRC subunits from the same study are shown in cartoon representation for reference. A zoomed in view of an unassigned helix contacting GCP6 is shown on the right and at a higher threshold. (G) Cartoon representation of AlphaFold 3 prediction of GRIP1 domains of GCP4, GCP5 (including NHD), GCP6, and GCP2, as well as MZT1 and the GRIP1 and GRIP2 domains of GCP3, colored by pLDDT (left) and subunit (right). The GCP5 insertion element that contacts the lumenal face of GCP6 is indicated. (H and I) Segmented surface representation of the previously described helical element lining the lumenal face of GCP6, 2, and 3 in EMDB-11888 (Zimmermann et al., 2020). Map was postprocessed with EMready (He et al., 2023). The γ-TuRC subunits from the same study are shown in cartoon representation for reference. A zoomed in view of an unassigned helix contacting GCP6 is shown in I (left) and at a higher threshold. The right shows the GCP5 insertion (aa 567–608) modeled in this study in cartoon representation and fitted into the EMDB-11888 density map (Zimmermann et al., 2020). (J) The GCP5 insertion modeled in this study (aa 567–608) is shown in cartoon representation in the rec-γ-TuRC density map. γ-TuRC position 12 corresponding to GCP6 is indicated in panels G, I, and J for reference. pLDDT, predicted local distance difference test. Source data are available for this figure: SourceData FS3.
Figure 2.
Figure 2.
The NEDD1 pinwheel associates with the γ-TuRC through multiple interfaces. (A) Cartoon representation of a model of the NEDD1 C-terminal tetramer. Locations of conserved F603 and F622 residues are highlighted by dashed circles. (B) Cross-section views of the NEDD1 tetramer AlphaFold model showing the predicted packing of F603 (left) and F622 (right). (C) Cartoon representation of a model of the NEDD1 pinwheel, color as in Fig. 1 F. Black circles indicate zoom in areas of interest for panels D and F. (D) Zoom in view of NEDD1 pinwheel AlphaFold model for regions specified in C, showing conserved residues involved in electrostatic interactions between NEDD1 and GCP3 in the pinwheel. (E) Western blot of inputs and bound fractions of SBP pulldowns of Myc-SBP-NEDD1 constructs from HEK293T cells. Untransfected cells served as a negative control. (F) Zoom in view of the fishtail region of the NEDD1 pinwheel model, highlighting previously reported mutations that abolish NEDD1:γ-TuRC interactions (maroon) (Manning et al., 2010), as well as an identified Plk1 phosphorylation site (yellow) (Zhang et al., 2009). (G) Western blot of inputs and bound fractions of SBP pulldowns of Myc-SBP-NEDD1 constructs from HEK293T cells. 1–634 refers to a NEDD1 fishtail deletion lacking residues 635–660. Untransfected cells served as a negative control. (H) Two views of the NEDD1 pinwheel Blades A and B bound to the base of the γ-TuRC (cartoon representation with cryo-EM density in transparent grey surface). (I) Lumenal view of an AlphaFold prediction of the NEDD1 pinwheel contacting the GRIP1 domains of GCP4–6. The model on the right is colored according to the pLDDT. pLDDT, predicted local distance difference test. Experiments in E and G were performed three times with similar results. Source data are available for this figure: SourceData F2.
Figure 3.
Figure 3.
The NEDD1 pinwheel contacts an extension in the GCP6 belt and enables the assignment of MZT1:GCP5-NHD to the γ-TuRC seam. (A) Two views of the upper helical pair of the NEDD1 fishtail contacting positions 1 and 2 of the γ-TuRC (top: cartoon representation and cryo-EM density in transparent grey surface; middle: cartoon representation of NEDD1 and GCP6 next to a surface representation of the γ-TuRC). Newly modeled GCP6 residues 191–252 extending from the GCP6 belt are indicated. The bottom panel shows a rotated view of the same interface to highlight the unattached helical pair in the fishtail. γ-TuRC subunit positions 1 (GCP2) and 2 (GCP3) are indicated, where possible. (B) AlphaFold model of GCP3, MZT1:GCP5-NHD, and γ-tubulin rigid-body fitted in the rec-γ-TuRC consensus map (transparent representation; right). The model on the left is colored according to the pLDDT score from the AlphaFold prediction (cartoon representation). The model in the middle is shown in surface representation and is colored according to the legend. (C) AlphaFold model of GCP3, MZT1:GCP3-NHD, and γ-tubulin rigid-body fitted in the rec-γ-TuRC consensus map (transparent representation; right). The model on the left is colored according to the pLDDT score from the AlphaFold prediction (cartoon representation). The model in the middle is shown in surface representation and is colored according to the legend. (D) Rigid body-fitted AlphaFold model of GCP5, GCP4, GCP6, GCP2, GCP3, and MZT1 in the rec-γ-TuRC consensus map (transparent representation). MZT1:GCP5-NHD, GCP3, and the disordered GCP5 linker (aa 120–200) are indicated. The Euclidean distance between GCP5 residues 120 and 200 in the model is indicated. (E) Secondary structure prediction of human GCP5 residues 120–200. Top: primary sequence (red = predicted α-helices); middle: jnetpred secondary structure prediction result (red = α-helices); bottom: confidence score for the prediction. Figure panel generated using Jalview (Waterhouse et al., 2009). pLDDT, predicted local distance difference test.
Figure 4.
Figure 4.
A fragment of CDK5RAP2 can associate with the NEDD1-bound γ-TuRC. (A) Two views of the consensus rec-γ-TuRC + CDK5RAP2 density map (surface representation). Unassigned, NEDD1 pinwheel and CMG module densities are indicated. Map resolution is 5.1 Å but is shown at a low threshold to include features with weaker density. (B) A schematic top view of the γ-TuRC’s subunit organization. (C) Side view of a refined molecular model of the rec-γ-TuRC + CDK5RAP2 (cartoon representation), with zoomed in views for the CMG module at position 13 and NEDD1 pinwheel in the density (transparent surface).
Figure 5.
Figure 5.
NEDD1 does not influence the conformation of the γ-TuRC. (A) Two cartoon representation views of superimposed rec-γ-TuRC (grey) and rec-γ-TuRC + CDK5RAP2 (magenta) models determined in this study. The right panel shows a close-up view of the NEDD1 pinwheel and its binding interface with the GRIP1 domains of GCP4–6 at positions 9–12. (B) Two cartoon representation views of superimposed rec-γ-TuRC (grey) and a “partially-closed”, CMG-decorated γ-TuRC (blue; PDB: 9G3Y [Xu et al., 2024]). The right panel shows a close-up view of the NEDD1 pinwheel and its location relative to the GRIP1 domains of GCPs modeled at positions 9–12. (C) Two cartoon representation views of superimposed rec-γ-TuRC (grey) and the “fully-closed” rec-γ-TuRC (green; PDB: 8VRK [Aher et al., 2024]). The right panel shows a close-up view of the NEDD1 pinwheel and its location relative to the GRIP1 domains of GCPs modeled at positions 9–12. RMSD values for γ-tubulins at position 14 (left) and position 9–12 GCP GRIP1 domains (right) are indicated in panels A–C. Asterisk in panel C is to clarify that the GRIP1 domains in 8VRK correspond not to GCP4/5/6 but to GCP2/3 models, built into an 8.5-Å reconstruction (Aher et al., 2024), both of which might potentially limit the accuracy of the RMSD measurement in this example. (D) Plot of Euclidean center of mass distances (dCOM) versus γ-TuRC subunit position between the indicated γ-TuRC models (rec-γ-TuRC, rec-γ-TuRC + CDK5RAP2, PDB: 6V6S as the open conformation (Wieczorek et al., 2020b), and the “partially-closed,” CMG-decorated (Xu et al., 2024), all relative to PDB: 8VRK, corresponding to a model of the closed rec-γ-TuRC (Aher et al., 2024). (E) Plot of the average shift in θ versus the shift in ϕ for helix H12 in γ-tubulins from each γ-TuRC described in D, relative to γ-tubulins at the same positions in the closed γ-TuRC (green circle, indicated). Standard errors in ϕ and θ are displayed as lines. The axes in E are scaled equally. Coloring in E follows the legend in D. (F) Model summarizing the findings in this study. The rec-γ-TuRC + CDK5RAP2 model has been converted to a 15-Å low-pass filtered map and colored according to Fig. 4 B. Unresolved WD40 domains stemming from the NEDD1 pinwheel and available to interact with centrosomes, microtubules, augmin, and/or other partners are shown as hexagons. Free CMG module–binding sites that should still be able to induce γ-tubulin ring closure in the presence of the NEDD1 pinwheel are indicated. RSMD, root mean squared deviation.

Update of

Similar articles

Cited by

References

    1. Abramson, J., Adler J., Dunger J., Evans R., Green T., Pritzel A., Ronneberger O., Willmore L., Ballard A.J., Bambrick J., et al. 2024. Accurate structure prediction of biomolecular interactions with AlphaFold 3. Nature. 630:493–500. 10.1038/s41586-024-07487-w - DOI - PMC - PubMed
    1. Afonine, P.V., Poon B.K., Read R.J., Sobolev O.V., Terwilliger T.C., Urzhumtsev A., and Adams P.D.. 2018. Real-space refinement in PHENIX for cryo-EM and crystallography. Acta Crystallogr. D Struct. Biol. 74:531–544. 10.1107/S2059798318006551 - DOI - PMC - PubMed
    1. Aher, A., Urnavicius L., Xue A., Neselu K., and Kapoor T.M.. 2024. Structure of the γ-tubulin ring complex-capped microtubule. Nat. Struct. Mol. Biol. 31:1124–1133. 10.1038/s41594-024-01264-z - DOI - PMC - PubMed
    1. Bepler, T., Kelley K., Noble A.J., and Berger B.. 2020. Topaz-denoise: General deep denoising models for cryoEM and cryoET. Nat. Commun. 11:5208. 10.1038/s41467-020-18952-1 - DOI - PMC - PubMed
    1. Brito, C., Serna M., Guerra P., Llorca O., and Surrey T.. 2024. Transition of human γ-tubulin ring complex into a closed conformation during microtubule nucleation. Science. 383:870–876. 10.1126/science.adk6160 - DOI - PubMed

MeSH terms

LinkOut - more resources