. 2025 Aug 4;224(8):e202408042.
doi: 10.1083/jcb.202408042. Epub 2025 May 21.

A conserved role for centriolar satellites in translation of centrosomal and ciliary proteins

Affiliations

A conserved role for centriolar satellites in translation of centrosomal and ciliary proteins

Claudia Pachinger et al. J Cell Biol. .

Abstract

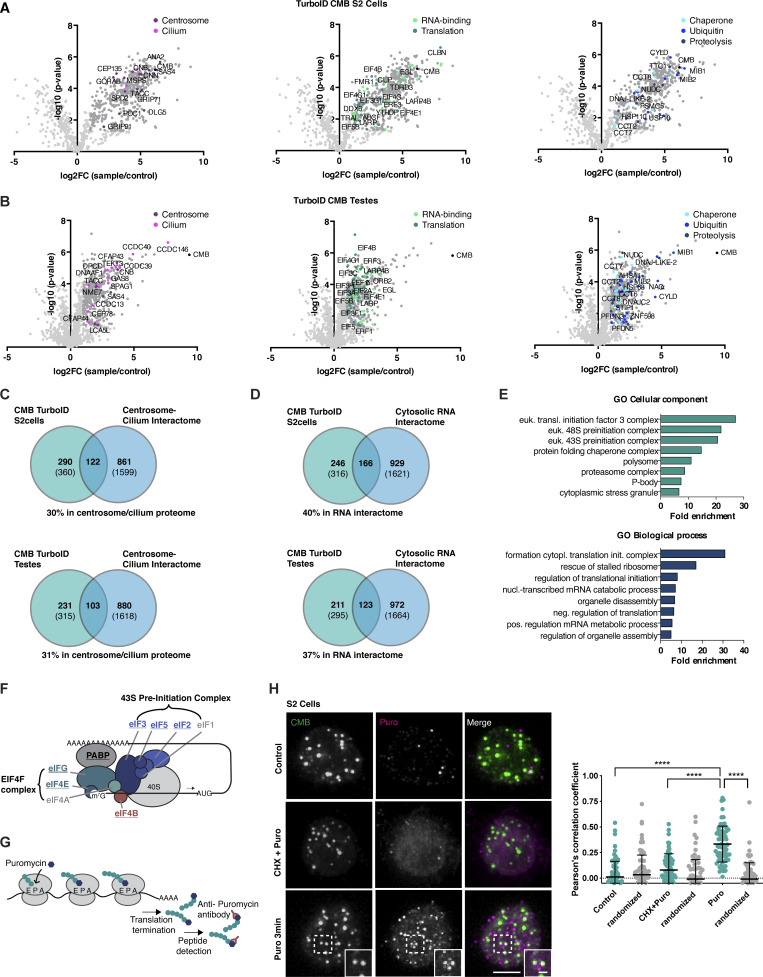
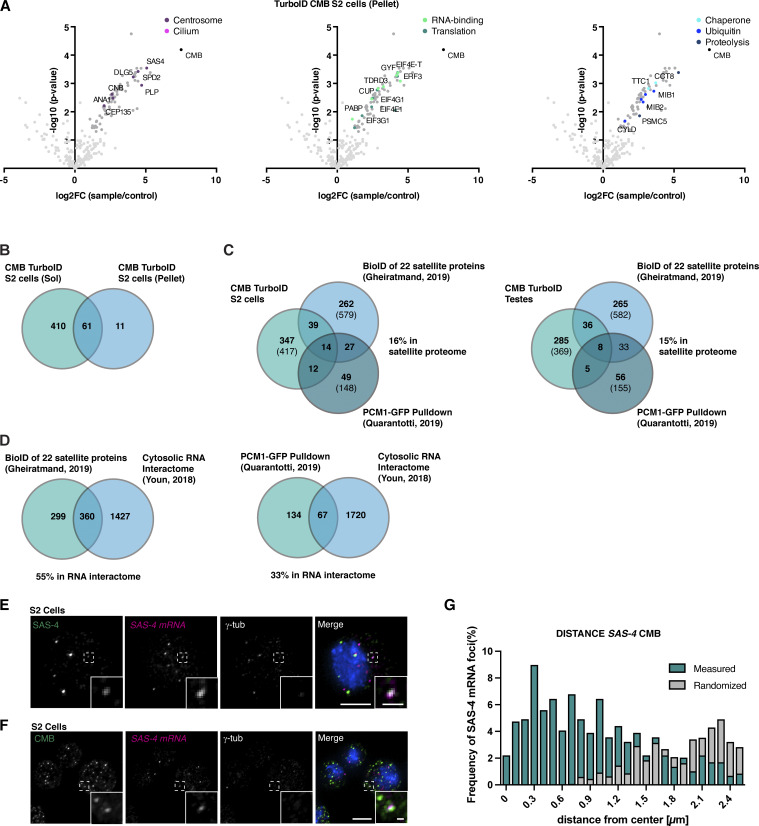
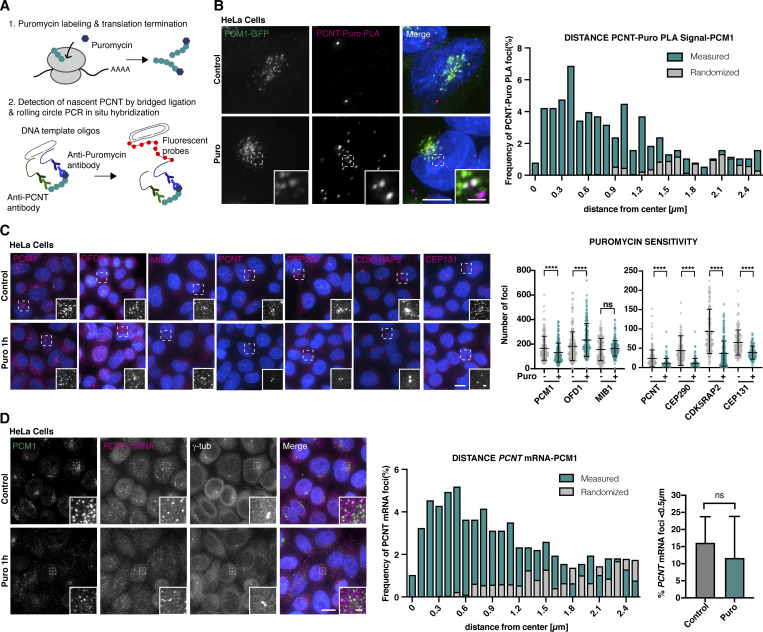
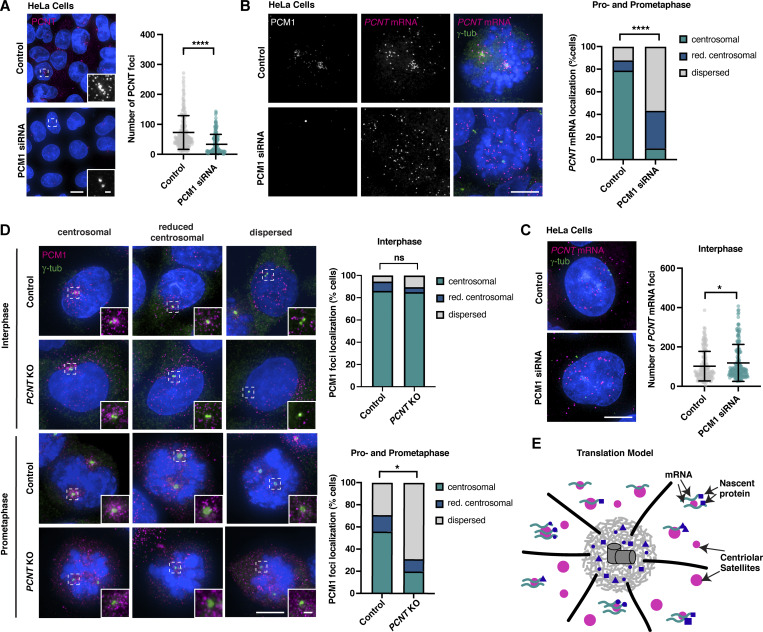
Centriolar satellites are cytoplasmic particles found in the vicinity of centrosomes and cilia whose specific functional contribution has long been unclear. Here, we identify Combover as the Drosophila ortholog of the main scaffolding component of satellites, PCM1. Like PCM1, Combover localizes to cytoplasmic foci containing centrosomal proteins and its depletion or mutation results in centrosomal and ciliary phenotypes. Strikingly, however, the concentration of satellites near centrosomes and cilia is not a conserved feature, nor do Combover foci display directed movement. Proximity interaction analysis revealed not only centrosomal and ciliary proteins, but also RNA-binding proteins and proteins involved in quality control. Further work in Drosophila and vertebrate cells found satellites to be associated with centrosomal and ciliary mRNAs, as well as evidence for protein synthesis occurring directly at satellites. Given that PCM1 depletion does not affect overall protein levels, we propose that satellites instead promote the coordinate synthesis of centrosomal and ciliary proteins, thereby facilitating the formation of protein complexes.


Conflict of interest statement

Disclosures: The authors declare no competing interests exist.

Figures

Figure 1.
Figure 1.
Satellite scaffolding component PCM1 is conserved beyond vertebrates. (A) Schematic representation of the transport model of centriolar satellite (magenta) function as mediators of dynein-dependent recruitment of centrosomal and ciliary client proteins (blue) for centrosome/cilium biogenesis. (B) Reciprocal BLAST analysis reveals the presence of PCM1 orthologs across opisthokonts, correlating with the reported presence of centriole-organized centrosomes and cilia (Azimzadeh, 2014; Grell and Benwitz, 1981). (C) Multiple sequence alignment of conserved C terminus (part of pfam15717) of selected PCM1 orthologs. Note that Drosophila Combover (CMB) is highly divergent. (D) Overexpression but not RNAi-mediated depletion or mutation of Cmb results in a PCP phenotype, seen by misalignment of bristles in the fly notum. Tissue-specific RNAi was performed using the Pannier-GAL4 driver, with the PCP effector Fritz (Strutt and Warrington, 2008) as a positive control. See also Fig. S1.
Figure S1.
Figure S1.
Identification of Combover as the Drosophila ortholog of PCM1, related to Fig. 1 . (A) Related to Fig. 1 B. Conservation of PCM1, and core centriolar (STIL/ANA2, SASS6/SAS-6, CENPJ/SAS-4, CEP135/BLD10), centrosomal (CDK5RAP2/CNN, CEP192/SPD-2), and ciliary proteins (distal appendage, transition zone, IFT and BBS components, inner and outer dynein arm components, dynein assembly factors, nexins, N-DRC, radial spoke, and central apparatus components [Dobbelaere et al., 2023]) across opisthokonts, based on reciprocal BLAST analysis and hidden Markov model–based searches. Color code is green >2/3 of genes in indicated category present, yellow >1/3 of genes present, magenta <1/3 present. See also Table S1. (B) Results of LC-MS/MS analysis for direct BioID performed on the centriolar structural component SAS-4 in Drosophila S2 cells. Volcano plot of −log10 P values against log2 fold change (sample/control). Significantly enriched proteins (log2 enrichment >1, P <0.05) are indicated in dark gray, with centrosomal proteins highlighted in magenta. CMB was detected as a high-confidence interactor. See also Table S2 A. (C) Related to Fig. 1 D. Further characterization of PCP phenotypes in the fly notum. RNAi of PCP genes such as Inturned results in strong phenotypes, while centrosomal genes (Sas-4 and Plp) show no or weak phenotypes. (D) Quantitation of bristle defects for selected genes. Phenotypes were scored on a scale from 0 (no phenotype) to 4 (strong phenotype), with values shifted slightly to avoid overlap. N = 10 flies per condition.
Figure 2.
Figure 2.
Combover is required for ciliogenesis and proper cell division. (A) Schematic of ciliated tissues used for phenotypic analysis. Primary cilia are found in sensory bristles and chordotonal neurons, while motile cilia/flagella are found in testes (Jana et al., 2016). (B) Climbing assay used to assess defects in mechanosensation. Cmb mutant flies are severely uncoordinated, a phenotype rescued by the expression of CMB-GFP. PCP flies (Fy RNAi) show no detectable phenotype. Error bars are the mean ± SD. N > 10 flies per condition. A Kruskal–Wallis test with Dunn’s multiple comparisons test was performed; **P < 0.01, ****P < 0.0001. (C) Male fertility scored by crossing individual males with WT virgins and assessing the number of offspring. Cmb RNAi/mutant flies are fully male infertile. Error bars are the mean ± SD. N = 3 single males each crossed to four virgin females per condition. A Kruskal–Wallis test with Dunn’s multiple comparisons test was performed; *P < 0.05, **P < 0.01, ***P < 0.001. (D and E) TEM analysis of sperm axonemes in control and Cmb mutant testes. Cross-sectional views reveal missing axonemal doublets and fragmented axonemes (D), as well as overall lower number of cilia (number per cyst <64, E). Error bars are the mean ± SD. N = 38 cysts (control), 38 cysts (Cmb mutant). Student’s t test was used to assess statistical significance; *P < 0.05. (F) Embryonic viability test shows lethality in 50% of offspring of Cmb mutant females with heterozygous mutant males (viability could not be assessed for homozygous males due to their failure to mate and fertilize oocytes). Error bars are the mean ± SD. N = 2 virgin females crossed to one male per condition. Student’s t test was used to assess statistical significance; **P < 0.01. (G) Schematic of Drosophila syncytial-stage embryo showing synchronous nuclear divisions occurring close to the egg surface. (H) Live imaging of control and Cmb mutant early embryos (nuclear cycle 12) expressing the centriole marker ASL-GFP and H2A-RFP. Time shown in min:s. Cmb mutants show lagging chromosomes and increased frequency of nuclear fallout (orange dashed circle). Error bars are the mean ± SD. N = 5 control, 6 Cmb mutant embryos. Student’s t test was used to assess statistical significance; *P < 0.05. (I) Live imaging of control and Cmb mutant early embryos (nuclear cycle 12) expressing the centrosome marker RFP-CNN. Time shown in min:s. Cmb mutants show defects in centrosome separation subsequent to nuclear fallout (orange dashed circle) but not PCM recruitment. CNN centrosome intensity was measured at NEBD in nuclear cycle 12. Dots represent average intensity of all centrosomes in a single embryo. Error bars are the mean ± SD. N = 8 control, 6 Cmb mutant embryos. A Mann–Whitney test used to assess statistical significance. Scale bars, 100 nm (D), 500 nm (E), 10 µm (H and I). See also Fig. S2. NEBD, nuclear envelope breakdown; TEM, transmission electron microscopy.
Figure S2.
Figure S2.
Further characterization of ciliary phenotypes in Cmb mutants, related to Fig. 2 . (A) Appearance of Cmb mutant flies, as well as Cmb mutants rescued by the expression of a GFP-CMB transgene. Cmb mutants display abnormal wing posture, a phenotype associated with defective mechanosensation. (B) Fertility test performed on Cmb mutant males and females, Cmb mutants rescued by the expression of a GFP-CMB transgene or maintained over a balancer (Tm6), and Cmb mutants placed over a deficiency that covers the Cmb locus (Def 25, 26). Cmb mutant males but not females exhibit fully penetrant sterility, a defect rescued by the expression of the GFP transgene. Placing the mutant over a deficiency does not impact fertility, excluding potential nonallelic effects. Error bars are the mean ± SD. N = 3 single males, each crossed to four virgin females. (C) Schematic and immunofluorescence micrographs of scolopidia in chordotonal organ of the fly. SAS-4 and NompC were used to visualize basal body (green) and ciliary tip (magenta), respectively. Each scolopidium contains two ciliated nerve endings ensheathed by a glial cell, with the ciliary tips attached to the cuticle via a cap cell (Kernan, 2007). No gross ciliary morphological defects are observed in Cmb mutants. N = 63 control scolopidia, 63 Cmb mutant. A statistical test is t test with Welch’s correction. (D) DIC images of scolopidia. Cmb mutants display a larger distance between ciliary dilation and cap cell, indicative of ciliary positioning defects. Error bars are the mean ± SD. N = 32 control, 31 Cmb mutants. Student’s t test with Welch’s correction was used; ***P < 0.001. (E) Cross-sectional views of control and Cmb mutant scolopidia by transmission electron microscopy (TEM) from the distal tips (1) to the ciliary rootlets (6) below the basal body. Position was indicated by numbers in schematic on the left. Cmb mutants show minor structural defects, including broken axonemes and misplaced doublet microtubules (arrows). (F) Left: Analysis of flagellar movement of control and Cmb mutant sperm by high-speed video capture in dark-field microscopy. Sinusoidal motion can be seen in wild type. Arrowheads indicate the position of propagating peaks and troughs in image sequence. Cmb mutant sperm show severely compromised flagellar movement. Right: In contrast to controls, seminal vesicles of Cmb mutant flies are almost devoid of sperm, indicating defective movement of sperm to seminal vesicle. (G) Schematic and immunofluorescence images of Drosophila spermatogenesis. In Cmb mutants, the early stages of spermatogenesis appear superficially normal; however, in later stages, investment cones involved in individualizing sperm fail to form properly. Scale bars, 1 µm (C and D), 100 nm (E), 100 µm (F), 20 µm (G).
Figure 3.
Figure 3.
Centriolar satellites are conserved in Drosophila but do not concentrate near centrosomes or cilia, nor move in a directed manner. (A) PCM1 concentrates in the vicinity of centrosomes (marked with γ-tubulin) in vertebrate cells. The radial profile of the normalized distribution of PCM1 shows the mean ± SEM. N = 27 centrosomes. (B) CMB localization in Drosophila S2 cells. Unlike PCM1, CMB does not concentrate near the centrosome (marked with CNN), but is found throughout the cytoplasm. The radial profile shows the mean ± SEM. N = 39 centrosomes. (C) Top: Schematics showing cells and tissues used to examine CMB localization/dynamics. Bottom: Immunofluorescence micrographs show CMB localizing to cytoplasmic foci in all tissues examined. SAS-4/CNN was used to visualize centrioles/centrosomes. (D) Time-lapse recording of Drosophila S2 cell expressing CMB-GFP. Time is shown in min:s. CMB particles display little movement. (E) Corresponding trajectory analysis showing the position of individual particles over time. (F) Histogram plotting frequency of instantaneous speed (µm/s) of all particles tracked in eight different cells. N = 140 particles. The majority of particles moves at slow speeds (0.2–0.3 µm/s), consistent with diffusion. (G) MSD as a function of time. Trajectories with at least 11 frames from eight cells were analyzed. All tracks analyzed are shown in gray (N = 99 tracks). Weighted MSD (mean ± SD) of all diffusive particles follows a linear fit (turquoise line), reflecting the overall Brownian diffusion. (H) Stacked column plot (mean ± SEM) showing all tracks analyzed in G assigned to different categories as described in Materials and methods. The majority of tracks analyzed display the Brownian diffusion (54.2% ±3.9) or subdiffusion/anomalous diffusion (41.1% ±4.3). Only a minor fraction displays directed/active (1.8% ±0.7) or confined movement (2.9 % ±1.1). (I) Centriolar (SAS-4) and centrosomal (CNN) proteins colocalize with CMB on cytoplasmic foci, although immunofluorescence signal is weak compared with that at centrosomes (marked with γ-tubulin). Colocalization of CMB with SAS-4 and CNN was assessed by Pearson’s correlation coefficient. Randomized control has one of the channels rotated 90°. Centrosomes were excluded from analysis. Error bars are the mean ± SD. N = 50 cells per condition. A Mann–Whitney test was used to test statistical significance; ****P < 0.0001. Scale bars, 10 µm (A–C), 5 µm (D and I), 1 µm (A–C, insets, I, magnified views). See also Fig. S3. MSD, mean squared displacement.
Figure S3.
Figure S3.
Further analysis of CMB localization, related to Fig. 3 . (A) Immunofluorescence micrograph showing CMB localizing to centrosomes in a subset of cells in Drosophila S2 cells. Quantitation of CMB localization reveals centrosome localization in ∼20% of cells. Pearson’s correlation coefficient analysis of centrosomal signal shows significant overlap between SAS-4 and CMB compared with randomized controls (single channel rotated by 90° with centrosome positioned in the upper right quadrant of the square analyzed). Error bars are the mean ± SD. N = 50 cells. Student’s t test was used; ****P < 0.0001. (B) Specificity of the polyclonal antibody raised against CMB confirmed by the absence of immunofluorescence signal in Cmb mutant testes. (C) Related to Fig. 3 I. Immunofluorescence micrographs showing some (CP110, ANA1, ANA2) but not all (SPD-2, γ-tubulin) centrosomal proteins colocalizing with CMB on cytoplasmic foci. (D) Pearson’s correlation coefficient analysis of cytoplasmic protein colocalization with CMB assessed on images as in C. Error bars are the mean ± SD. N = 50 cells per condition. A Mann–Whitney test was used to test statistical significance compared with randomized controls (single channel rotated 90°); ***P < 0.001, **P < 0.01. (E) Immunofluorescence micrographs showing SAS-4 colocalizing with Combover in the cytoplasm of primary spermatocytes in the testes. Colocalization was quantified by Pearson’s correlation coefficient analysis. Error bars are the mean ± SD. N = 12 animals. A t test was used to assess statistical significance of colocalization compared with randomized controls (single channel rotated 90°); ****P < 0.0001. (F) CMB-GFP colocalizes with PCM1 when expressed in HeLa cells. Colocalization was quantified by Pearson’s correlation coefficient analysis. Error bars are the mean ± SD. N = 193 cells. A t test was used to assess statistical significance of colocalization compared with randomized controls (single channel rotated 90°); ****P < 0.0001. (G) CMB-GFP expression fails to restore PCNT cytoplasmic centriolar satellite signal following depletion of endogenous PCM1 in HeLa cells. N = 40 cells analyzed per condition. Mean ± SD are displayed. A Mann–Whitney test was used to assess statistical significance; ****P < 0.0001, NS, not significant. Scale bars, 5 µm (A, C, F, and G), 10 µm (B), 1 µm (E, A, C, and F, insets).
Figure 4.
Figure 4.
CMB is associated with protein synthesis in Drosophila. (A and B) Direct TurboID of CMB in S2 cells (cytosolic fraction, A) and indirect, GFP nanobody–targeted TurboID in fly testes (B) identify centrosomal (magenta) and ciliary proteins (pink), RNA-binding proteins (light green), and proteins involved in translation (dark green), chaperone-mediated protein folding (light blue), ubiquitination (blue), and proteolysis (dark blue). Volcano plots of −log10 P values against log2 fold change (sample/control). Significantly enriched proteins (log2 enrichment >1, P <0.05) are indicated in dark gray, with proteins of the above functional categories highlighted in color. See also Table S2 B and D. (C) Venn diagrams showing the overlap between CMB S2 cell and testis TurboID interactomes and human centrosome/cilium proteome defined by Gupta et al. (2015). Comparison of those proteins conserved between human and flies. Numbers in parentheses are total number in each dataset. See also Table S2 E. (D) Venn diagrams showing an overlap between CMB S2 cell and testis TurboID interactomes and cytosolic RNA interactomes defined by Youn et al. (2018). Comparison of those proteins conserved between human and flies. Numbers in parentheses are total number in each dataset. See also Table S2 E. (E) GO enrichment analysis performed on human orthologs of the CMB TurboID testis dataset. The top eight terms and their fold enrichments are shown for the GO categories cellular component and biological process. (F) Schematic of eukaryotic translation initiation (Jackson et al., 2010). The 43S-preinitiation complex is recruited to the mRNA by the EIF4F complex through interaction of EIF4G with eIF3. Components identified in the CMB interactome are highlighted in bold. (G) Schematic of the puromycin labeling assay. Puromycin mimics tyrosyl-tRNAs and binds the ribosomal acceptor site, blocking translation. Nascent peptide chains labeled with puromycin (puromycylated) are released into the cytoplasm and can be detected using antibodies against puromycin. (H) Puromycin labeling performed in Drosophila S2 cells. Puromycin labels CMB foci in the cytoplasm after brief incubation with puromycin. No signal is detected in control cells or cells pretreated with cycloheximide before the addition of puromycin. Colocalization of CMB and puromycin label was quantified by Pearson’s correlation coefficient analysis. To exclude random colocalization, distribution was compared with randomized controls (see Materials and methods). Error bars are the mean ± SD. N = 70 cells per condition. A Kruskal–Wallis test followed by Dunn’s multiple comparisons test was used to assess statistical significance; ****P < 0.0001. Scale bars, 5 µm (H), 1 µm (H, insets). See also Fig. S4.
Figure S4.
Figure S4.
Further analysis of CMB proximity interactome, related to Fig. 4 . (A) Results of direct TurboID performed on CMB S2 cells (detergent-insoluble cytoskeletal fraction). LC-MS/MS analysis reveals centrosomal proteins (magenta), RNA-binding proteins (light green), and proteins involved in translation (dark green), chaperone-mediated protein folding (light blue), ubiquitination (blue), and proteolysis (dark blue). Volcano plots of −log10 P values against log2 fold change (sample/control). Significantly enriched proteins (log2 enrichment >1, P <0.05) are indicated in dark gray, with proteins of the above functional categories highlighted in color. See also Table S2 C. (B) Venn diagram revealing a significant overlap between CMB proximity interactome obtained from detergent-soluble (cytoplasmic) and detergent-insoluble (cytoskeletal) fractions of S2 cell extracts. See also Table S2 E. (C) Comparison of CMB S2 cell and testis TurboID interactomes with previous published datasets for centriolar satellites: the BioID of 22 satellite proteins mapped by Gheiratmand et al. (2019) and the PCM1-GFP pulldown performed by Quarantotti et al. (2019). Comparison of those proteins conserved between humans and flies. Numbers in parentheses are total number in each dataset. See also Table S2 E. (D) Comparison of BioID of 22 satellite proteins mapped by Gheiratmand et al. (2019) and PCM1-GFP pulldown performed by Quarantotti et al. (2019) with cytosolic RNA interactome defined by Youn et al. (2018). See also Table S2 F. (E) Single-molecule fluorescence hybridization (smFISH) combined with immunofluorescence microscopy shows Sas-4 mRNA colocalizing with nascent SAS-4 protein in the cytoplasm of S2 cells. (F and G) smFISH combined with immunofluorescence microscopy in S2 cells. Immunofluorescence micrographs (F) and corresponding quantitation (G). Sas-4 mRNA localizes in the vicinity of CMB foci. To exclude random colocalization/proximity, distribution was compared with randomized controls. N = 109 cells. Scale bars, 5 µm (E), 10 µm (F), 1 µm (E and F, insets).
Figure 5.
Figure 5.
Centriolar satellites are sites of translation of centrosomal and ciliary proteins in vertebrate cells. (A) Schematic of the Puro-PLA. Puro-PLA combines puromycin labeling with proximity-dependent ligation to make labeling specific for a particular protein of interest, here PCNT. (B) Puro-PLA reveals nascent PCNT in proximity to centriolar satellites visualized using PCM1-GFP. To exclude random colocalization/proximity, distribution was compared with randomized controls (see Materials and methods). N = 109 cells. (C) Immunofluorescence micrographs and quantitation of centriolar satellite protein signal in control and puromycin-treated HeLa cells. Centrosomal and ciliary proteins PCNT, CEP290, CDK5RAP2, and CEP131 are significantly depleted of their cytoplasmic localization upon puromycin treatment, whereas their centrosome localization persists (centrosomes identified using anti-γ-tubulin countermarker, not shown), suggesting the former represents newly synthesized protein. In contrast, foci of PCM1, OFD1, and MIB1 remain, although now dispersed throughout the cytoplasm. >100 cells were analyzed per condition. Mean ± SD are displayed. A Mann–Whitney test was used to assess statistical significance; ****P < 0.0001. (D) smFISH combined with immunofluorescence microscopy in control and puromycin-treated HeLa cells. PCNT mRNA localizes in the vicinity of PCM1 independently of ongoing translation. To exclude random colocalization/proximity, distribution was compared with randomized controls (see Materials and methods). Error bars are the mean ± SD. N = 77 cells (control), 102 cells (puromycin). Scale bars, 5 µm (B and D), 10 µm (C), 1 µm (insets). See also Fig. S5.
Figure S5.
Figure S5.
Further evidence for centriolar satellites as sites of translation in vertebrate cells, related to Fig. 5 . (A) Immunofluorescence micrographs of the centriolar satellite protein signal in control and cycloheximide-treated HeLa cells. The satellite client PCNT is significantly depleted of its cytoplasmic localization upon puromycin treatment, whereas its centrosome localization persists. In contrast, PCM1 signal remains, although it is now dispersed throughout the cytoplasm. (B) Immunofluorescence micrographs and quantitation of PCM1 and OFD1 distribution by Pearson’s correlation coefficient analysis in control and puromycin-treated cells from Fig. 5 C. PCM1 and OFD1 colocalize independent of translation. N = 125 cells (control), 147 cells (puromycin treatment). Mean ± SD are indicated (Student’s t test; *P < 0.05). (C) SmFISH combined with immunofluorescence microscopy shows PCNT mRNA colocalizing with the nascent PCNT protein in the cytoplasm. (D) Specificity of PCNT mRNA FISH and protein immunofluorescence signal confirmed by the absence of signal in PCNT KO cells. (E) Single-molecule fluorescence hybridization (smFISH) combined with immunofluorescence microscopy in HeLa cells. CEP290 mRNA localizes in the vicinity of PCM1. To exclude random colocalization/proximity, distribution was compared with randomized controls. N = 78 cells. (F) Single-molecule inexpensive fluorescence hybridization (smiFISH) combined with immunofluorescence microscopy in HeLa cells. Unlike PCNT and CEP290, RANBP10 mRNA does not localize proximal to PCM1. Distribution compared with randomized controls. N = 87 cells. (G) Immunofluorescence micrographs and quantitation of centriolar satellite signal in control and PCM1 siRNA–treated cells. Depletion of PCM1 largely eliminates cytoplasmic foci of OFD1, CEP290, CEP131, CDK5RAP2, while centrosomal signal remains. MIB1 signal is largely unaffected, although foci are now dispersed throughout the cytoplasm. Mean ± SD are indicated. N > 100 cells each condition. Statistical test to compare control and PCM1 depletions is t test with Welch’s correction (MIB1), and nonparametric Mann–Whitney test (others); ****P < 0.0001. Scale bars, 10 µm (A, B, and D–G), 5 µm (C), 1 µm (insets).
Figure 6.
Figure 6.
Centriolar satellite distribution reflects cotranslational transport of certain centrosomal/ciliary clients. (A) Immunofluorescence micrographs and quantification of cytoplasmic PCNT signal in control and PCM1 siRNA-treated cells. Depletion of PCM1 leads to a significant decrease in the number of PCNT foci. Error bars are the mean ± SD. N = 211 control cells and 171 PCM1 siRNA cells. Data were analyzed using the Mann–Whitney test; ****P < 0.0001. (B and C) smFISH combined with immunofluorescence microscopy in control cells and cells depleted of PCM1. PCM1 depletion impairs PCNT mRNA localization around the centrosome in prometaphase (B), reflecting a loss of cotranslational targeting. However, the total number of PCNT mRNA foci assessed in interphase remains almost unchanged (C). Error bars in (C) are the mean ± SD. N = 33 prometaphase-stage and 189 interphase cells (control), 30 and 196 cells (PCM1 siRNA). A Mann–Whitney test was used to assess statistical significance; ****P < 0.0001, *P < 0.05. (D) Immunofluorescence micrographs of PCM1 in control and PCNT KO cells. Loss of PCNT does not impact PCM1 localization in interphase but compromises its concentration near centrosomes in pro- and prometaphase. N = 154 prometaphase and 348 interphase cells (control), 161 and 355 cells (PCNT KO). Localization groups were compared using the Mann–Whitney test, *P < 0.05. (E) Revised model of centriolar satellite function: centriolar satellites are sites of translation of centrosomal and ciliary proteins. Their concentration close to centrosomes in vertebrates is a byproduct of cotranslational targeting of certain centrosomal/ciliary clients including PCNT. Scale bars, 10 µm (A), 5 µm (B–D), 1 µm (insets).

Similar articles

Cited by

References

    1. Altschul, S.F., Madden T.L., Schäffer A.A., Zhang J., Zhang Z., Miller W., and Lipman D.J.. 1997. Gapped BLAST and PSI-BLAST: A new generation of protein database search programs. Nucleic Acids Res. 25:3389–3402. 10.1093/nar/25.17.3389 - DOI - PMC - PubMed
    1. Alvarez-Rodrigo, I., Steinacker T.L., Saurya S., Conduit P.T., Baumbach J., Novak Z.A., Aydogan M.G., Wainman A., and Raff J.W.. 2019. Evidence that a positive feedback loop drives centrosome maturation in fly embryos. Elife. 8:e50130. 10.7554/eLife.50130 - DOI - PMC - PubMed
    1. Azimzadeh, J. 2014. Exploring the evolutionary history of centrosomes. Philos. Trans. R. Soc. Lond. B Biol. Sci. 369:20130453. 10.1098/rstb.2013.0453 - DOI - PMC - PubMed
    1. Azimzadeh, J., Wong M.L., Downhour D.M., Sánchez Alvarado A., and Marshall W.F.. 2012. Centrosome loss in the evolution of planarians. Science. 335:461–463. 10.1126/science.1214457 - DOI - PMC - PubMed
    1. Baron, A.T., Suman V.J., Nemeth E., and Salisbury J.L.. 1994. The pericentriolar lattice of PtK2 cells exhibits temperature and calcium-modulated behavior. J. Cell Sci. 107:2993–3003. 10.1242/jcs.107.11.2993 - DOI - PubMed

LinkOut - more resources