. 2025 May 21;16(1):842.
doi: 10.1007/s12672-025-02659-0.

Molecular mechanisms of arecoline-induced oral cancer: a network toxicology and molecular docking techniques integrated analysis

Affiliations

Molecular mechanisms of arecoline-induced oral cancer: a network toxicology and molecular docking techniques integrated analysis

Linghan Leng et al. Discov Oncol. .

Abstract

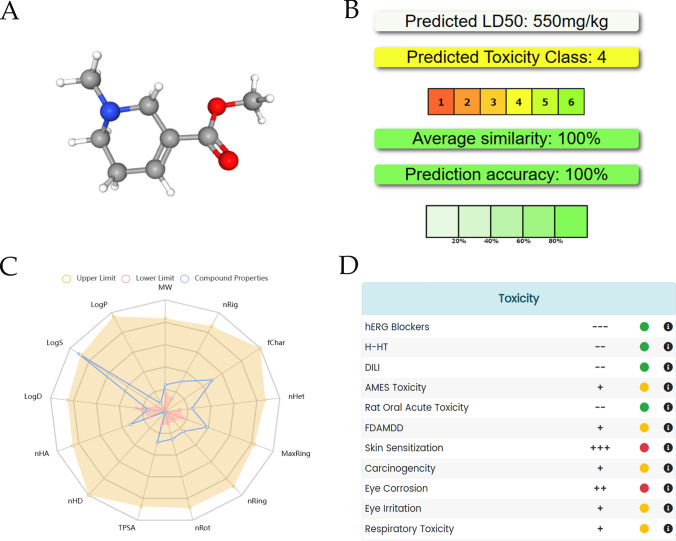
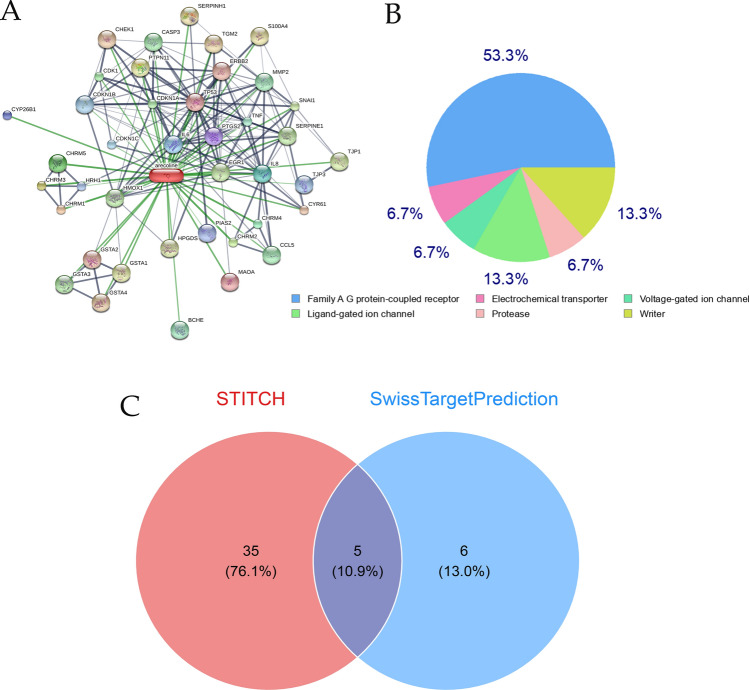
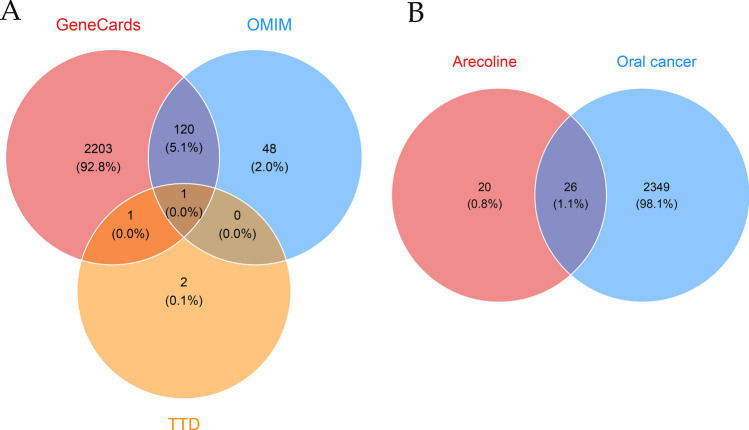
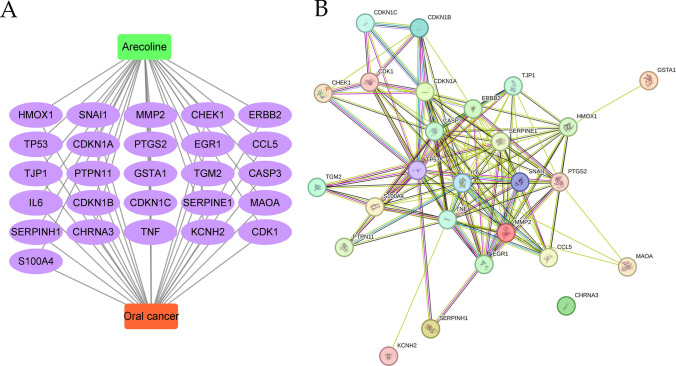
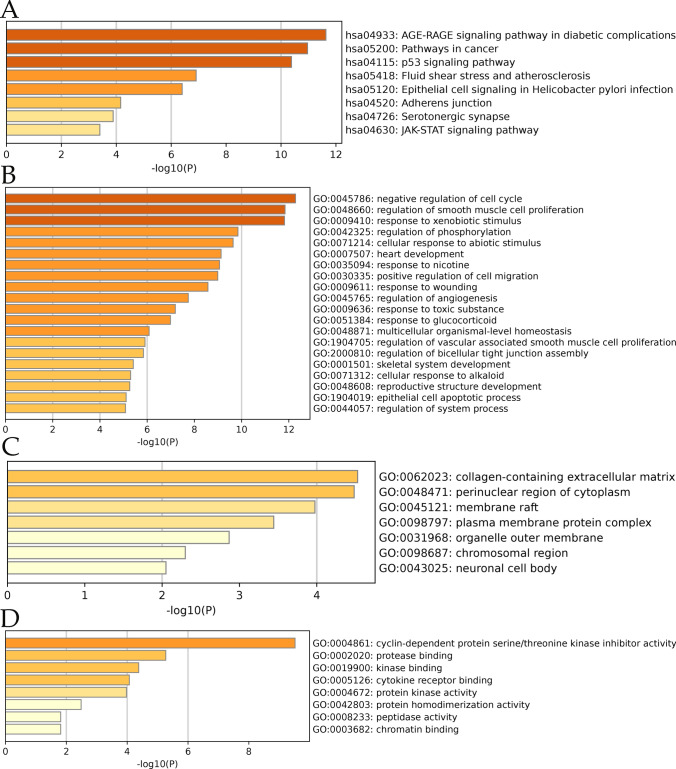
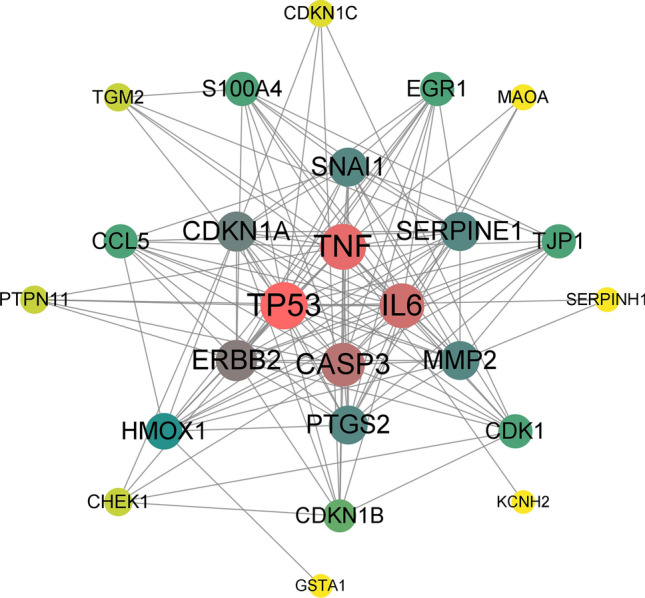
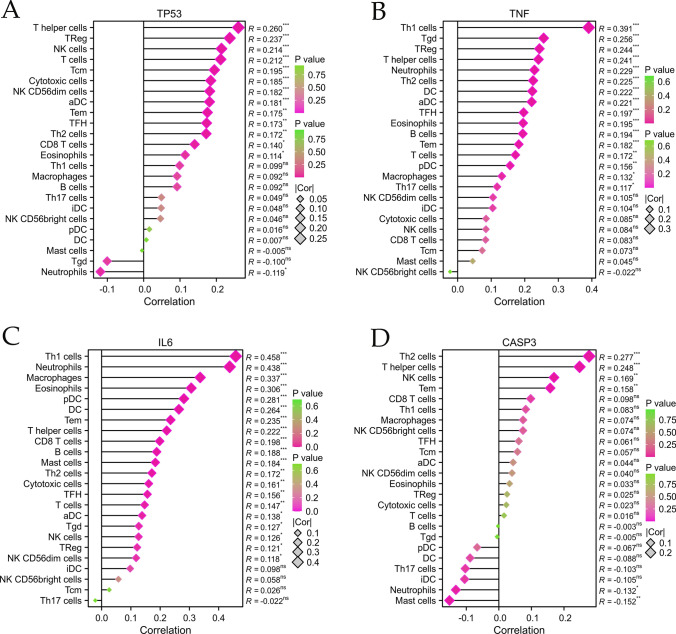
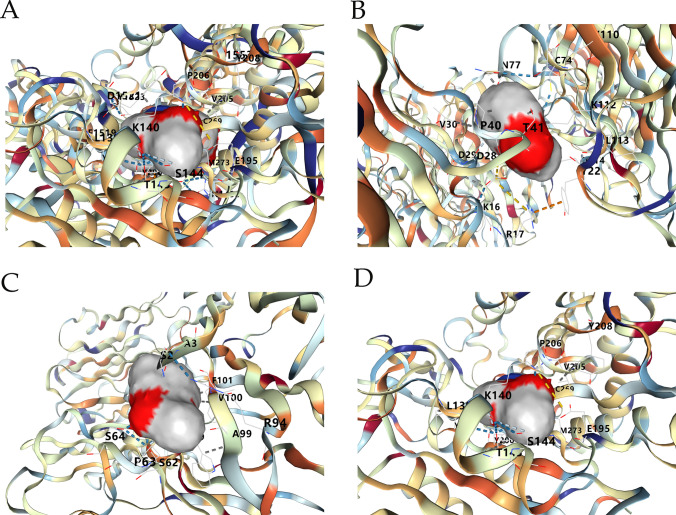
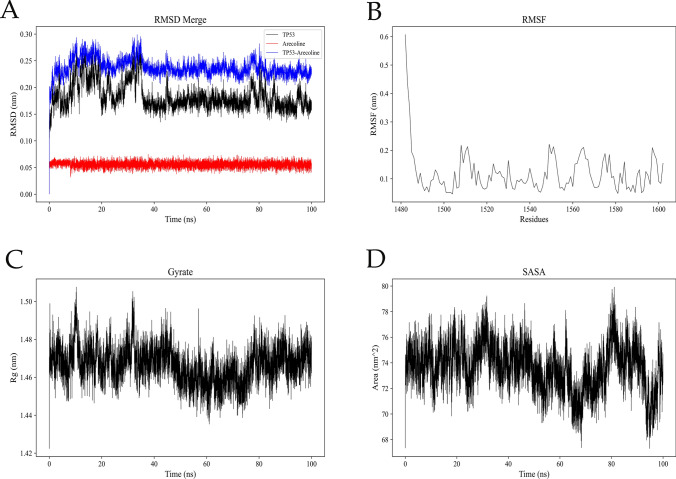
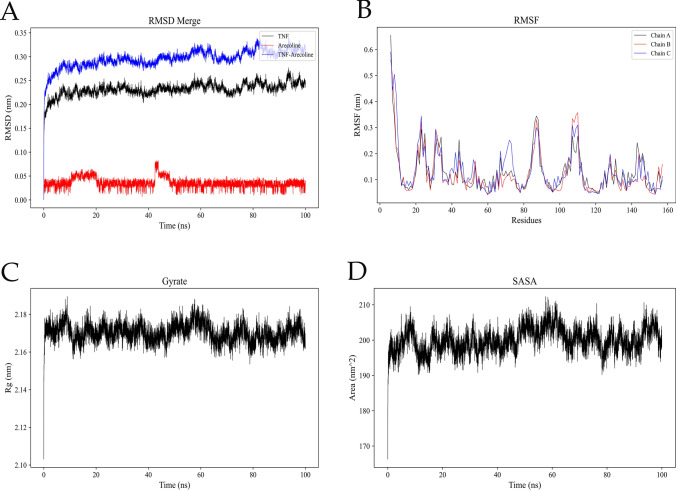
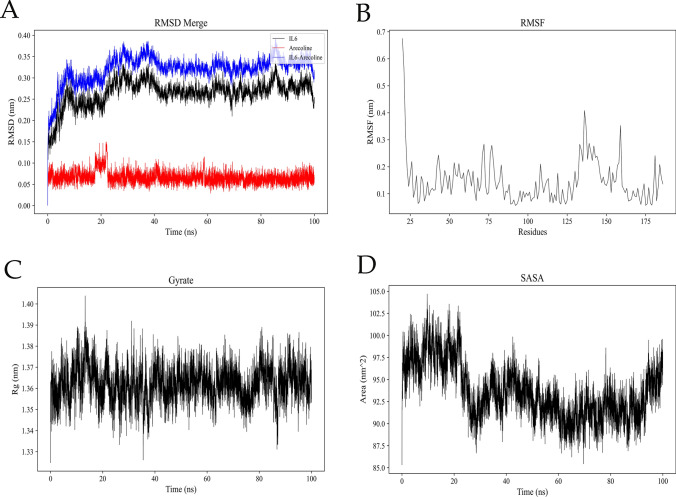
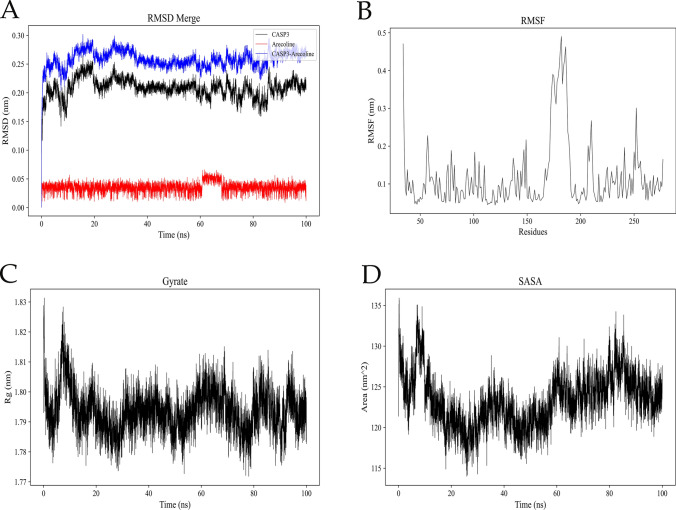
The IARC classified betel nut as Group 1 carcinogen (2004) and arecoline as Group 2B carcinogen (2020), with approximately one-third of global oral cancer cases attributed to smokeless tobacco or betel nut consumption. While current evidence establishes an association between arecoline and oral cancer, the underlying molecular mechanisms remain complex and poorly elucidated. This study employs network toxicology integrated with molecular docking techniques to systematically investigate the potential molecular pathogenesis of arecoline-induced oral cancer, aiming to provide novel insights for targeted therapeutic strategies. The SMILES structure of arecoline was retrieved from PubChem for foundational data preparation. Toxicity profiling was conducted using ProTox-3.0 and ADMETlab databases. Potential targets of arecoline were identified via STITCH and SwissTargetPrediction. Oral cancer-related targets were collated from GeneCards, OMIM, and TTD. Intersection analysis between arecoline targets and oral cancer-associated targets was performed to identify shared targets, which were further utilized to construct compound-target regulatory network and subjected to PPI, GO, and KEGG analyses. Core targets driving oral cancer were screened using the cytoHubba plugin. Then, the correlation between core targets and immune cell infiltration in oral cancer was explored, and molecular docking validated the binding affinity of arecoline to core targets. Finally, Gromacs 2022.3 software was used to simulate the molecular dynamics of the complexes obtained by molecular docking for 100 ns. Using the STITCH and SwissTargetPrediction databases, a total of 46 potential targets of arecoline were identified. Concurrently, 2,375 oral cancer-related targets were retrieved from GeneCards, OMIM, and TTD. Intersection analysis of these two target sets yielded 26 overlapping targets. PPI analysis revealed that TP53, IL6, SNAI1, and CASP3 occupied central positions in the network, exhibiting extensive interactions with other target proteins. Enrichment analysis comprehensively elucidated the molecular functions, biological processes, cellular components, and associated pathways of these overlapping targets. Further screening using Cytoscape software identified four core targets: TP53, TNF, IL6, and CASP3. Immune infiltration analysis indicated that the expression levels of TP53, TNF, IL6, and CASP3 in oral cancer tissues were positively correlated with the infiltration levels of immune cells, including CD8 + T cells, Th1 cells, NK cells, and macrophages. Molecular docking experiments demonstrated strong binding activities between arecoline and TP53, IL6, and CASP3, while TNF also exhibited moderate binding affinity. Dynamic simulation further verified the stable binding of arecoline to TP53, TNF, IL6 and CASP3. Arecoline may induce oral cancer by acting on core targets including TP53, TNF, IL6, and CASP3, which interfere with normal cellular growth regulation, inflammatory responses, and apoptotic mechanisms. Therapeutic strategies targeting TP53, TNF, IL6, and CASP3 may represent novel research directions for clinical diagnosis and treatment of oral cancer.

Keywords: Arecoline; CASP3; IL6; Network toxicology; Oral cancer; TNF; TP53.


Conflict of interest statement

Declarations. Ethics approval and consent to participate: Not applicable. Consent for publication: Not applicable. Competing interests: The authors declare no competing interests.

Figures

Fig. 1
Fig. 1
Molecular structure and toxicity analysis of arecoline. A 3D structure of arecoline. B Toxicity characteristics of arecoline predicted by ProTox. C, D Analysis of 13 physicochemical properties and toxicity profiles of arecoline using ADMETlab
Fig. 2
Fig. 2
Screening of arecoline targets. A 40 arecoline targets identified from the STITCH database. B 11 arecoline targets predicted by the SwissTargetPrediction database. C Merging targets from STITCH and SwissTargetPrediction yielded 46 unique targets
Fig. 3
Fig. 3
Acquisition of oral cancer-related targets and intersection targets. A Union operation of oral cancer-related targets retrieved from GeneCards, OMIM, and TTD databases generated 2,375 targets. B Intersection analysis between 46 arecoline targets and 2,375 oral cancer-related targets identified 26 overlapping targets
Fig. 4
Fig. 4
Compound regulatory network and PPI analysis. A Network diagram illustrating the molecular mechanism by which arecoline acts on intersection targets to drive oral cancer. B TP53, IL6, SNAI1, and CASP3 occupy central positions in the PPI network, exhibiting extensive interactions with other proteins
Fig. 5
Fig. 5
KEGG and GO enrichment analyses. A Key signaling pathways enriched for intersection targets. B Biological processes involving intersection targets. C Cellular components associated with intersection targets. D Molecular functions of intersection targets
Fig. 6
Fig. 6
Screening of core targets. The top four core targets ranked by degree values—TP53, TNF, IL6, and CASP3—are central hubs in the network, densely connected to other proteins
Fig. 7
Fig. 7
Immune infiltration analysis. AD The relationships between the expression levels of TP53, TNF, IL6, and CASP3 with immune cell infiltration in oral cancer. As shown in the figures, the expressions of all four targets exhibit positive correlations with the infiltration levels of immune cells such as CD8 + T cells, Th1 cells, NK cells, and macrophages
Fig. 8
Fig. 8
Molecular docking. AD Ribbon models showing the binding conformations of arecoline with TP53, TNF, IL6, and CASP3
Fig. 9
Fig. 9
TP53-Arecoline MD simulations. A The RMSD Merge plot shows the stability of the entire complex during the simulation, with time (0–100 ns) on the horizontal axis and RMSD values (unit: nm) on the vertical axis. The RMSD value of the TP53-Arecoline complex increased rapidly at the beginning of the simulation, then fluctuated between 0.15 and 0.25 nm, and finally stabilized at about 0.22 nm. B the RMSF diagram shows the fluctuation of each residue of the protein, the horizontal axis is the residue number (1480–1600), and the vertical axis is the RMSF value (unit: nm). Most of the RMSF values ranged from 0.1 to 0.2 nm, but the protein start position fluctuated greatly, reaching a maximum of 0.5 nm. C the Gyrate plot reflects how compact the protein is, with time (0–100 ns) on the horizontal axis and radius of gyration (Rg, unit: nm) on the vertical axis. The Rg value increased slightly from 1.42 to 1.48 nm during the simulation, and then fluctuated around 1.46 nm. D SASA plot showing the solvent accessible surface area of a protein over time. The horizontal axis is the time (0–100 ns) and the vertical axis is the SASA value (unit: nm2). The SASA value was 72 nm2 at the beginning of the simulation, then decreased to 68 nm2 and fluctuated around 74 nm2
Fig. 10
Fig. 10
TNF-Arecoline MD simulations. A The TNF-Arecoline complex underwent a large conformational adjustment at the beginning of the simulation, but tended to stabilize after that, and the RMSD fluctuation was small, indicating that the overall structure of the composite was relatively stable in the later stage of the simulation. B Some regions of the TNF trimer (corresponding to the RMSF peak) exhibit higher flexibility, which may be related to functionally related conformational changes or binding sites. The fluctuation patterns of Chain A, B, and C are similar, indicating that the dynamic behavior of the three chains is relatively consistent. C the Rg of the complex changed little during the simulation, indicating that the molecule as a whole maintained a relatively compact conformation and had high structural stability. D the SASA value fluctuates to a certain extent during the simulation process, indicating that the composite may have undergone slight conformational adjustment during the simulation process, resulting in the change of the exposed surface area, but the overall change amplitude is not large, and the structure is relatively stable
Fig. 11
Fig. 11
IL6-Arecoline MD simulations. A The IL6-Arecoline complex underwent structural adjustment at the initial stage (0–10 ns) and then entered a steady state, indicating that the structure of the system was relatively stable in the later stage of simulation. B some specific regions of the molecule (around residues 75 and 140) have high flexibility and may correspond to functional regions or loosely structured sites. C the fluctuation of the Rg is small, indicating that the overall shape of the molecule remains relatively compact and stable during the simulation process. D the fluctuation of SASA value indicates that the contact area between the molecule and the solvent has changed to a certain extent during the simulation process, but the overall trend is relatively stable, indicating that the exposure degree of the molecular surface is relatively stable
Fig. 12
Fig. 12
CASP3-Arecoline simulations. A the RMSD value of the CASP3-Arecoline complex fluctuated between 0.25 and 0.30 nm, and the average RMSD value was roughly around 0.27 nm. B the RMSF values of most residues were below 0.1 nm, indicating that these regions were relatively stable. C the Rg value fluctuated between 1.77 and 1.80 nm, indicating that the complex maintained a relatively stable and compact structure during the simulation. D at around 10 ns, the SASA value drops to about 115 nm2 and then fluctuates between 115 and 120 nm2, indicating that the surface area of the complex exposed to solvent stabilizes late in the simulation

Similar articles

References

    1. Kozlakidis Z, Cheong I, Wang H. Betel nut and arecoline: past, present, and future trends. Innov Digit Health Diagn Biomarkers. 2022;2022(2):64–72.
    1. Liu YJ, Peng W, Hu MB, Xu M, Wu CJ. The pharmacology, toxicology and potential applications of arecoline: a review. Pharm Biol. 2016;54(11):2753–60. - PubMed
    1. Myers AL. Metabolism of the areca alkaloids - toxic and psychoactive constituents of the areca (betel) nut. Drug Metab Rev. 2022;54(4):343–60. - PubMed
    1. Kuo TM, Luo SY, Chiang SL, Yeh KT, Hsu HT, Wu CT, Lu CY, Tsai MH, Chang JG, Ko YC. Fibrotic effects of arecoline N-oxide in oral potentially malignant disorders. J Agric Food Chem. 2015;63(24):5787–94. - PubMed
    1. Venkatesh D, Puranik RS, Vanaki SS, Puranik SR. Study of salivary arecoline in areca nut chewers. J Oral Maxillofac Pathol JOMFP. 2018;22(3):446. - PMC - PubMed

LinkOut - more resources