. 2025 May 30;198(2):kiaf209.
doi: 10.1093/plphys/kiaf209.

Enhancing photosynthesis under salt stress via directed evolution in cyanobacteria

Affiliations

Enhancing photosynthesis under salt stress via directed evolution in cyanobacteria

Zhenxiong Jiang et al. Plant Physiol. .

Abstract

A key aspect of enhancing photosynthesis is improving the kinetics of photochemical quenching recovery following environmental perturbation or stress. Salt stress exacerbates high light stress in cyanobacteria and leads to severe yield losses in crop plants. Genetic traits that confer salt tolerance without compromising photosynthetic performance are essential for improving photosynthesis under these conditions. Here, we applied accelerated evolution in Synechococcus elongatus PCC 7942 by conditionally suppressing its methyl-directed mismatch repair system to obtain beneficial genetic traits for enhanced photosynthesis under salt stress. We screened over 10,000 mutants and isolated 8 strains with increased biomass or sucrose productivity under salt stress. Genome sequencing revealed an average of 8 to 20 single nucleotide polymorphisms or indels per genome. Notably, mutations in the photosystem II (PSII) reaction center D1-encoding gene, resulting in the amino acid changes L353F, I358N, and H359N at the carboxyl terminus of the precursor-D1 (pD1) protein, improved photosynthesis under salt and combined salt and light stress by potentially accelerating D1 maturation during PSII repair. Phylogenetic analysis of pD1 across cyanobacteria and red algae highlights the broad relevance of these adaptive genetic traits, underscoring the importance of leveraging evolutionary insights to improve photosynthesis under stress or fluctuating environments.


Conflict of interest statement

Conflict of interest statement. X.W. and Z.J. are listed as inventors in a patent application (application no. 18/400,586) for applying the high-throughput screening method to uncover genetic traits for photosynthesis improvement. X.W. is listed as the inventor for another provisional patent application (application no. 63/655,889) to apply pD1 mutations to improve photosynthesis and plant growth. The remaining authors declare no competing interests.

Figures

Figure 1.
Figure 1.
Construction of a hypermutator strain for directed evolution in S. elongatus. A) Schematic representation of mutagenesis controlled by nitrogen sources. Ammonium represses the nirA promoter by inhibiting its activator, NtcA. B) Spot assay. An equal amount of mSe0 cells (OD730nm = 1) were diluted in triplicate onto BG11 agar plates supplemented exclusively with either nitrate or ammonium. Cyanobacteria in ammonium medium exhibit higher mutation rates, as evidenced by a reduced number of viable cells. C) RT-qPCR of mutS expression. RT-qPCR was conducted on cells cultivated for 24 h in both BG11(NO3) and BG11(NH4+) media. The relative expression of mutS was quantified against the reference gene rnpB. Error bars represent the standard deviation from 3 biological replicates, each with 2 technical replicates. Statistical significance was determined using a 2-tailed Student's t-test. **P < 0.01; ***P < 0.001.
Figure 2.
Figure 2.
Short-term accelerated evolution to obtain potential Pareto-optimal mutants carrying traits for enhanced photosynthesis under salt stress. A) Overview of the high-throughput screening method. The hypermutator strain mSe0 is subject to 3 rounds of mutagenesis in BG11(NH4+) for a period of 4 days each round. Following each round, mutants are isolated on BG11(NO3) agar plates to maintain mutations. Individual mutants are then subjected to high-throughput screening in 96-well microplates to assess both biomass (measured by optical density at 730 nm, OD730nm) and/or sucrose productivity. The final elite strain from each round serves as the starting point for the subsequent round of mutagenesis. The Pareto-optimal traits endow cyanobacterial mutants with diverse adaptive capabilities for biomass accumulation and stress response. In contrast, long-term exposure to extreme stressor tends to select specialists. Each dot represents one mutant, with the gray shadow representing reachable trait space of that mutant. B) High-throughput screening of mSe3 mutants. The top 1% of mutants with the highest standardized residuals of sucrose productivities were selected as the SPM candidates (green), and top 0.25% of mutants with the highest OD730nm were selected as the BAM candidates (light green). A green solid line represents the fitted linear model based on the mSe0 control. The green dashed line represents 2 standard deviations (2σ) from the mean of sucrose productivity. The inset shows FGM candidates (medium green) representing the top 0.25% in population size fold change after a 54 h incubation (24 h normal growth followed by 30 h growth with salt stress). C) Growth phenotype validation in 96-well cell culture plates. Population size fold change was normalized against the mean fold change of wild-type S. elongatus for each batch to minimize the batch effects. The biomass validation with 12 replicates (4 replicates × 3 batches) reached a statistical power of 89.7%. D) Sucrose production validation based on 96-well cell culture plates. The validation with 16 replicates (8 replicates × 2 batches) reached a statistical power of 98%. Boxplots show the median (center line), first and third quartiles (box hinges), and whiskers extending to the most extreme data points within 1.5× the interquartile range from the hinges. Points outside this range are plotted as potential outliers. E) Dry biomass collected from 80 mL of mSe0 and the elite BAM and FGM strains after 24 h incubation at 300 μE·m−2·s−1 and 150 mm NaCl. F) O2 evolution rate of mSe0 and the elite BAM and FGM strains grown at 300 μE·m−2·s−1 and 150 mm NaCl. At least 3 replicates from each strain were collected for unpaired 1-side Student's t-test (*P < 0.05; **P < 0.01; ***P < 0.001; ****P < 0.0001). Error bars show the standard deviation from 3 biological replicates.
Figure 3.
Figure 3.
Mutation in BAM, FGM, and SPM elite mutants. A) Mutations from 8 mSe3 strains and wild-type S. elongatus with AFs above 0.25 are displayed. Mutations are classified into indels and SNPs in either CDS or noncoding DNA regions. Mutations were identified from sequencing of a single 50 mL liquid culture sample per strain. B) Mutations located on CDS are shown, with shading intensity indicating AF. Gray shows sites with either the reference alleles or mutations with AFs of <0.25. C) Interaction of pD1 and CtpA simulated by AlphaFold3 (Abramson et al. 2024). CtpA is depicted using a surface representation, while the carboxyl terminus tail of wild-type pD1 (top row) and mutated pD1 (bottom row) is shown in ribbon format with mutated residues displayed in stick structures. Dark cyan represents hydrophilic surfaces, and dark goldenrod denotes lipophilic surfaces. Nearby amino acid residues around the mutation site are annotated.
Figure 4.
Figure 4.
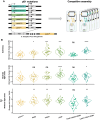
Validation of pD1 mutations under salt and moderate light stresses. A) Schematic representation of pD1 mutations and competitive assembly of D1 during PSII repair. Each color represents a distinct transformant. Either the wild-type (light yellow) or a mutated copy of psbA1 was transformed into wild-type S. elongatus PCC 7942 and integrated at the NSIII of the genome. Black circles indicate omitted genome sequences between NSIII and the native psbA1 locus. The wild-type and mutated D1 proteins (encoded by psbA1) are competitively recruited during PSII assembly. B) Validation of stress resistance. Transformants with mutations L353F, I358N, H359N, and combined L353F + T354A + I358N showed superior biomass accumulation compared to the psbA1WT control under 150 mm NaCl and combined stress of salt (150 mm) and moderate light (110 μE·m−2·s−1) stress. Note that this light intensity leads to chlorosis of cyanobacteria in 96-well culture plates, suggesting moderate light stress. Transformants with L353F and combined L353F + T354A + I358N mutations outperformed the psbA1WT control under 110 μE·m−2·s−1 light stress alone. Statistical analysis: Each experiment included 16 replicates per transformant, with statistical significance determined using an unpaired Student's t-test (*P < 0.05; **P < 0.01; ***P < 0.001; ****P < 0.0001). Boxplots show the median (center line), first and third quartiles (box hinges), and whiskers extending to the most extreme data points within 1.5× the interquartile range from the hinges. Points outside this range are plotted as potential outliers.
Figure 5.
Figure 5.
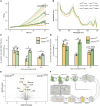
The pD1 L353F mutation confers improved growth and salt stress. A) Growth dynamics of psbA1WT and psbA1L353F transformants were monitored in triplicate in multi-cultivators. psbA1WT is shown in yellow and psbA1L353F in green, with increasing shading intensities corresponding to increasing salt concentrations (0, 150, 300 mm). Data points represent the mean of 3 independent biological replicates, with ribbons indicating one standard deviation from the mean. Statistical analysis was performed using an unpaired Student's t-test based on OD730nm measurements at 30 h. B) Phycobilin content was estimated using full light spectrum scanning. Samples from late-log phase cells under different salt concentrations (0, 150, 300 mm) and the light intensity of 300 μE·m−2·s−1 were analyzed in triplicate. Absorbance spectra ranging from 300 to 700 nm were recorded with a microplate reader, averaged from biological triplicates, and normalized to biomass (A730). Oxygen evolution rates were measured under growth light (C, 300 μE·m−2·s−1) and saturating light (D, 4,000 μE·m−2·s−1) conditions for psbA1WT (yellow) and psbA1L353F (green) transformants. Error bars represent the standard deviation from 3 biological replicates. E) Volcano plot of proteomics. The psbA1WT and psbA1L353F strains were cultivated in quadruplets in a multi-cultivator under 150 mm NaCl and 300 μE·m−2·s−1 light, with samples collected during the log phase. Proteins with significantly higher abundances are highlighted in color (psbA1WT in orange and psbA1L353F in green). Several proteins related to photosynthesis and carbon metabolism are labeled. F) Proposed model for pD1 processing in enhancing PSII maturation. The L353F mutation in pD1 likely improves its cleavage efficiency by the protease CtpA, leading to accelerated PSII maturation and increased stability. Statistical significance was assessed using an unpaired Student's t-test (*P < 0.05; **P < 0.01).
Figure 6.
Figure 6.
Phylogenetic analysis of pD1 sequences. Phylogenetic tree analysis and diversity of the pD1 tail were conducted using a database of 1,761 nonredundant, active D1 sequences from cyanobacteria, cyanophages, and red-lineage algae. A neighbor-joining phylogenetic tree based on the Jukes–Cantor model shows that F353 independently evolved multiple times among cyanobacteria and red algae. Subtrees with phylogenetic distance ≤ 0.15 were collapsed, with clades containing F353 in the pD1 tail sequences highlighted in red. The diversity within the last 5 residues of mature D1, along with the 16-residue pD1 tail sequences, is also depicted in a sequence logo, showcasing the evolutionary variability of this region.

Similar articles

References

    1. Abramson J, Adler J, Dunger J, Evans R, Green T, Pritzel A, Ronneberger O, Willmore L, Ballard AJ, Bambrick J, et al. Accurate structure prediction of biomolecular interactions with AlphaFold 3. Nature. 2024:630(8016):493–500. 10.1038/s41586-024-07487-w - DOI - PMC - PubMed
    1. Allakhverdiev SI, Nishiyama Y, Miyairi S, Yamamoto H, Inagaki N, Kanesaki Y, Murata N. Salt stress inhibits the repair of photodamaged photosystem II by suppressing the transcription and translation of psbA genes in Synechocystis. Plant Physiol. 2002:130(3):1443–1453. 10.1104/pp.011114 - DOI - PMC - PubMed
    1. Andrews S. FastQC: a quality control tool for high throughput sequence data. Cambridge, UK: Babraham Bioinformatics; 2010. http://www.bioinformatics.babraham.ac.uk/projects/fastqc/
    1. Bechtold U, Ferguson JN, Mullineaux PM. To defend or to grow: lessons from Arabidopsis C24. J Exp Bot. 2018:69(11):2809–2821. 10.1093/jxb/ery106 - DOI - PubMed
    1. Bekker A, Holland H, Wang P-L, Rumble Iii D, Stein H, Hannah J, Coetzee L, Beukes N. Dating the rise of atmospheric oxygen. Nature. 2004:427(6970):117–120. 10.1038/nature02260 - DOI - PubMed

MeSH terms

Substances

Supplementary concepts

LinkOut - more resources