. 2025 May 23;11(21):eadw7191.
doi: 10.1126/sciadv.adw7191. Epub 2025 May 21.

Macrophage hitchhiking nanomedicine for enhanced β-elemene delivery and tumor therapy

Affiliations

Macrophage hitchhiking nanomedicine for enhanced β-elemene delivery and tumor therapy

Shuying Chen et al. Sci Adv. .

Abstract

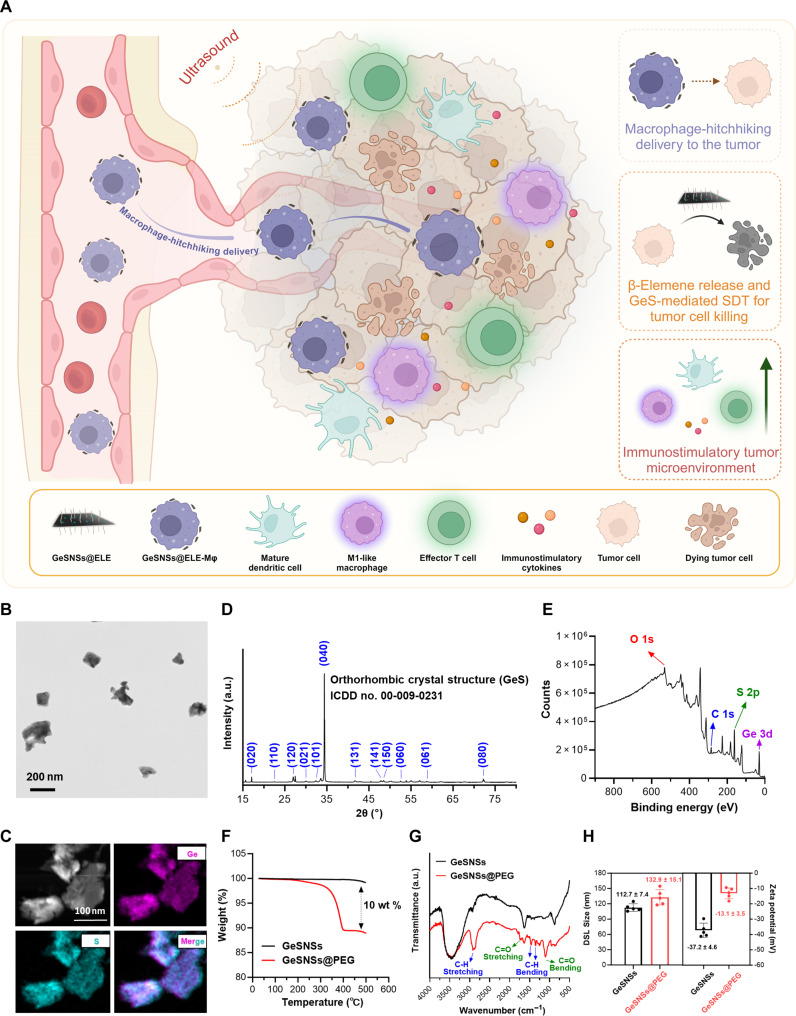
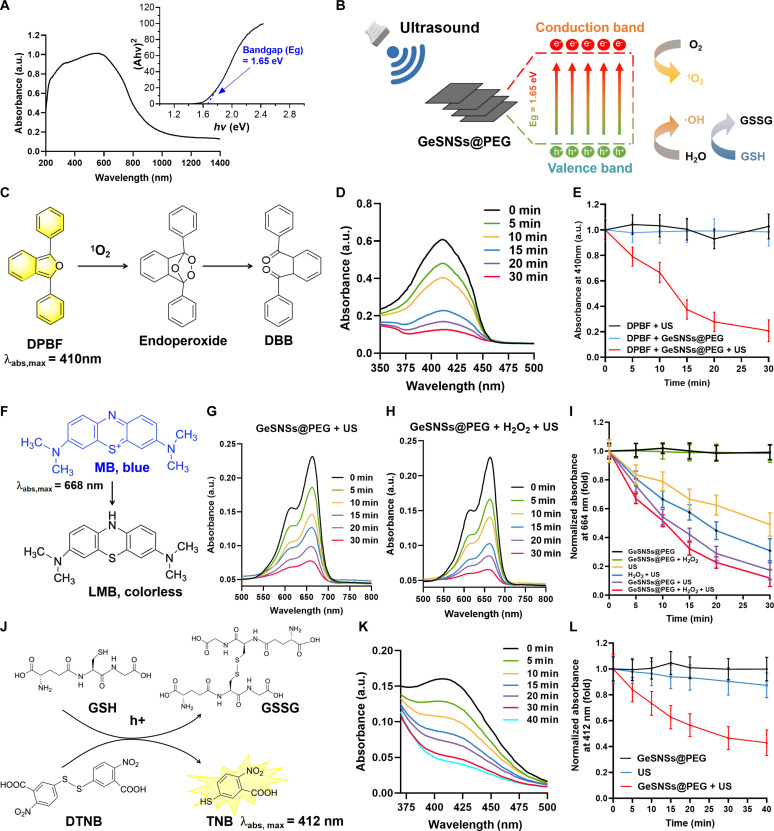
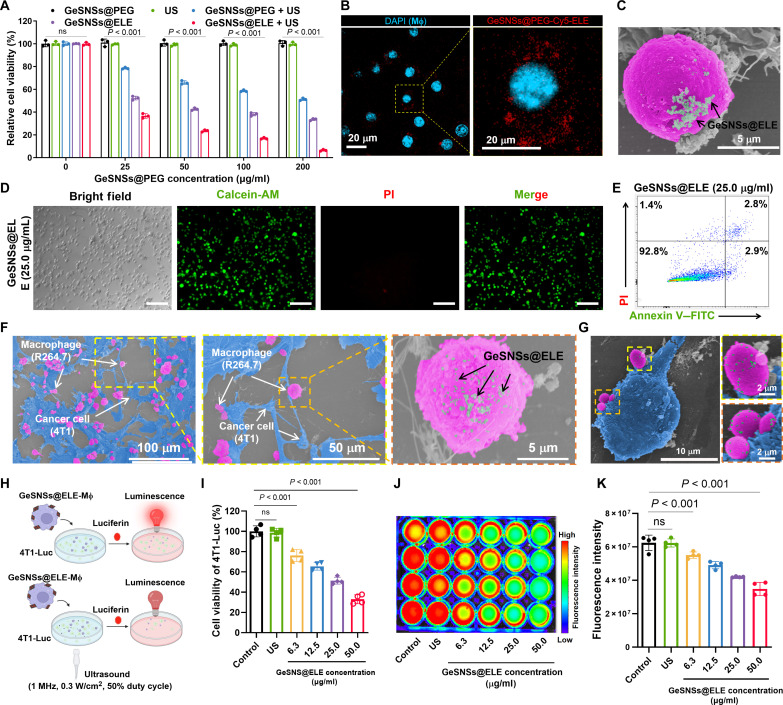
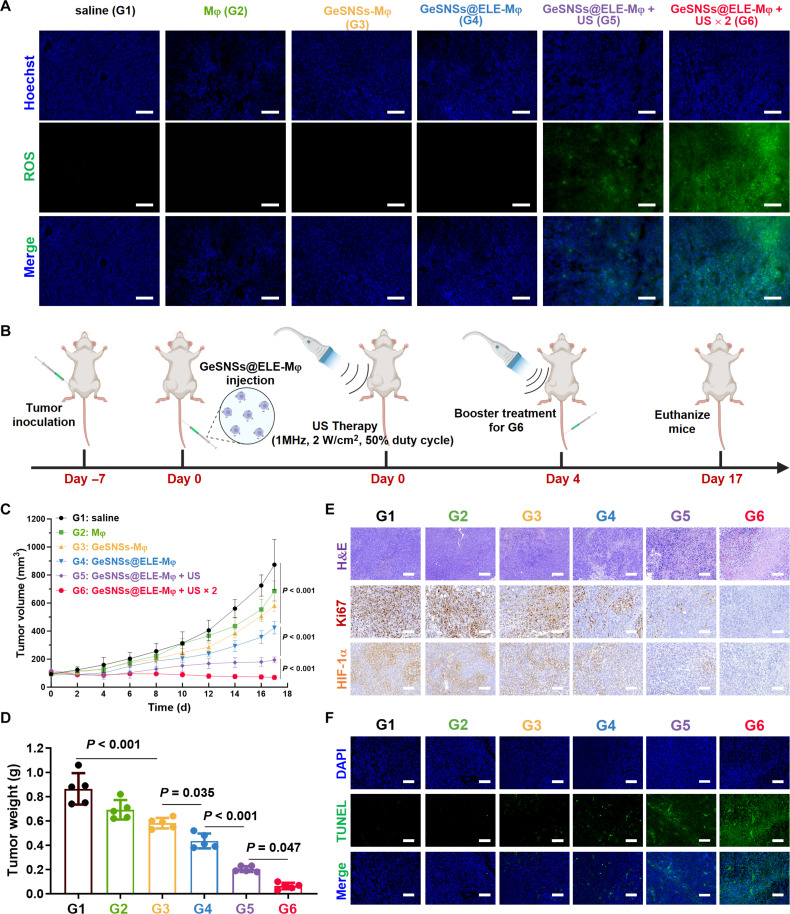
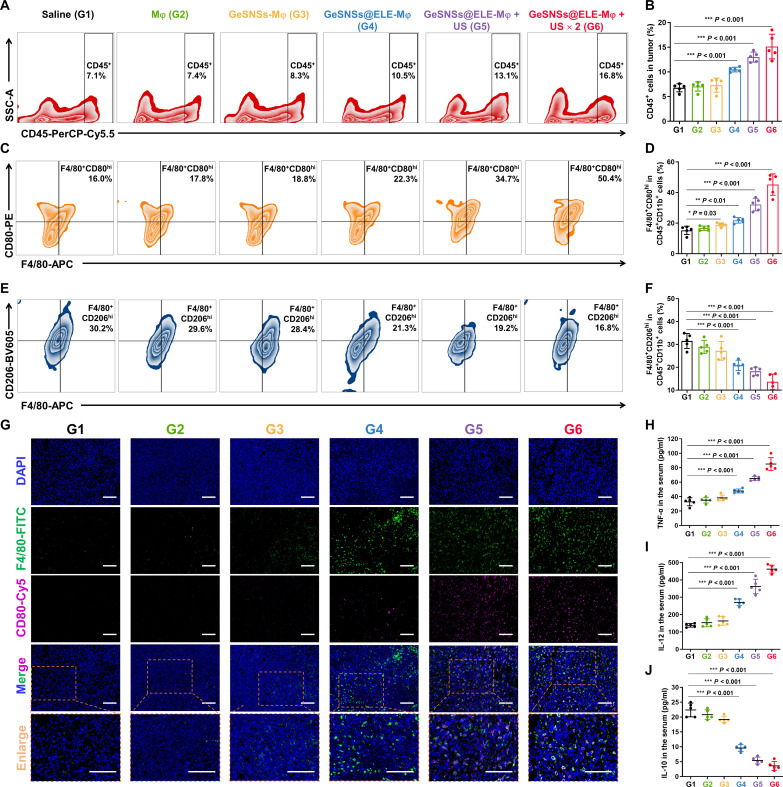
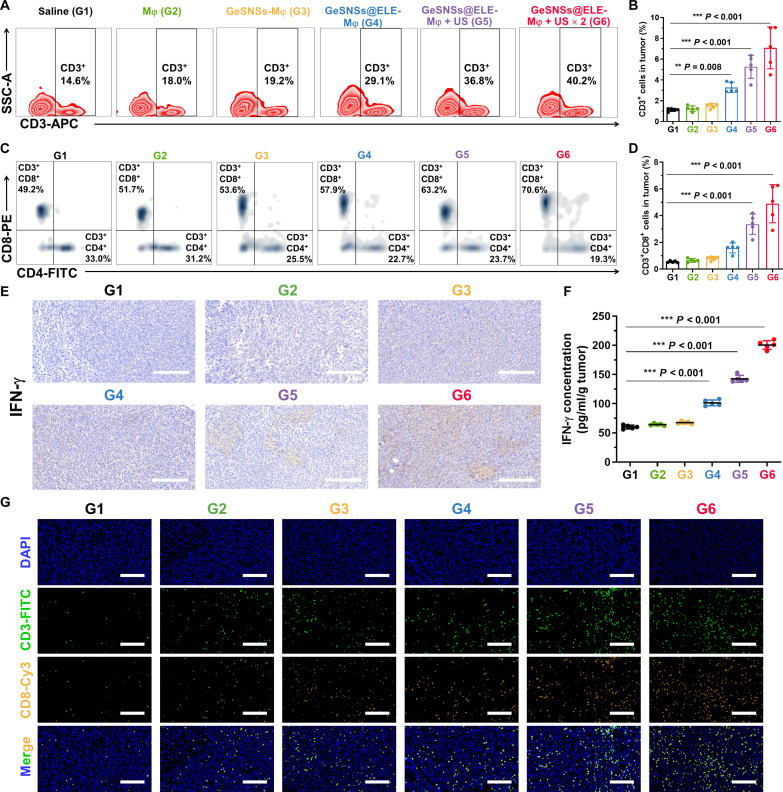
Nanoparticle-based drug delivery systems hold promise for tumor therapy; however, they frequently encounter challenges such as low delivery efficiency and suboptimal efficacy. Engineered living cells can redirect drug delivery systems to effectively reach targeted sites. Here, we used living macrophages as vehicles, attaching them with GeS nanosheets (GeSNSs) carrying β-elemene for transport to tumor sites. GeSNSs act as efficient sonosensitizers, enhancing ultrasound-induced reactive oxygen species generation for treating 4T1 breast tumors. Notably, macrophage hitchhiking delivery of β-elemene-loaded GeSNSs not only achieves high accumulation in tumor regions and suppresses tumor growth under ultrasound treatment, but also effectively remodels the immunosuppressive tumor microenvironment by improving M1-like macrophage polarization and enhancing the populations of mature dendritic cells, CD4+, and CD8+ lymphocytes, thereby facilitating enhanced sonodynamic chemoimmunotherapy. These findings underscore the potential of macrophage hitchhiking strategy for drug delivery and suggest broader applicability of engineered living materials-mediated delivery technologies in disease therapy.


Figures

Fig. 1.
Fig. 1.. Macrophage hitchhiking delivery of GeSNSs@ELE enhances tumor drug delivery and mediates effective sonodynamic immunotherapy.
(A) Schematic illustration of macrophages hitchhiking delivery of GeSNSs@ELE, where β-elemene–mediated chemotherapy and GeS-mediated SDT kill tumor cells, reprogramming the immunostimulatory tumor microenvironment. (B) Transmission electron microscopy (TEM) image of GeSNSs. (C) SEM with elemental mapping images of GeSNSs. (D) XRD pattern of GeSNSs. (E) XPS survey spectrum of GeSNSs. (F) TGA of GeSNSs and GeSNSs@PEG. (G) FTIR spectra of GeSNSs and GeSNSs@PEG. (H) DLS sizes and zeta potential values of GeSNSs and GeSNSs@PEG. Data are presented as means ± SD (n = 5).
Fig. 2.
Fig. 2.. Sonodynamic performance of GeSNSs@PEG.
(A) UV-Vis-NIR diffuse reflectance spectra of GeSNSs, with the optical bandgap (Eg) of GeSNSs calculated using the Kubelka-Munk equation depicted in the inset graph. a.u., arbitrary unit. (B) Proposed mechanism of sonodynamic performance of GeSNSs@PEG under US trigger. (C and D) Time-dependent oxidation of DPBF by 1O2 generated from US-triggered GeSNSs@PEG, with a US frequency of 1 MHz, power density of 1 W/cm2, and a 50% duty cycle. (E) A comparative analysis of the oxidation of DPBF under various conditions, including US alone, GeSNSs@PEG, and GeSNSs@PEG + US. Data are presented as means ± SD (n = 3). (F to H) Time-dependent degradation of MB by ·OH generated from US-triggered GeSNSs@PEG, with a US frequency of 1 MHz, power density of 1 W/cm2, and a 50% duty cycle. (I) Comparative analysis of the degradation of MB by GeSNSs@PEG under different treatments. Data are presented as means ± SD (n = 3). (J and K) Time-dependent degradation of GSH by h+ generated from US-triggered GeSNSs@PEG, with a US frequency of 1 MHz, power density of 2 W/cm2, and a 50% duty cycle. (L) Comparative analysis of the degradation of GSH by GeSNSs@PEG under different treatments. Data are presented as means ± SD (n = 3).
Fig. 3.
Fig. 3.. Construction and in vitro therapy of living materials (GeSNSs@ELE-Mφ).
(A) Cell viability of 4T1 cell following different treatments (n = 3). (B) Confocal microscope images of macrophages with GeSNSs@ELE attached to their surface. Scale bar, 20 μm. Blue: cell nuclei; Red: GeSNSs@ELE. (C) SEM image of a macrophage with GeSNSs@ELE attached to their surface. Scale bar, 5 μm. The macrophage (pink) and GeSNSs@ELE (as indicated by the arrow) are depicted using pseudo colors. (D) Fluorescence microscope images showing calcein-AM/PI costaining of macrophages after surface attachment of GeSNSs@ELE (one representative concentration is shown: 25.0 μg/ml; live cells: green; dead cells: red). Scale bars, 200 μm. (E) Flow cytometry apoptosis analysis of macrophages after surface attachment of GeSNSs@ELE (one representative concentration is shown: 25.0 μg/ml). (F and G) SEM images showing the interaction between tumor cells (4T1) and living materials (GeSNSs@ELE-Mφ). The tumor cells (blue), RAW264.7 macrophages (pink), and GeSNSs@ELE (as indicated by the arrow) are depicted using pseudo colors. (H) Schematic illustration showing the viability measurement of 4T1-Luc after the treatment of GeSNSs@ELE-Mφ and US via bioluminescence imaging. The bioluminescence signal intensity was used to quantify the viability of 4T1-Luc. (I) Viability of 4T1-Luc after the treatment of various concentration of GeSNSs@ELE-attached macrophages followed by US activation (n = 4). (J and K) Bioluminescence imaging and quantitative analysis of the bioluminescence intensity of 4T1-Luc after the treatment of various concentration of GeSNSs@ELE-attached macrophages (n = 4). PI, propidium iodide.
Fig. 4.
Fig. 4.. Anti-tumor efficacy of GeSNSs@ELE-Mφ.
(A) Fluorescence microscope images of tumor sections depicting the levels of ROS (green) using the H2DCF-DA probe following different treatment regimens. Scale bars, 100 μm. (B) Timeline of the establishment of 4T1 tumor-bearing mice and treatment protocol on 4T1 tumor. (C) Tumor volume growth curve of 4T1 tumor-bearing mice in each group (n = 5). (D) The weight of tumors removed from 4T1 tumor-bearing mice at day 17 after various treatments (n = 5). (E) H&E staining and immunohistochemical staining for Ki67 and hypoxia-inducible factor-1α (HIF-1α) were performed on 4T1 tumors removed at day 17 after various treatments. Scale bars, 100 μm. (F) TUNEL fluorescence staining (green) was performed on 4T1 tumors removed at day 17 after various treatments. The cell nuclei were stained with DAPI. Scale bars, 100 μm. G1: saline; G2: Mφ; G3: GeSNSs-Mφ; G4: GeSNSs@ELE-Mφ; G5: GeSNSs@ELE-Mφ + US; G6: GeSNSs@ELE-Mφ + US × 2.
Fig. 5.
Fig. 5.. US-triggered GeSNSs@ELE-Mφ induces robust anti-tumor immune responses in 4T1 breast tumor-bearing mice.
(A and B) Representative flow cytometry and quantitative statistical results of CD45+ cells in mouse tumors from each treatment group. (C and D) Representative flow cytometry and quantitative statistical results of F4/80+CD80hi M1-like TAMs in mouse tumors from each treatment group. (E and F) Representative flow cytometry and quantitative statistical results of F4/80+CD206hi M1-like TAMs in mouse tumors from each treatment group. (G) Immunofluorescence images of tumor tissues after various treatments. Green: macrophages stained with anti-F4/80 antibody; purple: M1-like macrophage marker stained with anti-CD80 antibody; blue: cell nuclei stained with DAPI. Scale bars, 500 μm. (H to J) Serum levels of proinflammatory cytokines [TNF-α and IL-12 (p40)] and anti-inflammatory cytokine (IL-10) of 4T1 breast tumor-bearing mice in each treatment group. G1: saline; G2: Mφ; G3: GeSNSs-Mφ; G4: GeSNSs@ELE-Mφ; G5: GeSNSs@ELE-Mφ + US; G6: GeSNSs@ELE-Mφ + US × 2. Data are expressed as means ± SD (n = 5 mice per group). Statistical significance was calculated by one-way analysis of variance (ANOVA) test. *P < 0.05, **P < 0.01, ***P < 0.001, and P > 0.05 is not significant.
Fig. 6.
Fig. 6.. US-triggered GeSNSs@ELE-Mφ reprograms the immunosuppressive TME of 4T1 tumors.
(A) Immunohistochemical staining images of TNF-α, IL-12, and IL-10 in tumor tissues after various treatments. Scale bars, 100 μm. (B to D) Secretion levels of TNF-α, IL-12 (p40), and IL-10 in tumor tissues after various treatments (n = 5). (E) Representative flow cytometry analysis images of CD45+CD11c+ cells in tumors after various treatments. (F) Representative flow cytometry analysis images of CD45+CD11c+CD103+ cells in tumors after various treatments. (G) Representative flow cytometry analysis images of CD45+CD11c+CD80+CD86+ cells in tumors after various treatments. (H) Quantification of CD45+CD11c+ cells in tumors after various treatments using flow cytometry. (I) Quantification of CD45+CD11c+CD103+ cells in tumors after various treatments using flow cytometry. (J) Quantification of CD45+CD11c+CD80+CD86+ cells in tumors after various treatments using flow cytometry. G1: saline; G2: Mφ; G3: GeSNSs-Mφ; G4: GeSNSs@ELE-Mφ; G5: GeSNSs@ELE-Mφ + US; G6: GeSNSs@ELE-Mφ + US × 2. Data are expressed as means ± SD (n = 5 mice per group). Statistical significance was calculated by one-way ANOVA test. *P < 0.05, **P < 0.01, ***P < 0.001, and P > 0.05 is not significant.
Fig. 7.
Fig. 7.. US-triggered GeSNSs@ELE-Mφ induces potent T cell-mediated anti-tumor immune response in 4T1 breast tumor.
(A and B) Representative flow cytometry analysis images and quantitative analysis of CD45+CD3+ lymphocytes in tumor tissues after different treatments. (C and D) Representative flow cytometry analysis images and quantitative analysis of CD3+CD8+ CTLs and CD3+CD4+ helper T lymphocytes in tumor tissues after different treatments. (E) Immunohistochemistry (IHC) staining images of IFN-γ expression levels in tumors of mice after different treatments. Scale bars, 100 μm. (F) IFN-γ secretion levels in tumor tissues after different treatments. (G) Immunofluorescence staining images of CD3+ (green, FITC), and CD8+ (yellow, Cy3) T lymphocytes in tumor tissues after different treatments. Cell nuclei were stained with DAPI (blue). Scale bars, 100 μm. G1: saline; G2: Mφ; G3: GeSNSs-Mφ; G4: GeSNSs@ELE-Mφ; G5: GeSNSs@ELE-Mφ + US; G6: GeSNSs@ELE-Mφ + US × 2. Data are expressed as means ± SD (n = 5 mice per group). Statistical significance was calculated by one-way ANOVA test. **P < 0.01, ***P < 0.001, and P > 0.05 is not significant.

Similar articles

References

    1. Brody H., Innovative cancer therapies offer new hope. Nature 629, S1 (2024). - PubMed
    1. Galluzzi L., Guilbaud E., Schmidt D., Kroemer G., Marincola F. M., Targeting immunogenic cell stress and death for cancer therapy. Nat. Rev. Drug Discov. 23, 445–460 (2024). - PMC - PubMed
    1. Chen W., Li Y., Liu C., Kang Y., Qin D., Chen S., Zhou J., Liu H. J., Ferdows B. E., Patel D. N., Huang X., Koo S., Kong N., Ji X., Cao Y., Tao W., Xie T., In situ engineering of tumor-associated macrophages via a nanodrug-delivering-drug (β-Elemene@Stanene) strategy for enhanced cancer chemo-immunotherapy. Angew. Chem. Int. Ed. 62, e202308413 (2023). - PubMed
    1. Mitchell M. J., Billingsley M. M., Haley R. M., Wechsler M. E., Peppas N. A., Langer R., Engineering precision nanoparticles for drug delivery. Nat. Rev. Drug Discov. 20, 101–124 (2021). - PMC - PubMed
    1. Li Y., Chen W., Kang Y., Zhen X., Zhou Z., Liu C., Chen S., Huang X., Liu H. J., Koo S., Kong N., Ji X., Xie T., Tao W., Nanosensitizer-mediated augmentation of sonodynamic therapy efficacy and antitumor immunity. Nat. Commun. 14, 6973 (2023). - PMC - PubMed