. 2025 May 23;11(21):eadt7013.
doi: 10.1126/sciadv.adt7013. Epub 2025 May 21.

Single-molecule analysis reveals the mechanism of chromatin ubiquitylation by variant PRC1 complexes

Affiliations

Single-molecule analysis reveals the mechanism of chromatin ubiquitylation by variant PRC1 complexes

Alexandra Teslenko et al. Sci Adv. .

Abstract

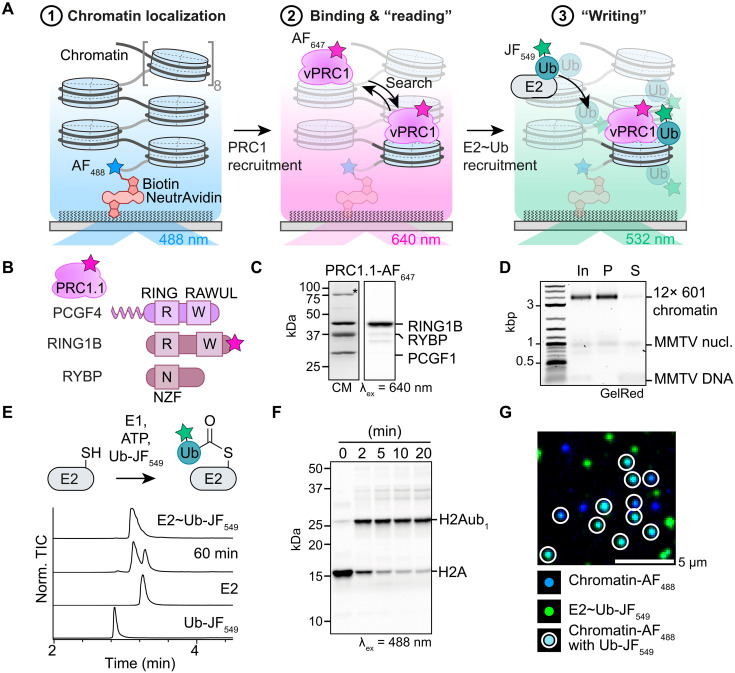
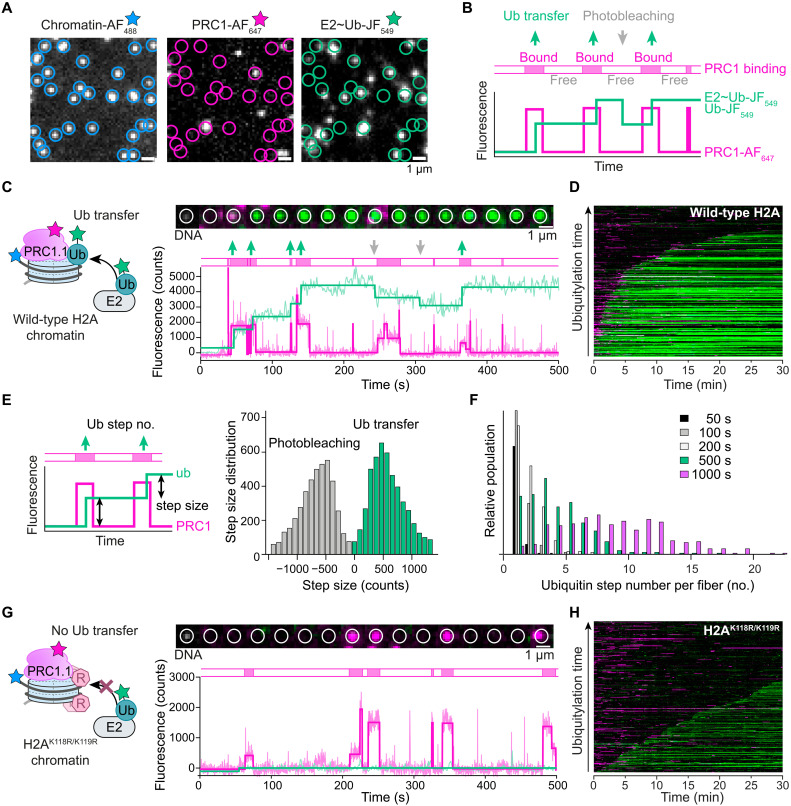
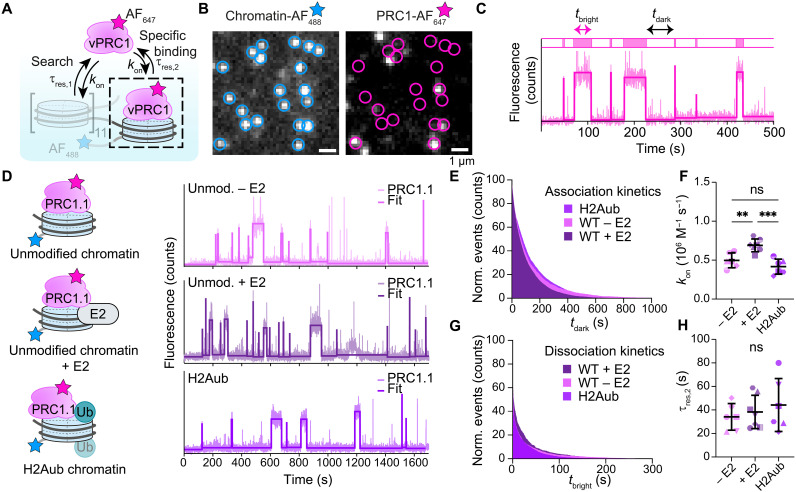
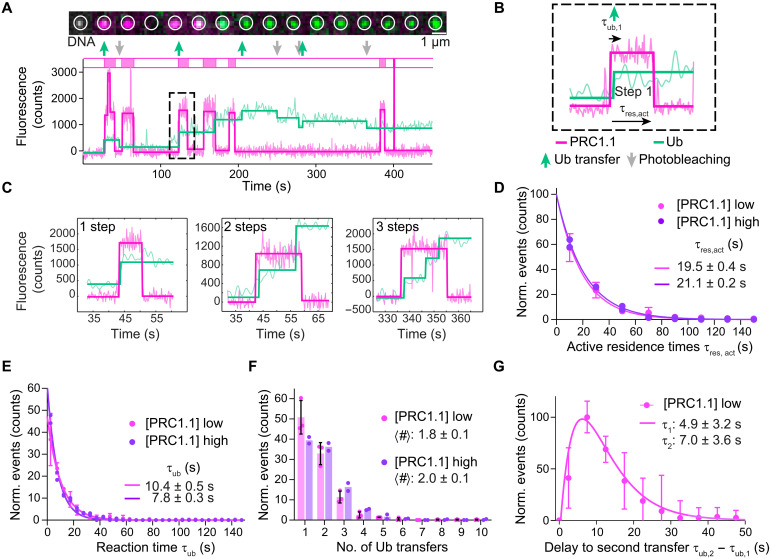
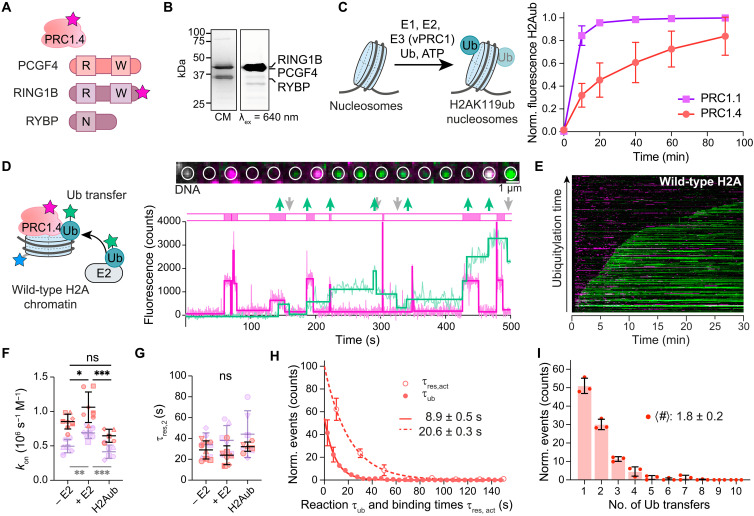
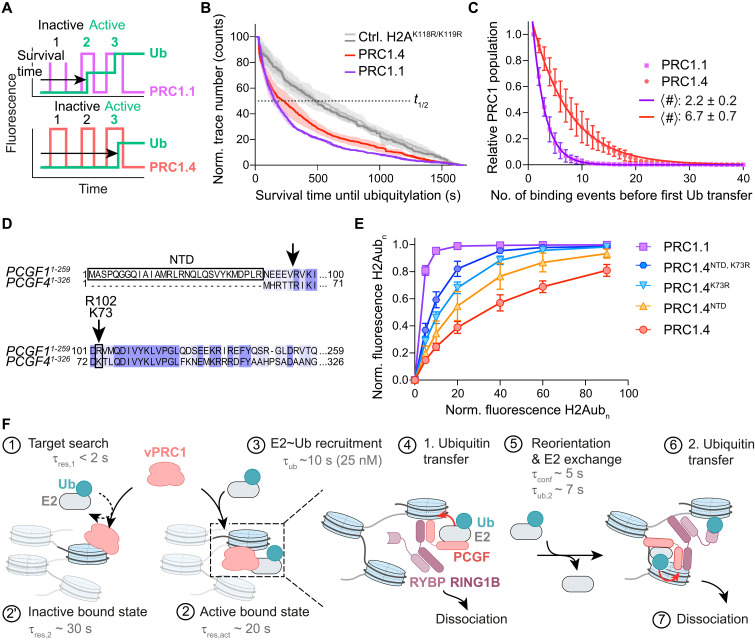
Chromatin regulation relies on "writer" enzymes that add posttranslational modifications to histone proteins. Variant polycomb repressive complex 1 (PRC1) exists as several subtypes, which are "writers" of ubiquitylation on histone H2A K118 and K119, crucial for transcriptional repression during development and cell identity determination. The mechanism by which dynamic chromatin exploration by variant PRC1 complexes couples to ubiquitin writing is unknown. Here, we developed a single-molecule approach to directly observe chromatin interactions and ubiquitylation by PRC1. We find that variant PRC1 transiently samples chromatin until it reaches a catalytically competent nucleosome-bound state, resulting in E2 recruitment and ubiquitin transfer. Variant PRC1 is weakly processive in ubiquitylating neighboring nucleosomes. Moreover, activity differences between PRC1 subtypes, containing either a PCGF1 or PCGF4 subunit, result from distinct probabilities of achieving a catalytically competent state. Our results thus demonstrate that the dynamic formation of an active complex between variant PRC1, E2, and chromatin is the critical determinant of subtype-specific variant PRC1 activity.


Figures

Fig. 1.
Fig. 1.. Establishment of an in situ chromatin ubiquitylation assay.
(A) Scheme of the three-color single-molecule experiment to observe chromatin ubiquitylation, with chromatin fibers detected via AF488 emission in the blue-green channel, variant PRC1 binding dynamics observed via AF647 emission in the red-far red channel, and chromatin ubiquitylation monitored by JF549 emission in the green-orange channel. Ub, ubiquitin. (B) PRC1.1 subunit composition. The pink star indicates the position of the AF647 dye (see also fig. S1). (C) SDS-PAGE of purified, fluorescently labeled PRC1.1. CM, Coomassie blue; λex = 640 nm, AF647 fluorescence after 640-nm irradiation. Asterisk, Hsp70 associated with PRC1.1. (D) Agarose gel electrophoretic analysis of magnesium-precipitated 12× 601 chromatin fibers. In, input; P, pellet containing pure chromatin fibers; S, supernatant containing buffer DNA and “buffer” nucleosomes on MMTV DNA (fig. S2). (E) Loading of E2 (UbcH5c) with fluorescently labeled ubiquitin. Top: reaction scheme; bottom: analysis of the reaction progress via ESI LC-MS (see also figs. S3 and S4, A to E). TIC, total ion current. (F) SDS-PAGE analysis of ubiquitylation assay on chromatin fibers containing H2A labeled with Atto 488 dye (H2A-Atto488) with E2~Ub and PRC1. λex = 488 nm, fluorescence emission from H2A-Atto488 (see also fig. S4F). (G) smTIRF analysis of ubiquitylation products, showing chromatin fibers in blue and E2~Ub and ubiquitin in green. Cyan spots show ubiquitylated single chromatin fibers. For additional views, see fig. S4G.
Fig. 2.
Fig. 2.. Single-molecule observation of dynamic chromatin ubiquitylation by PRC1.1.
(A) Single movie frames from chromatin ubiquitylation experiment (for the experimental scheme, see Fig. 1A). Left: chromatin channel, 488-nm excitation, 498- to 523-nm emission; middle: PRC1 channel, 640-nm excitation, 659- to 754-nm emission; right: ubiquitin channel, 532-nm excitation, 553- to 618-nm emission. (B) Scheme of single-molecule fluorescence time trace. Magenta: PRC1channel showing PRC1-AF647 chromatin binding; green: ubiquitin channel showing chromatin ubiquitylation with Ub-JF549; green arrows: E2~Ub binding/ubiquitin transfer events; gray arrows: photobleaching of JF549 dye (see also fig. S6F). (C) PRC1.1 chromatin ubiquitylation observed by single-molecule fluorescence. Left: reaction scheme; top: fluorescence images from a single chromatin fiber (white circle: position of chromatin; green: ubiquitin channel; magenta: PRC1 channel); bottom: fluorescence time trace [see (B) for details and fig. S7 (A and C) for additional traces and images]. (D) Composite plots of PRC1.1 ubiquitylation over 30 min at [E2~Ub] = 25 nM. Each line represents a time trace, and fluorescence intensity is encoded in color intensity. n = 221 traces. See fig. S7E for further plots. (E) Analysis of step size in the ubiquitin channel. Left: scheme; right: step size histogram of ubiquitylation and photobleaching events in the ubiquitin channel for the experiment shown in (C) and (D), revealing an average step size of 500 counts. (F) Histogram of the number of ubiquitylation events per chromatin fiber for indicated time intervals. (G) Ubiquitylation of chromatin fibers containing mutant H2AK118R/K119R by PRC1.1. Left: reaction scheme; top: fluorescence images from single chromatin fiber; bottom: fluorescence time trace. See fig. S7 (B and D) for additional data. (H) Composite plots of the PRC1.1 ubiquitylation process shown in (G) over 30 min at [E2~Ub] = 25 nM. n = 221 traces. See fig. S7F for further data.
Fig. 3.
Fig. 3.. PRC1.1 dynamically binds chromatin.
(A) Scheme of variant PRC1 nucleosome binding. (B) Single movie frames from PRC1.1 chromatin binding experiment. Left: chromatin channel; right: PRC1 channel. (C) Binding trace for PRC1.1 on chromatin fibers. tbright, time intervals for bound PRC1.1; tdark, search time intervals between binding events. (D) Binding dynamics of PRC1.1 to unmodified chromatin fibers (unmod.) and fibers containing H2Aub, in the absence (−E2) or presence of E2 (+E2; 50 nM), fitted by a step function. Time intervals tdark and tbright are determined via thresholding. See fig. S9 (A to C) for additional binding traces. (E) Binding kinetics: cumulative histogram of tdark times. [PRC1.1]: 1 nM (WT − E2), 1.1 nM (WT + E2), and 1 nM (H2Aub) (see also fig. S9D). (F) kon for PRC1.1 binding to different chromatin fibers (see also fig. S15F). n = 6 (unmod. − E2), n = 7 (unmod. + E2), and n = 6 (H2Aub). Error bars are SD; statistical testing: one-way ANOVA with Tukey’s multiple comparison test. *P < 0.05, **P < 0.01, and ***P < 0.001; ns, nonsignificant. (G) Dissociation kinetics: cumulative histogram of tbright times. [PRC1.1]: 1 nM (WT − E2), 1.1 nM (WT + E2), and 1 nM (H2Aub) (see also fig. S9E). (H) Long residence times τres,2 for PRC1.1 on different chromatin fibers (see also Materials and Methods and fig. S9I). For a description of statistical analysis, see (F). For all data, see table S1.
Fig. 4.
Fig. 4.. Dissecting single chromatin writing events by PRC1.1.
(A) Top: fluorescence images from a single chromatin fiber (white circle: position of the chromatin fiber; green: ubiquitin channel; magenta: PRC1 channel); bottom: fluorescence time trace. (B) Binding event of PRC1.1 correlating with ubiquitylation steps. τres,act, productive PRC1 binding time; τub,i, reaction time until ith ubiquitin transfer. (C) Examples of PRC1.1 binding events associated with the indicated number of ubiquitin transfer steps. See fig. S12A for more events. (D) Histograms of binding events associated with ubiquitin transfer. [PRC1.1] low: 0.5 nM PRC1.1 and 25 nM E2~Ub; [PRC1.1] high: 0.8 nM PRC1.1 and 40 nM E2~Ub. Solid line: fit using monoexponential function, with indicated fit parameters for τres,act. Error bars are SD; n = 3 {[PRC1.1] low} and n = 2 {[PRC1.1] high}. (E) Histograms of first reaction times from the beginning of binding to first ubiquitin transfer [τub,1; see (B)] for different concentrations [see (D)]. Solid line: fit to monoexponential function, with indicated fit parameters for τub,1. Error bars are SD; n = 3 {[PRC1.1] low} and n = 2 {[PRC1.1] high}. (F) Histogram of the number of ubiquitin transfers [no. of steps; see (B)] per binding event of PRC1.1 at different concentrations [see (D)]. Error bars are SD; n = 3 {[PRC1.1] low} and n = 2 {[PRC1.1] high}. Indicated are average steps per event 〈#〉 for different concentrations. (G) Histogram of τub,2, i.e., the time distribution between first and second ubiquitin transfers, at 0.5 nM PRC1.1 and 25 nM E2~Ub. Error bars are SD; n = 3. Solid line: biexponential fit, yielding indicated time constants τ1 and τ2.
Fig. 5.
Fig. 5.. Single-molecule analysis of PRC1.4 chromatin ubiquitylation.
(A) PRC1.4 subunits; star: AF647. (B) SDS-PAGE of PRC1.4. CM, Coomassie blue; λex = 640 nm, AF647 fluorescence emission. (C) Quantification of ubiquitylated H2A from ubiquitylation assays on nucleosomes using PRC1.4 and PRC1.1 (see also fig. S13I). Error bars are SD; n = 3 independent experiments. (D) Single-molecule PRC1.4 chromatin ubiquitylation. Left: reaction scheme; top: fluorescence images from a single chromatin fiber (circle: chromatin fiber position; green: ubiquitin; magenta: PRC1); bottom: fluorescence time trace (see Fig. 2B for details and fig. S14 for additional traces). (E) Composite plots of the PRC1.4 ubiquitylation process shown in (D) over 30 min at [E2~Ub] = 25 nM; n = 261 traces [see fig. S14 (E and F) for additional data]. (F) kon for chromatin binding of PRC1.4 (red) and, for comparison, PRC1.1 (violet; from Fig. 3F). For dissociation constants and analysis details, see fig. S15. n = 8 (unmod. − E2), n = 7 (unmod. + E2), and n = 5 (H2Aub). Error bars are SD; statistical testing: one-way ANOVA with Tukey’s multiple comparison test. *P < 0.05, **P < 0.01, and ***P < 0.001; ns, nonsignificant. (G) Long chromatin residence times τres,2 for PRC1.4 (red) and PRC1.1 (violet; from Fig. 3G). For short residence times τres,1 and analysis details, see Materials and Methods and fig. S15. Statistics: see (F). (H) Open symbols: histograms of active binding events τres,act of PRC1.4. Fit: monoexponential function (dashed line). Error bars are SD; n = 3. Closed symbols: histograms of reaction times τub,1 of PRC1.4. Fit: monoexponential function (full line). Error bars are SD; n = 3. See fig. S12D for distribution of secondary transfer events τub,2. (I) Histogram of the number of ubiquitin transfers (no. of steps) per binding event of PRC1.4. Error bars are SD; n = 3. For all data, see table S2.
Fig. 6.
Fig. 6.. PRC1.4 has a lower probability to form enzymatically active chromatin interactions.
(A) Analysis to determine the probability of ubiquitin transfer per variant PRC1 binding event. Survival time until ubiquitylation: time delay from injection of variant PRC1 complexes and E2~Ub to first chromatin ubiquitylation. (In-)active events: variant PRC1 binding events (not) associated with ubiquitin transfer. (B) Distribution of survival times until ubiquitylation, as defined in (A) for PRC1.1 on wild-type chromatin (H2AWT, n = 3) and control chromatin (H2AK118R/K119R, n = 3) and PRC1.4 on wild-type (n = 3) and control chromatin (n = 3); data from Figs. 2E and 5E. Data are the means (solid line) ± SEM; n = 3. Observed half-times t1/2 are for PRC1.1 (H2AWT: 157 s; H2AK118R/K119R: 484 s) and PRC1.4 (H2AWT: 231 s; H2AK118R/K119R: 507 s). (C) Distributions of the number of inactive binding events before the first ubiquitylation event for PRC1.1 (n = 5) and PRC1.4 (n = 5). Analysis: monoexponential fit, with indicated parameters for PRC1.1 and PRC1.4. (D) Partial sequence alignment of PCGF1 and PCGF4. The arrows indicate the position where we introduced the PCGF1 NTD into PCGF4 and the position of the K73R mutation. See fig. S1A for a complete sequence alignment. (E) Quantification of ensemble ubiquitylation assays with PRC1.4 variants, containing PCGF1, PCGF4, or variants PCGF4NTD, PCGF4K73R, or PCGF4NTD, K73R, using H2A-Atto488–containing nucleosomes. Error bars are SD; n = 3 independent experiments. See fig. S16E for SDS-PAGE analysis. (F) Overall model and associated timescales for variant PRC1 chromatin ubiquitylation. For further details, see the text. For all data, see table S3.

Similar articles

References

    1. K. E. van Holde, “Chromatin” in Springer Series in Molecular and Cell Biology (Springer-Verlag, 1989).
    1. Luger K., Mäder A. W., Richmond R. K., Sargent D. F., Richmond T. J., Crystal structure of the nucleosome core particle at 2.8 Å resolution. Nature 389, 251–260 (1997). - PubMed
    1. Woodcock C. L., Dimitrov S., Higher-order structure of chromatin and chromosomes. Curr. Opin. Genet. Dev. 11, 130–135 (2001). - PubMed
    1. Bannister A. J., Kouzarides T., Regulation of chromatin by histone modifications. Cell Res. 21, 381–395 (2011). - PMC - PubMed
    1. Jenuwein T., Allis C. D., Translating the histone code. Science 293, 1074–1080 (2001). - PubMed

MeSH terms

LinkOut - more resources