. 2025 May 23;11(21):eadr9331.
doi: 10.1126/sciadv.adr9331. Epub 2025 May 21.

CD8+ T cell-derived CD40L mediates noncanonical cytotoxicity in CD40-expressing cancer cells

Affiliations

CD8+ T cell-derived CD40L mediates noncanonical cytotoxicity in CD40-expressing cancer cells

Phillip Schiele et al. Sci Adv. .

Abstract

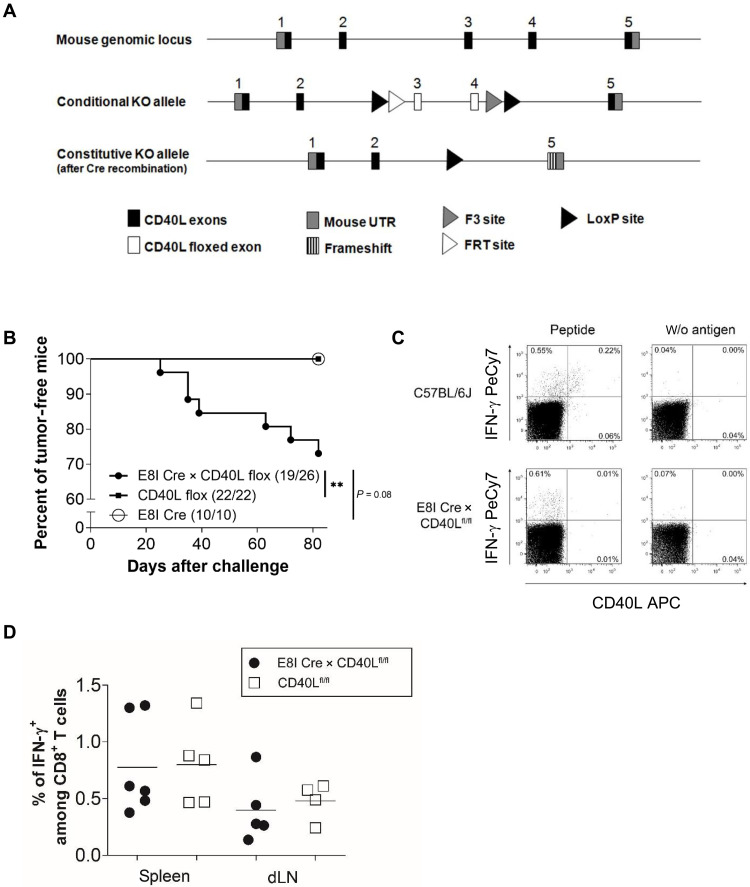
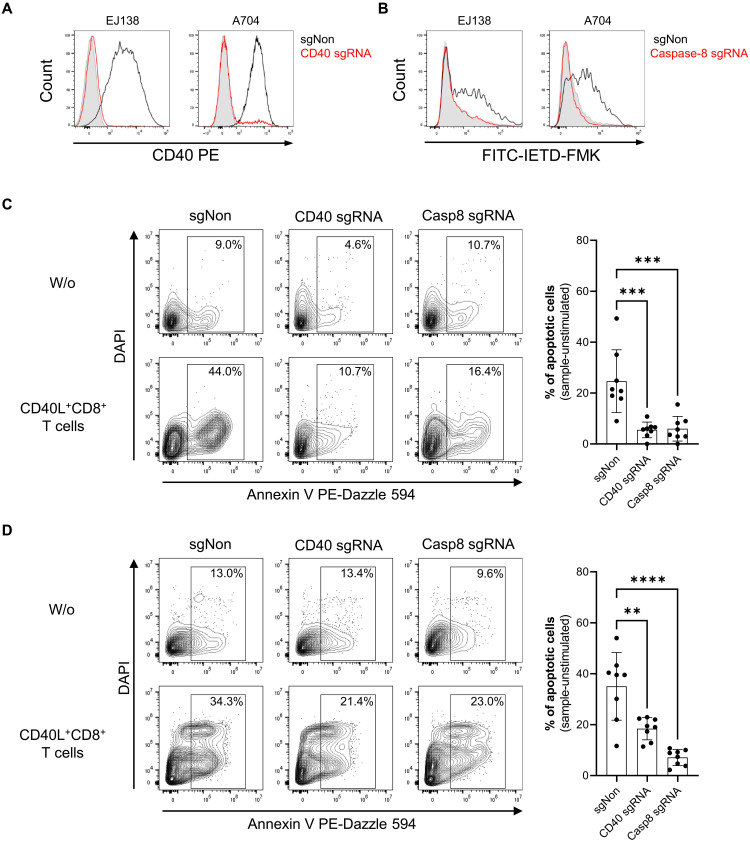
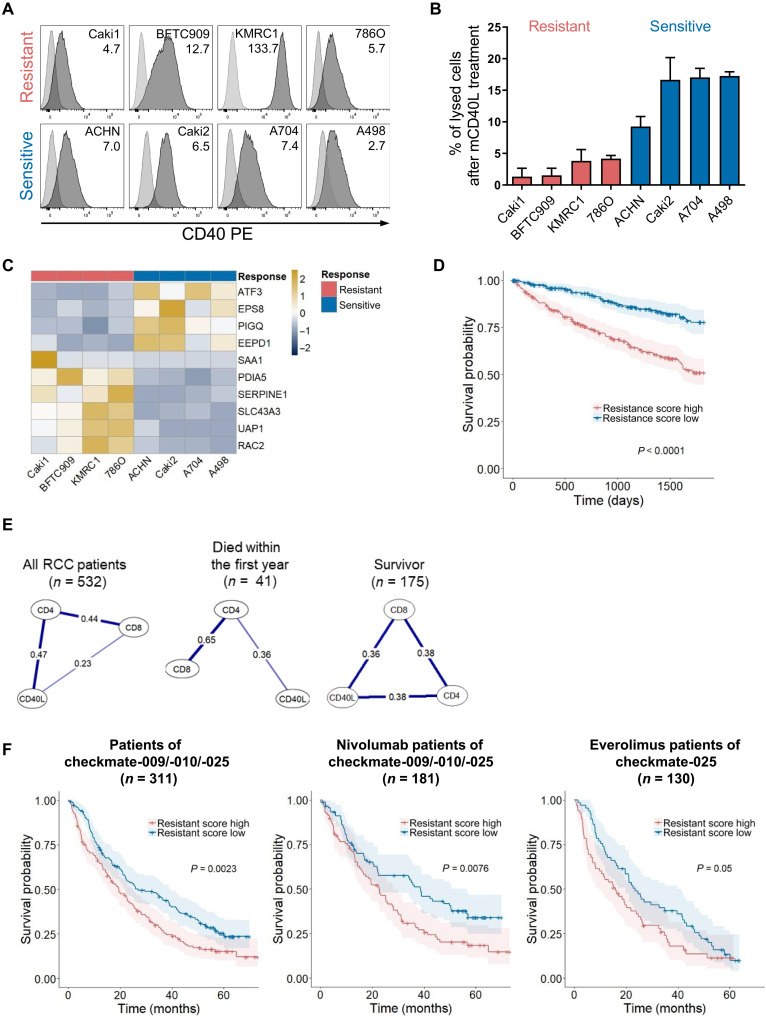
T cells and their effector functions, in particular the canonical cytotoxicity of CD8+ T cells involving perforin, granzymes, Fas ligand (FasL), and tumor necrosis factor related apoptosis inducing ligand (TRAIL), are crucial for tumor immunity. Here, we reveal a previously unidentified mechanism by which CD40L-expressing CD8+ T cells induce cytotoxicity in cancer cells. In murine models, up to 50% of tumor-specific CD8+ T cells expressed CD40L, and conditional CD40L ablation in CD8+ T cells alone led to tumor formation. Mechanistically, CD40L+CD8+ T cells can induce cell death in CD40-expressing cancer cells by triggering caspase-8 activation. We demonstrate that a gene signature for resistance to CD40 signaling-induced cell death strongly correlates with worse survival in different human cancer cohorts. Our results introduce CD40L as a rather counterintuitive, noncanonical cytotoxic factor that complements the capabilities of CD8+ T cells to combat cancers and has the potential to enhance the efficacy of immunotherapies.


Figures

Fig. 1.
Fig. 1.. CD40L expression on SV40 TAg–specific CD8+ T cells during a protective immune response.
(A) Splenocytes of WT mice challenged with 16.113 TAg+ cancer cells were stimulated with peptide IV at indicated time points. d, day. The dot plots show the intracellular IFN-γ and CD40L staining of CD3+CD8+CD4-gated lymphocytes from one representative mouse (n = 4 mice). (B) The diagram summarizes the frequencies of CD40L+IFN-γ+ and CD40LIFN-γ+CD8+ T cells and (C) the frequency of IL-2–producing cells among CD40L+ and CD40L tumor-specific CD8+ T cells at the different time points (both means ± SD).
Fig. 2.
Fig. 2.. Prevention of tumor outgrowth is dependent on CD40L expression on CD8+ T cells.
(A) RAG1−/− mice were injected subcutaneously with 1 × 10⁶ 9.27 TAg+ cancer cells and treated in parallel with intravenously injected CD8+ T cells from WT or CD40L−/− mice and/or with WT CD4+ T cells. The means ± SD of the tumor size of four or five mice per group are shown from one representative of five experiments. (B) The tumor sizes of individual mice in different groups are shown at day 26. (C) Summary of the tumor formation data obtained from five independent experiments. Tumor formation was defined as an established tumor when its volume reached >500 mm3. Statistical analysis: Analysis of variance (ANOVA) with Bonferroni multiple comparisons posttest: *P < 0.05, **P < 0.01, and ***P < 0.001.
Fig. 3.
Fig. 3.. Impaired tumor rejection in nonlymphopenic CD8+ T cell–specific CD40L KO mice.
(A) Strategy for the generation of CD40Lfl/fl mice. UTR, untranslated region; FRT, flippase recognition target. (B) E8I-Cre × CD40Lfl/fl, E8I-Cre, and CD40L fl/fl mice as WT control were injected subcutaneously with 1 × 10⁶ 9.27 TAg+ cancer cells. Summary of the tumor formation data obtained from three individual experiments, each with 5 to 10 mice per group. Tumor was defined as established when its volume reached >500 mm3. (C and D) WT and E8I-Cre × CD40Lfl/fl mice were subcutaneously injected with 1 × 10⁶ 9.27 TAg+ cancer cells, and 7 days later, splenocytes and cells from the draining lymph nodes (dLNs) were isolated and stimulated with peptide IV. (C) The dot plots show the intracellular IFN-γ and CD40L staining of CD3+CD8+CD4-gated splenocytes from one representative mouse of five mice. (D) The diagram summarizes the frequencies of TAg-specific IFN-γ+CD8+ T cells measured among splenocytes and lymph node cells. Statistical analysis: Log-rank test: **P < 0.01.
Fig. 4.
Fig. 4.. Role of CD40 expression on host and 9.27 cancer cells for tumor rejection.
(A) CD40L−/− and CD40−/- mice were injected subcutaneously with 1 × 10⁶ 9.27 cancer cells. Summary of the tumor formation data obtained from two individual experiments, each with 6 to 10 mice per group. Tumor was defined as established when its volume reached >500 mm3. FSC-A, forward-scatter-area. (B) Cell surface expression of CD40 was analyzed after culturing 9.27 cancer cells, supplemented with or without TGFβ for 24 hours in three individual experiments. (C and D) The 9.27 cancer cells were treated for 24 hours with TGFβ and subsequently stimulated for further 24 hours with multimeric mouse CD40L. Thereafter, caspase-8 activity was determined with the fluorescence marker FITC-IETD-FMK and costained with annexin V. (C) The representative dot plots show the gating of annexin V and FITC-IETD-FMK–stained cancer cells after triggering CD40. (D) The diagrams summarize the frequencies of active caspase-8+ cancer cells, measured as triplicates of one of three representative experiments.
Fig. 5.
Fig. 5.. CD8+ T cell–mediated CD40 signaling in cancer cells prevents tumor formation.
(A) Cell surface expression of CD40 was analyzed after culturing TRAMP-C1 and CD40tg TRAMP-C1 cells with or without TGFβ for 24 hours. (B) Both TRAMP-C1 cancer cell lines were stimulated for 24 hours with multimeric CD40L. Thereafter, caspase-8 activity was determined with the fluorescence marker FITC-IETD-FMK. The representative dot plots show the gating of 4′,6-diamidino-2-phenylindole (DAPI) and FITC-IETD-FMK–stained cancer cells after triggering CD40. The diagrams summarize the frequencies of active caspase-8+ cancer cells. (C and D) E8I-Cre × CD40Lfl/fl and E8I-Cre as WT control mice were injected subcutaneously with 5 × 10⁶ TRAMP-C1 (C) or CD40tg TRAMP-C1 (D) cancer cells. In the diagrams [(C) and (D)], the data from one of two representative experiments are shown. Per group, five or six mice were challenged. Tumor was defined as established when its volume reached >500 mm3. Statistical analysis: (B) Mann-Whitney U test: **P < 0.01 and [(C) and (D)] log-rank test: *P < 0.05 and **P < 0.01.
Fig. 6.
Fig. 6.. CD40L+CD8+ T cells mediate cell death in human CD40+ carcinoma cell lines by caspase-8 activation.
(A) Histograms represent the CD40 expression on EJ138 or A704 transfected with nontargeting single guide RNA (black, sgNon) or cells depleted for CD40 by CRISPR-Cas9 and sgRNA against human CD40 (red). Gray-filled histograms show isotype staining. (B) sgNon (black) or caspase-8 sgRNA–treated (red) EJ138 and A704 cells were treated with multimeric CD40L for 24 hours, and caspase-8 activation was monitored by FITC-IETD-FMK staining. Gray-filled histograms represent the basal caspase-8 activation of unstimulated WT cells. (C and D) sgNon, CD40 sgRNA-, or caspase-8 (Casp8) sgRNA–treated variants of EJ138 (C) or A704 (D) were cocultivated with CD40L-enriched CD8+ T cells for 24 hours, and apoptosis was detected by annexin V and DAPI staining. Shown are representative dot plots with frequencies of technical triplicates (left) and bar graphs summarizing the data from experiments with eight different T cell donors. Statistical analysis: [(C) and (D)] Repeated measures ANOVA, followed by Dunnett’s test: **P < 0.01, ***P < 0.001, and ****P < 0.0001.
Fig. 7.
Fig. 7.. Resistance pattern for CD40-mediated cell death and correlations between CD8 and CD40L in different RCC cohorts.
(A) In the histograms, the dark gray areas display the CD40 expression, and the light gray areas display the corresponding isotype control on eight different RCC lines. The included numbers represent the mean fluorescence intensity fold change between CD40 and isotype control staining. (B) Percentages of CD40L-induced lysis per RCC line after stimulation for 48 hours are plotted. Representative lysis values after backgorund substraction of each cell line of at least three individual experiments are depicted. (C) The heatmap represents the top 10 differentially expressed genes between CD40-resistant and CD40-sensitive RCC cell lines. (D) In the Kaplan-Meier survival plot, the resistance score of low and high groups of the TCGA-KIRC patient cohort is compared with each other. (E) Partial correlation networks of different patient groups are displayed, and the numbers are the partial correlation coefficients. (F) In the Kaplan-Meier survival plots, the resistance score of low and high groups of the cohorts is compared with all patients treated within the checkmate-009, checkmate-010, and checkmate-025 studies (left) or divided into two arms of the checkmate-025 study (middle nivolumab arm and right everolimus arm). Statistical analysis: (C) Described in Materials and Methods; [(D) and (F)] log-rank test.

Similar articles

References

    1. Russell J. H., Ley T. J., Lymphocyte-mediated cytotoxicity. Annu. Rev. Immunol. 20, 323–370 (2002). - PubMed
    1. Frentsch M., Stark R., Matzmohr N., Meier S., Durlanik S., Schulz A. R., Stervbo U., Jürchott K., Gebhardt F., Heine G., Reuter M. A., Betts M. R., Busch D., Thiel A., CD40L expression permits CD8+ T cells to execute immunologic helper functions. Blood 122, 405–412 (2013). - PMC - PubMed
    1. Loyal L., Warth S., Jurchott K., Molder F., Nikolaou C., Babel N., Nienen M., Durlanik S., Stark R., Kruse B., Frentsch M., Sabat R., Wolk K., Thiel A., SLAMF7 and IL-6R define distinct cytotoxic versus helper memory CD8+ T cells. Nat. Commun. 11, 6357 (2020). - PMC - PubMed
    1. Ridge J. P., Di Rosa F., Matzinger P., A conditioned dendritic cell can be a temporal bridge between a CD4+ T-helper and a T-killer cell. Nature 393, 474–478 (1998). - PubMed
    1. Bennett S. R., Carbone F. R., Karamalis F., Flavell R. A., Miller J. F., Heath W. R., Help for cytotoxic-T-cell responses is mediated by CD40 signalling. Nature 393, 478–480 (1998). - PubMed