. 2025 May 23;11(21):eads3393.
doi: 10.1126/sciadv.ads3393. Epub 2025 May 21.

Neuronal lipofuscinosis caused by Kufs disease/CLN4 DNAJC5 mutations but not by a CSPα/DNAJC5 deficiency

Affiliations

Neuronal lipofuscinosis caused by Kufs disease/CLN4 DNAJC5 mutations but not by a CSPα/DNAJC5 deficiency

Santiago López-Begines et al. Sci Adv. .

Abstract

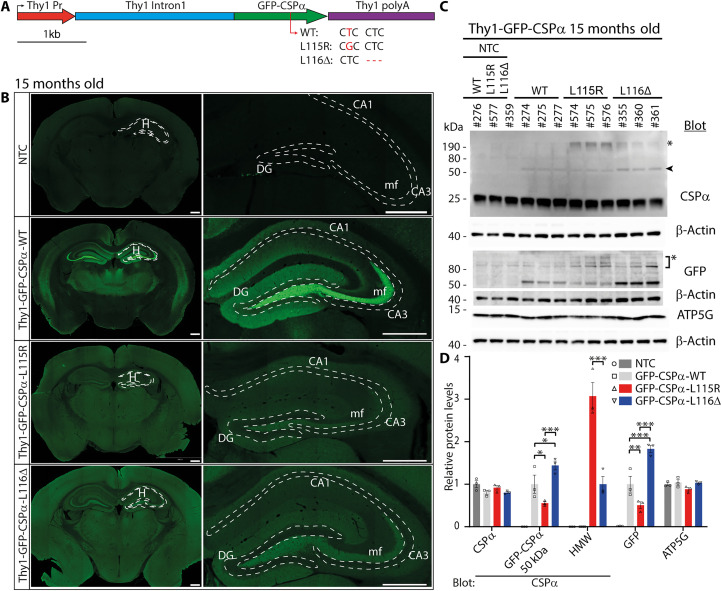
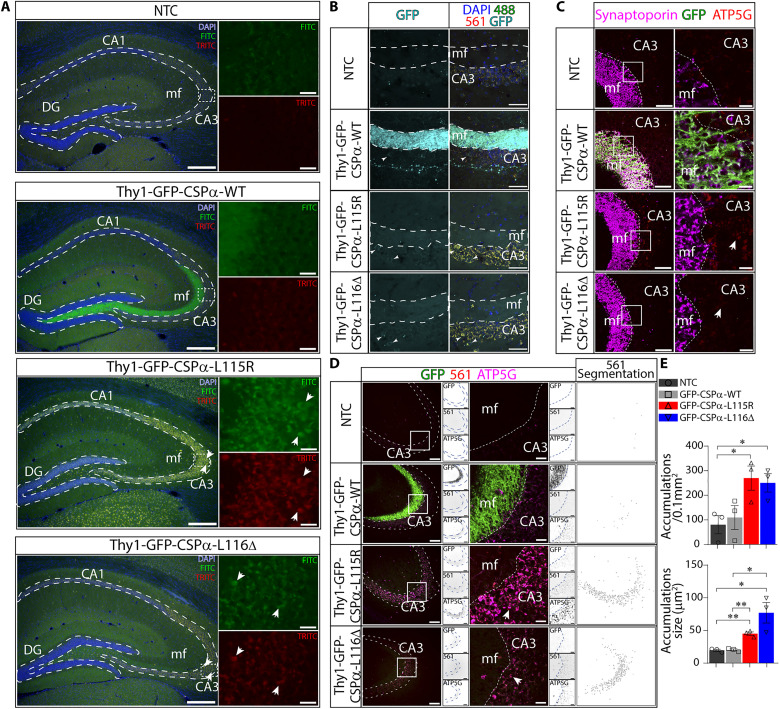
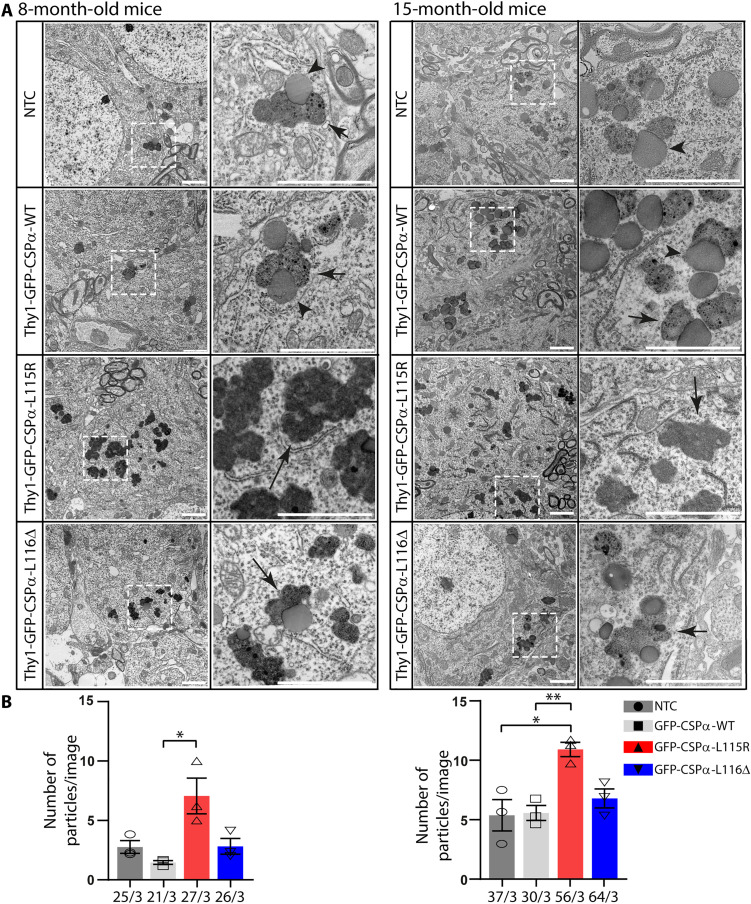
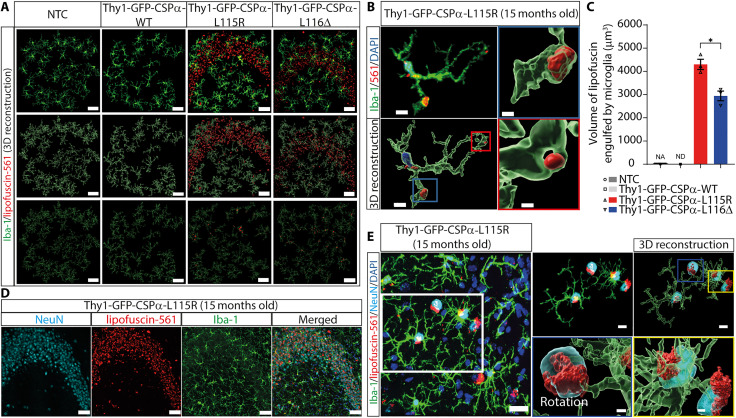
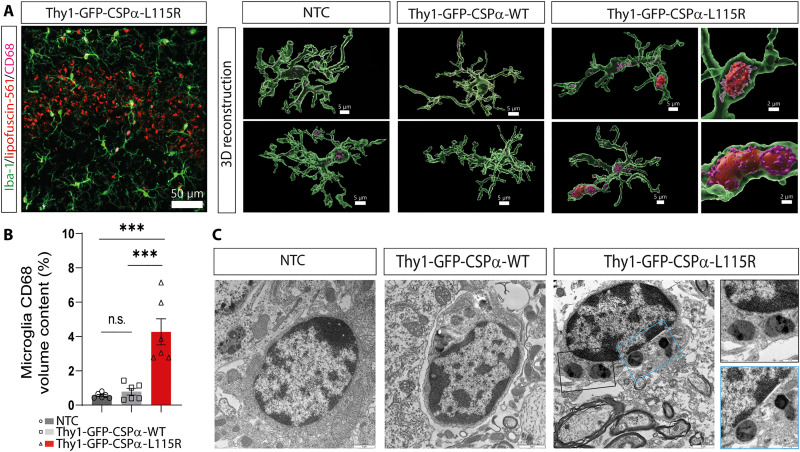
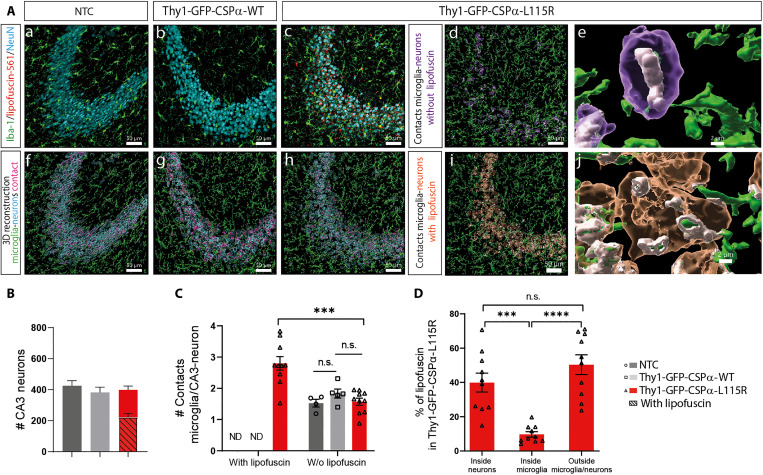
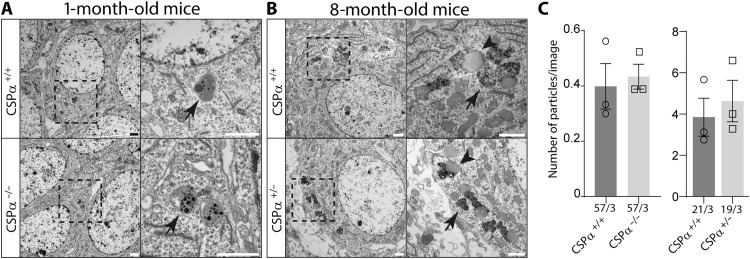
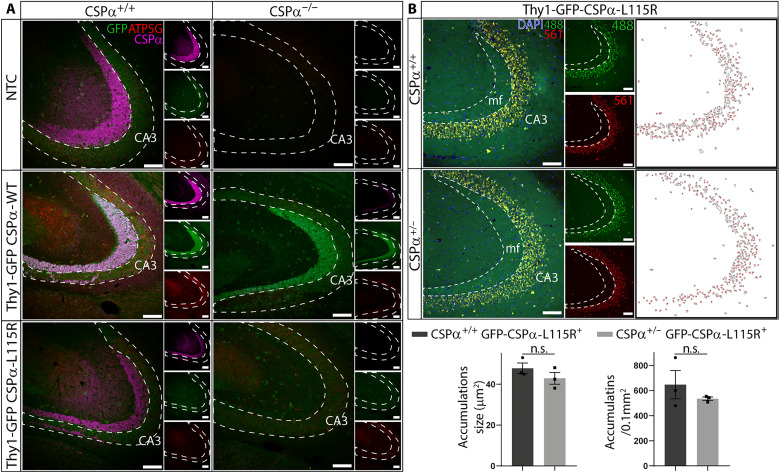
Kufs disease/CLN4 is an autosomal dominant neurodegenerative disorder caused by unknown mechanisms through Leu115Arg and Leu116Δ mutations in the DNAJC5 gene that encodes the synaptic vesicle co-chaperone cysteine string protein α (CSPα/DNAJC5). To investigate the disease mechanisms in vivo, we generated three independent mouse lines overexpressing different versions of CSPα/DNAJC5 under the neuron-specific Thy1 promoter: wild-type (WT), Leu115Arg, and Leu116Δ. Mice expressing mutant Leu115Arg CSPα/DNAJC5 are viable but develop motor deficits. As described in patients with Kufs disease, we observed the pathological lipofuscinosis and intracellular structures resembling granular osmiophilic deposits (GRODs) in the mutant but not in the WT transgenic lines. Microglia engulf lipofuscin and lipofuscin-containing neurons. Notably, conventional or conditional knockout mice lacking CSPα/DNAJC5 did not exhibit any signs of increased lipofuscinosis or GRODs. Our novel mouse models provide a valuable tool to investigate the molecular mechanisms underlying Kufs disease/CLN4. DNAJC5 mutations cause neuronal lipofuscinosis through a cell-autonomous gain of a pathological function of CSPα/DNAJC5.


Figures

Fig. 1.
Fig. 1.. Transgenic expression of WT and CLN4 mutant forms of CSPα/DNAJC5 in mouse brain.
(A) Genetic strategy to drive the neuronal expression of green fluorescent protein (GFP)–CSPα–WT and CLN4 mutants GFP-CSPα-L115R and GFP-CSPα-L116Δ under the neuron-specific promoter Thy1. (B) Representative epifluorescence images of GFP immunostaining demonstrate widely distributed expression of all transgenes in brain in 15-month-old mice. General stronger transgene expression of GFP-CSPα-WT especially evident at hippocampal mossy fibers. No signal is detected in non-transgenic control (NTC) mice. Scale bars, 500 μm. H, hippocampus; CA1 and CA3, Hippocampal cornu Ammonis regions 1 and 3; DG, Dentate gyrus; mf, mossy fibers. (C) Transgenic proteins detected by Western blot of hippocampal extracts from 15-month-old mice. Numbers indicate mouse ID number. Top blot: Endogenous CSPα/DNAJC5 is detected in all samples, while a band corresponding to GFP-tagged CSPα/DNAJC5 (arrowhead, 50 kDa) appears in transgenic samples but not in NTC. High molecular weight species [asterisk (*)] are detected in mutant transgenic samples, especially in L115R mutant. GFP signal is only detected in transgenic samples. Nonspecific band due to GFP antibody [asterisk (*)]. (D) Levels of selected hippocampal proteins. Relative protein levels normalized to non-transgenic mouse lines, except for GFP quantification that was normalized to GFP levels of the GFP-CSPα-WT transgenic line. Two-way analysis of variance (ANOVA) with Tukey’s post hoc test (*P < 0.05; **P < 0.01; ***P < 0.001). Quantitative data are available in table S1.
Fig. 2.
Fig. 2.. Neuronal lipofuscinosis in Thy1-GFP-CSPα-L115R and Thy1-GFP-CSPα-L116Δ transgenic mice.
(A) Representative merged epifluorescence images of mouse hippocampal slices from NTC and GFP-CSPα-WT, GFP-CSPα-L115R, and GFP-CSPα-L116Δ transgenic mice at 15 months old stained with 4′,6-diamidino-2-phenylindole (DAPI) (blue). Using the fluorescein isothiocyanate (FITC) filter set, the overlapping fluorescence signals (green) coming from GFP fluorescence and autofluorescence are collected. By using the tetramethylrhodamine isothiocyanate (TRITC) filter set, only autofluorescence signal is collected (red and yellow). Autofluorescence puncta are evident in transgenic mice expressing CLN4 CSPα/DNAJC5 mutations, especially at the pyramidal cell layers (arrows). Scale bars, 200 μm. (B) Merged confocal images of mossy fibers at the CA3 region in hippocampal slices stained with antibodies against GFP (cyan) and DAPI (blue). Autofluorescence signal (488- and 561-nm laser channels) (yellow) is evident in pyramidal neurons at the CA3 region in CLN4 mutants. Scale bars, 50 μm. (C) Confocal images from hippocampal sections stained with anti-ATP5G (red), anti-GFP (green), and anti-synaptoporin (magenta) antibodies. GFP only detected in GFP-CSPα-WT mice at mossy fibers. ATP5G clearly detected at CA3 postsynaptic cells in GFP-CSPα-L115R mice. Scale bars, (left) 50 μm and (right) 10 μm. (D) As in (C) plus the collection of autofluorescence through 561-nm laser channel. Autofluorescence and ATP5G signal detected in CLN4 mutants. Small square panels located at the right side of every individual panel, respectively, display, from top to bottom: the GFP, the 561-nm laser channel, and the ATP5G signals. White panels at the right show images resulting after mask segmentation of 561-nm laser channel used for quantification of autofluorescent spots (see Material and Methods). Scale bars, (left) 100 μm and (right) 10 μm. (E) Significant differences are observed in accumulations size and density. Means ± SEM. n = 3 animal/genotype. *P < 0.05; **P < 0.01, unpaired t test. Quantitative data available in table S1.
Fig. 3.
Fig. 3.. GROD-like structures in the somata of CA3 pyramidal neurons of CLN4 transgenic mice at 8 and 15 months age.
(A) Transmission electron microscopy analysis reveals normal lipofuscin characterized by lipid droplets associated to rather clear structures with dark puncta (short arrows) in control mice (NTC and Thy1-GFP-CSPα-WT) in contrast to dark GROD-like structures (long arrows) found in mutant mice (Thy1-GFP-CSPα-L115R and Thy1-GFP-CSPα-L116Δ). Pictures at right columns are magnification of selected areas at the left columns. (B) Lipofuscin and GROD-like structures were all quantified and plotted as particles per image revealing an increased number in the GFP-CSPα-L115R mutant at both ages studied (8 months on the left and 15 months on the right). Three animals were studied per genotype. *P < 0.05; **P < 0.01, unpaired t test. Scale bars, 2 μm.
Fig. 4.
Fig. 4.. Microglia engulf lipofuscin and neurons in Thy1-GFP-CSPα-L115R and Thy1-GFP-CSPα-L116Δ transgenic mice.
(A) First row: Representative images of immunostaining of microglia (Iba-1, green) and lipofuscin (red, autofluorescence at 561 nm using the TRITC filter) at the CA3 region of Thy1-GFP-CSPα-L115R of 15 months old mutant mice. Second row: Imaris three-dimensional (3D) reconstruction. Third row: Imaris 3D reconstruction of lipofuscin engulfed by microglia. Scale bars, 50 μm. (B) Imaris 3D reconstruction of one microglia cell of Thy1-GFP-CSPα-L115R mutant mice at 15 months old showing engulfed lipofuscin particles by microglia. Scale bars, 8 and 2 μm (red and blue boxes). (C) Quantification of volume of lipofuscin engulfed by microglia in control (NTC) and GFP-CSPα-WT, GFP-CSPα-L115R, and GFP-CSPα-L116Δ transgenic mice. Data were presented as means ± SEM; two-way ANOVA with Tukey’s post hoc test *P < 0.05, n = 3 mice per group, three images per mouse. At least 25 microglia cells per mouse were analyzed to get the processes length of microglia data. NA, not applicable; ND, non-detectable. (D) Immunostaining of microglia (Iba-1, green), lipofuscin (red, autofluorescence at 561 nm), neurons (NeuN, cyan) and nuclei (DAPI, blue) of 15 months old Thy1-GFP-CSPα-L115R mice. Scale bars, 50 μm. (E) Representative images of Imaris 3D reconstruction showing the close interaction between microglia and neurons with lipofuscin (blue square) and neurons with lipofuscin that is engulfed by microglia (yellow square) in Thy1-GFP-CSPα-L115R mice. Scale bars, 20 and 10 μm (white box) and 1 μm (blue and yellow boxes). Part of the dataset used to generate (A) and (C) (15 month-old mice data) was also used for figs. S12 and S13. NTC and Thy1-GFP-CSPα-WT dataset (both from 15-month-old mice) are the same in this figure and in fig. S12.
Fig. 5.
Fig. 5.. Microglial phagocytosis of lipofuscin in Thy1-GFP-CSPα-L115R at 15 months.
(A) Immunofluorescence staining in the CA3 region of the hippocampus for Thy1-GFP-CSPα-L115R mice at 15 months of age. Microglia are labeled with Iba1 (green), lipofuscin autofluorescence is detected in red (using the TRITC filter), and the CD68 phagocytic marker is in magenta. Scale bar, 50 μm. The rightmost column of (A) displays representative images of 3D reconstructions using Imaris software, showcasing microglia together with CD68 and lipofuscin in control (NTC), Thy1-GFP-CSPα-WT, and Thy1-GFP-CSPα-L115R mice at 15 months. Scale bars, 5 μm. The zoom-in images highlight microglial activation in Thy1-GFP-CSPα-L115R mice. Scale bars, 2 μm. (B) Quantification of the percentage of microglial CD68 volume content, revealing a significant increase in CD68 content in Thy1-GFP-CSPα-L115R mice, compared to controls. (C) Representative electron microscopy images of microglia. Notably, microglia in Thy1-GFP-CSPα-L115R mice exhibit a darker appearance and phagocytosed lipofuscin particles. Data were presented as means ± SEM; one-way ANOVA with Tukey’s post hoc test (***P < 0.001). n = 3 mice per group, two images per mouse.
Fig. 6.
Fig. 6.. Microglia-neuron interaction in Thy1-GFP-CSPα-L115R transgenic mice at 15 months.
(A) Microglia (Iba-1, green), neuron (NeuN, cyan), and lipofuscin (red, autofluorescence at 561 nm using the TRITC filter) immunofluorescence staining at the CA3 region was conducted to investigate microglia-neuron interactions in 15-month-old mice. In the first row, (a), (b), and (c) illustrate control (NTC), Thy1-GFP-CSPα-WT, and Thy1-GFP-CSPα-L115R mice, respectively. In the second row, (d), (e), and (f) present 3D reconstructions, with microglia and neurons. In Thy1-GFP-CSPα-L115R mice, two neuronal subtypes were observed: neurons without lipofuscin deposits (d) and neurons with lipofuscin (i). Scale bars, 50 μm. Zoom-in reconstructions (e and j) highlight the microglia-neuron contacts in both neuronal subtypes. Scale bars, 2 μm. (B) The number of CA3 neurons in control (NTC), Thy1-GFP-CSPα-WT, and Thy1-GFP-CSPα-L115R mice at 15 months was quantified. (C) The number of contacts between microglia and CA3 neurons was quantified, distinguishing between neurons with and without lipofuscin deposits. (D) The percentage of lipofuscin deposits inside neurons, inside microglia, and outside both cell types was determined in the Thy1 GFP-CSPα-L115R mice. Data were presented as means ± SEM; two-way ANOVA with Tukey’s post hoc test (B and C) and one-way ANOVA with Tukey’s post hoc test (D) (***P < 0.001; ****P < 0.0001). n.s., not significant. n = 5 mice, two images per mouse for Thy1-GFP-CSPα-L115R, n = 5 mice for Thy1-GFP-CSPα-WT, and n = 4 mice for NTC. ND, non-detectable.
Fig. 7.
Fig. 7.. Body weight, survival, and motor phenotype of Thy1-GFP-CSPα transgenic mice.
(A) Body weights of NTC, Thy1-GFP-CSPα-WT (WT), Thy1-GFP-CSPα-L115R (L115R), and Thy1-GFP-CSPα-L116Δ (L116Δ) mice were assessed in young (<2 months) and older (>8 months) groups. No significant weight differences were observed across genotypes. Sample sizes: young female (NTC, n = 6; WT, n = 8; L115R, n = 7; L116∆, n = 7), young male (NTC, n = 5; WT, n = 4; L115R, n = 5; L116∆, n = 4), old female (NTC, n = 19; WT, n = 9; L115R, n = 23; L116∆, n = 16), and old male (NTC, n = 13; WT, n = 15; L115R, n = 13; L116∆, n = 9). (B) Survival probability, shown by Kaplan-Meier plots, did not differ significantly among groups (log-rank test with Bonferroni correction). Sample sizes: female (NTC, n = 79; WT, n = 21; L115R, n = 33; L116∆, n = 43) and male (NTC, n = 55; WT, n = 25; L115R, n = 37; L116∆, n = 34). (C) Motor function, measured by rotarod, showed reduced performance in L115R mice, with a higher number of falls compared to NTC and WT (P < 0.001 for NTC versus L115R; P < 0.0001 for WT versus L115R). Time to fall was also shorter in L115R. Sample sizes: female (NTC, n = 12; WT, n = 6; L115R, n = 15; L116∆, n = 10) and male (NTC, n = 10; WT, n = 6; L115R, n = 9; L116∆, n = 6). (D) Representative open-field tracks indicative of lower mobility in L115R mice. (E) Open-field analysis indicated motor deficits in L115R and L116Δ mice, with shorter total distance, longer rest times, and slower speeds compared to NTC and WT. Statistical tests: ANOVA or Kruskal-Wallis with post hoc corrections based on normality (Shapiro-Wilk test). Sample sizes: female (NTC, n = 11; WT, n = 6; L115R, n = 15; L116∆, n = 8) and male (NTC, n = 10; WT, n = 6; L115R, n = 9; L116∆, n = 7). *P < 0.05; **P < 0.01; ***P < 0.001; ****P < 0.0001.
Fig. 8.
Fig. 8.. Normal lipofuscin but not GROD-like structures in conventional CSPα/DNAJC5 KO and heterozygous mice.
(A) Transmission electron microscopy analysis reveals that only normal lipofuscin is rarely found at young CSPα/DNAJC5 KO and WT mice at 1-month of age. (B) Normal lipofuscin, but not GROD-like structures, detected at 8-month-old CSPα/DNAJC5 heterozygous mice. (C) The number of lipofuscin particles per image in both groups is like control mice; however, the numbers detected in the CSPα/DNAJC5 KO and their controls at 1-month of age. Numbers at the bottom of graph bars indicate number of images/number of mice. Quantitative data are available in table S1.
Fig. 9.
Fig. 9.. Long-term removal of CSPα/DNAJC5 from glutamatergic neurons does not induce pathological lipofuscinosis.
(A) Chronogram of the strategy used for the genetic removal of CSPα/DNAJC5 in control (CaMKIIαCreERT2:Ai27D:Dnajc5flox/+) and experimental (CaMKIIαCreERT2:Ai27D:Dnajc5flox/−) mice. Brains were harvested after feeding 1- or 2-month-old mice with tamoxifen (TMX) (red arrows) for 30 days. Brains of mice fed at 1 month of age were collected at 8-, 16-, and 22-months post-TMX. Brains of mice fed at 2 months of age and collected 8 months later (i.e., at 11 months of age) were used exclusively for electron microscopy analysis. (B) Thy1-GFP-CSPα-L115R mice display pathological lipofuscinosis at CA3 pyramidal neurons as demonstrated by the immunolabeling with anti-ATP5G antibodies (magenta) in contrast to mice lacking CSPα/DNAJC5 in hippocampal glutamatergic neurons (CaMKIIαCreERT2:Ai27D:Dnajc5flox/−) and their controls (CaMKIIαCreERT2:Ai27D:Dnajc5flox/+), in which anti-ATP5G staining is negative. GFP is detected in green and the reporter Ai27D (channelrhodopsin 2 fused to td-tomato) in red. Scale bars, 100 μm. (C) Transmission electron microscopy analysis only detects normal lipofuscinosis in experimental and control mice at 8 and 16 months after TMX treatment. Scale bars, 2 μm. (D) The number of lipofuscin particles per image is similar among the experimental and the respective control mice studied at 8- and 16-months post-TMX. Numbers at the bottom of graph bars indicate number of images/number of mice. Quantitative data are available in table S1.
Fig. 10.
Fig. 10.. Pathological lipofuscinosis persists upon reducing the endogenous CSPα/DNAJC5 gene dosage.
(A) One-month-old mice expressing the WT (Thy1-GFP-CSPα-WT) and L115R (Thy1-GFP-CSPα-L115R) transgenic versions of CSPα/DNAJC5 in control and CSPα/DNAJC5 KO backgrounds do not show a prominent staining with anti-ATP5G antibodies (red) at the hippocampal CA3 region. CSPα/DNAJC5 (magenta) is detected in controls, but it is absent in CSPα/DNAJC5 KO mice. Anti-GFP signal detected in green. Scale bars, 100 μm. (B) Pathological lipofuscin is detected as a prominent autofluorescent overlapping signal between the signals coming from the 488-nm laser channel (green) and from the 561-nm laser channel (red) at the hippocampal CA3 region of Thy1-GFP-CSPα-L115R under CSPα/DNAJC5 WT and heterozygous backgrounds. Anti-GFP signal detected in green and DAPI in blue. Scale bars, 100 μm. White panels at the right show images resulting after mask segmentation of 561-nm laser channel used for quantification of autofluorescent spots (see Material and Methods). No significant differences (unpaired t test) are observed in accumulations size and density. Means ± SEM, n = 3 animal per genotype. Quantitative data are available in table S1.

Similar articles

References

    1. Butz E. S., Chandrachud U., Mole S. E., Cotman S. L., Moving towards a new era of genomics in the neuronal ceroid lipofuscinoses. Biochim. Biophys. Acta Mol. Basis Dis. 1866, 165571 (2020). - PubMed
    1. Schultz M. L., Tecedor L., Chang M., Davidson B. L., Clarifying lysosomal storage diseases. Trends Neurosci. 34, 401–410 (2011). - PMC - PubMed
    1. Nelvagal H. R., Lange J., Takahashi K., Tarczyluk-Wells M. A., Cooper J. D., Pathomechanisms in the neuronal ceroid lipofuscinoses. Biochim. Biophys. Acta Mol. Basis Dis. 1866, 165570 (2020). - PubMed
    1. Cárcel-Trullols J., Kovács A. D., Pearce D. A., Cell biology of the NCL proteins: What they do and don’t do. Biochim. Biophys. Acta Mol. Basis Dis. 1852, 2242–2255 (2015). - PubMed
    1. Boehme D. H., Cottrell J. C., Leonberg S. C., Zeman W., A dominant form of neuronal ceroid-lipofuscinosis. Brain 94, 745–760 (1971). - PubMed