. 2025 May 23;11(21):eads5002.
doi: 10.1126/sciadv.ads5002. Epub 2025 May 21.

Genome-wide analyses of cell-free DNA for therapeutic monitoring of patients with pancreatic cancer

Affiliations

Genome-wide analyses of cell-free DNA for therapeutic monitoring of patients with pancreatic cancer

Carolyn Hruban et al. Sci Adv. .

Abstract

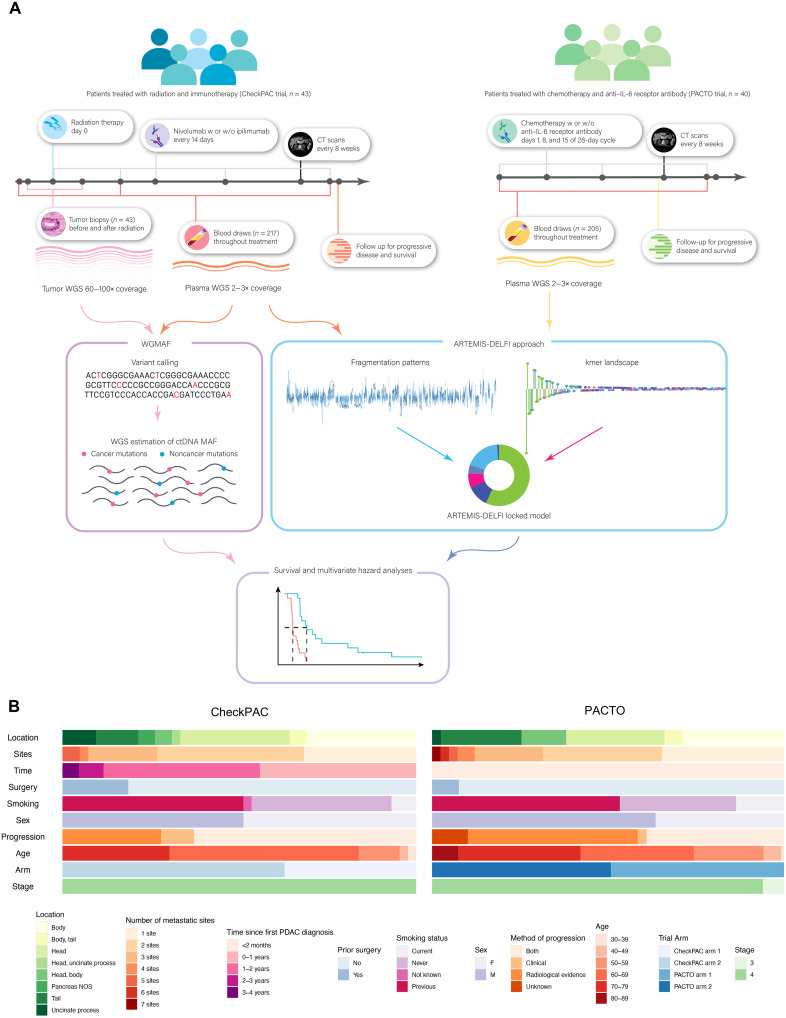
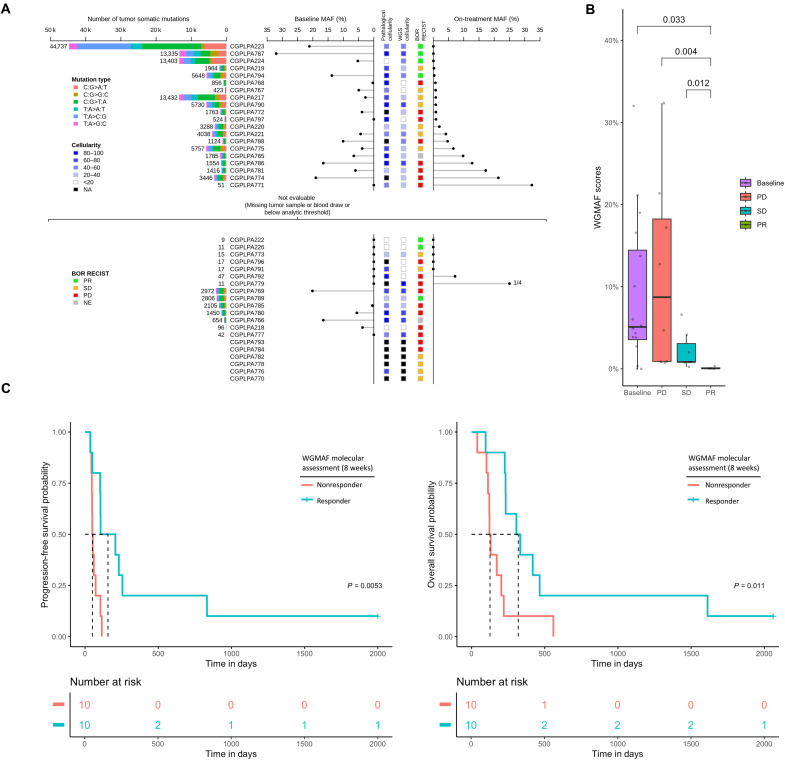
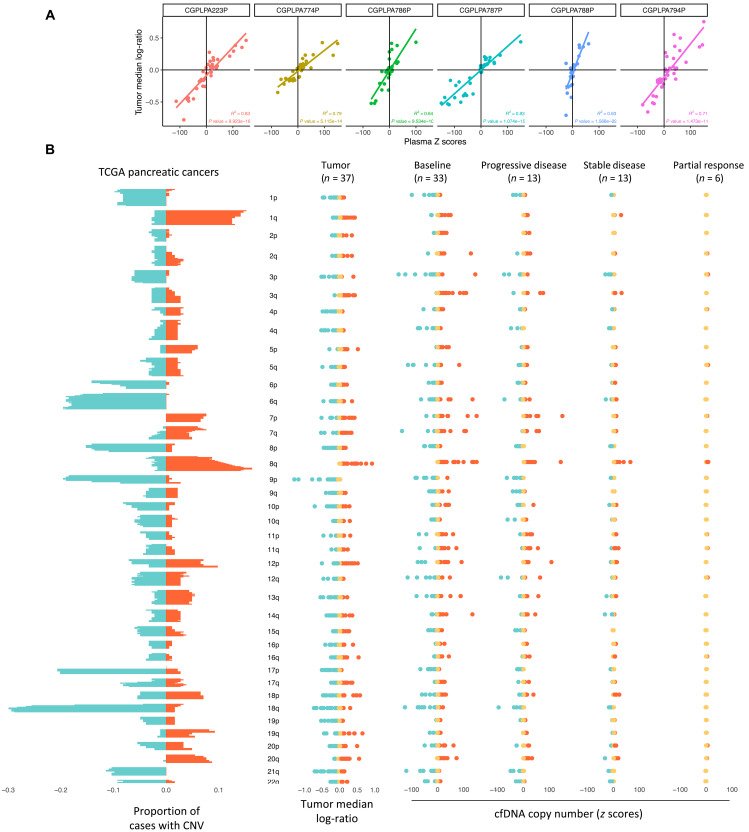
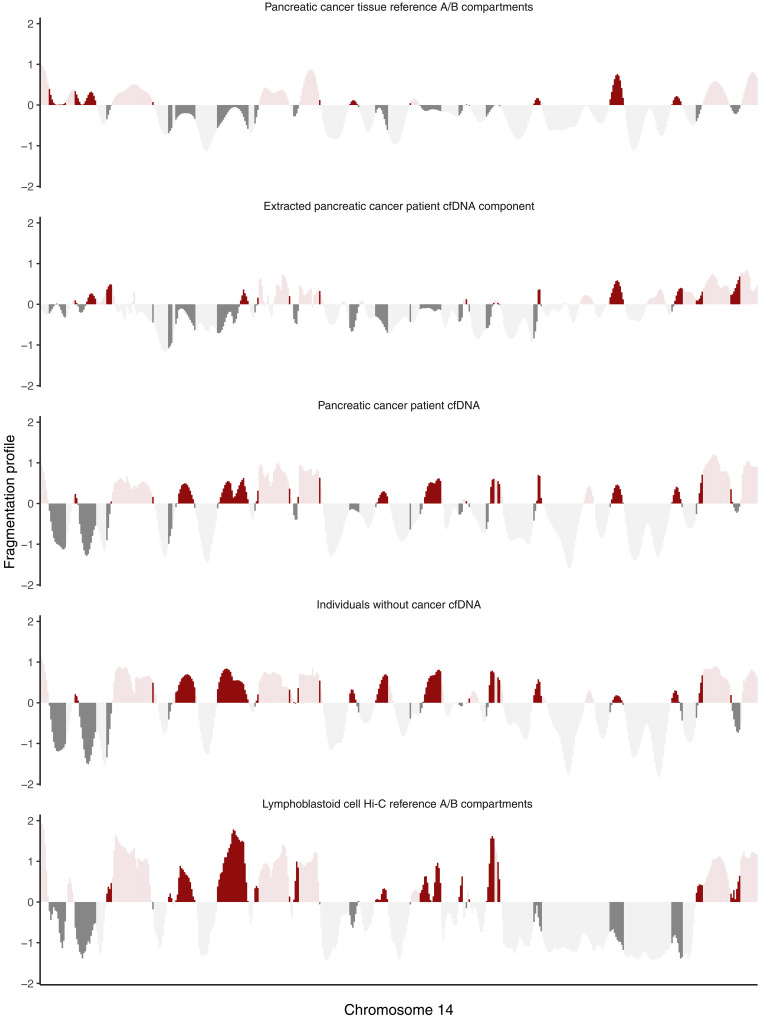
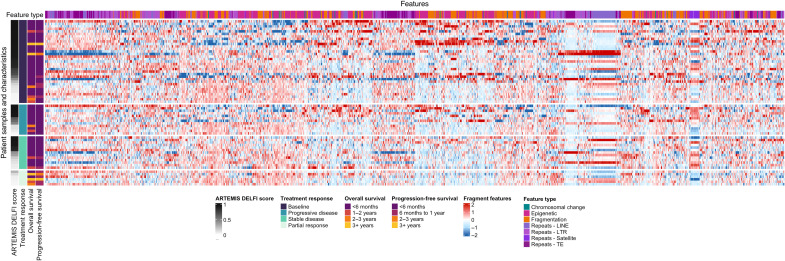
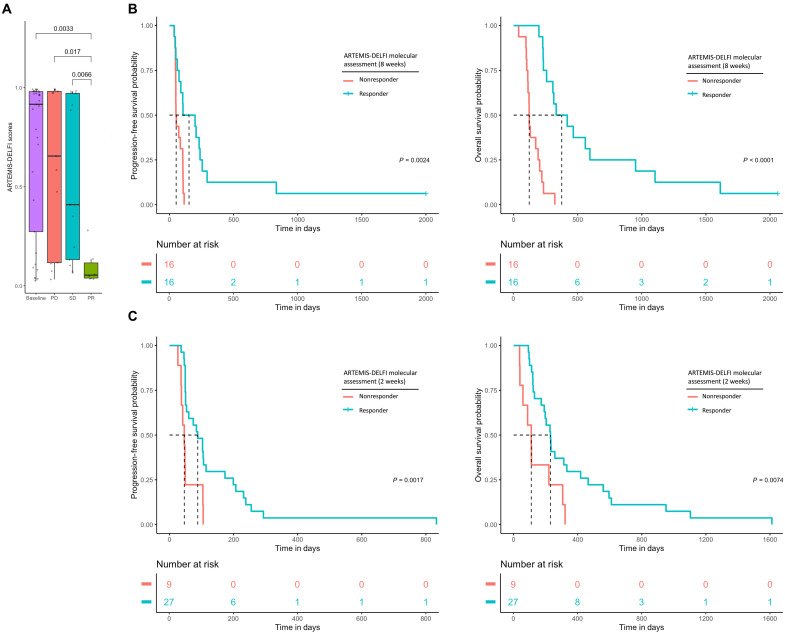
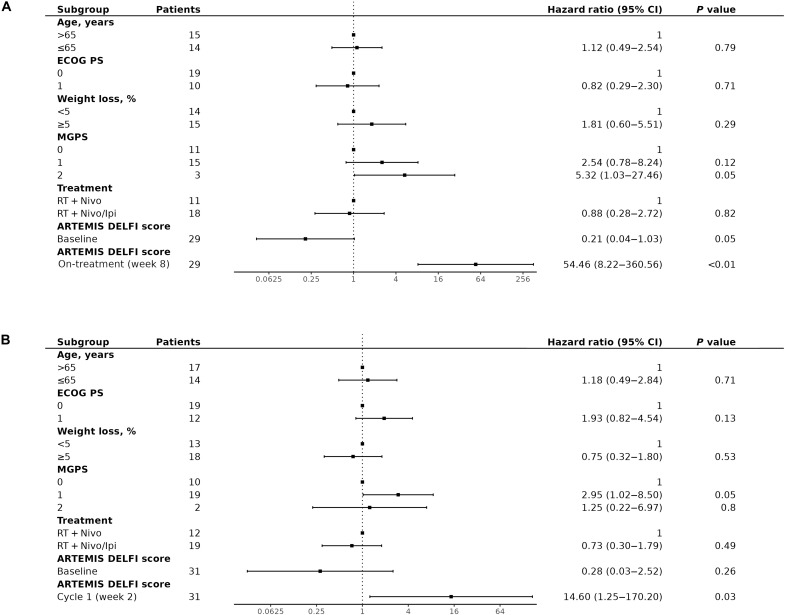
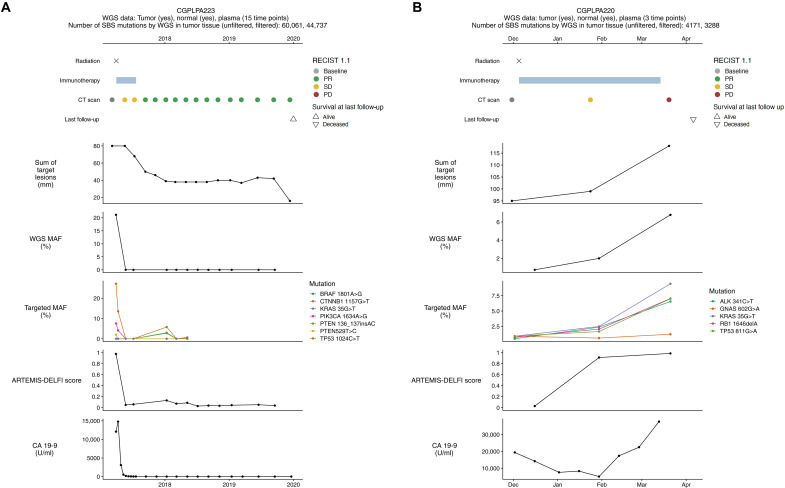
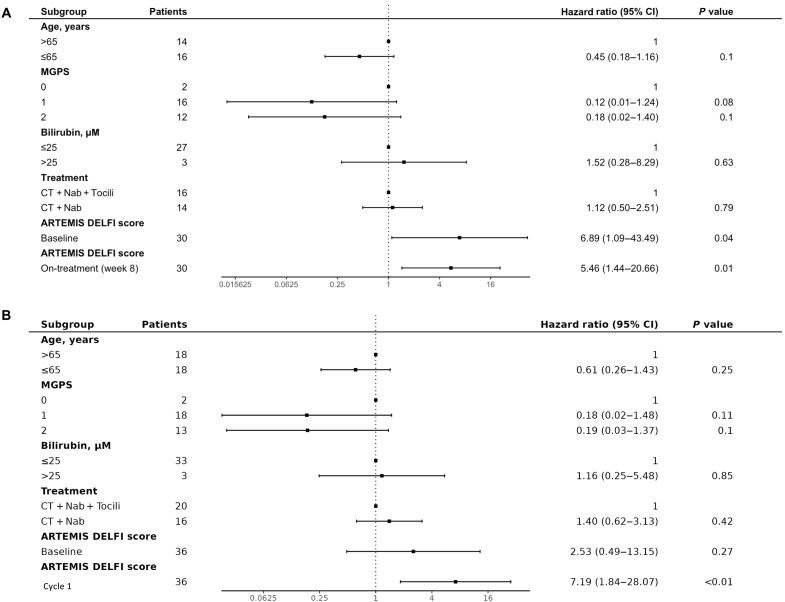
Determining response to therapy for patients with pancreatic cancer can be challenging. We evaluated methods for assessing therapeutic response using cell-free DNA (cfDNA) in plasma from patients with metastatic pancreatic cancer in the CheckPAC trial (NCT02866383). Patients were evaluated before and after initiation of therapy using tumor-informed plasma whole-genome sequencing (WGMAF) and tumor-independent genome-wide cfDNA fragmentation profiles and repeat landscapes (ARTEMIS-DELFI). Using WGMAF, molecular responders had a median overall survival (OS) of 319 days compared to 126 days for nonresponders [hazard ratio (HR) = 0.29, 95% confidence interval (CI) = 0.11-0.79, P = 0.011]. For ARTEMIS-DELFI, patients with low scores after therapy initiation had longer median OS than patients with high scores (233 versus 172 days, HR = 0.12, 95% CI = 0.046-0.31, P < 0.0001). We validated ARTEMIS-DELFI in patients with pancreatic cancer in the PACTO trial (NCT02767557). These analyses suggest that noninvasive mutation and fragmentation-based cfDNA approaches can identify therapeutic response of individuals with pancreatic cancer.


Figures

Fig. 1.
Fig. 1.. Overview of study design and samples.
(A) Schematic of study design showing timeline of treatment, timeline of sample collection, and molecular analyses for both the CheckPAC and the PACTO cohorts. Tumor and WBCs were sequenced from patients in the CheckPAC cohort to generate a list of somatic variants present in tumor. WGMAF values were calculated in plasma samples as the number of mutant observations divided by total number of observations across all mutated positions with tumor-specific somatic mutations. ARTEMIS-DELFI scores were generated with a fixed model using fragmentation patterns, chromosomal gains and losses, and repeat elements as features. These scores were compared to progression-free survival and OS data, and multivariate hazard analyses were performed. (B) Description of CheckPAC and PACTO patients at baseline. Categories show the location of tumor, the number of metastatic sites, the time between initial diagnosis and trial enrollment, prior surgery, smoking status, sex, method of assessment of progression, trial arm, and cancer stage.
Fig. 2.
Fig. 2.. WGMAF approach predicts survival for patients in CheckPAC trial.
(A) Tree plot showing WGMAF levels at baseline and on-treatment as well as tumor cellularity measurements and clinical response for each patient. The section above the dashed line describes evaluable patients, while the section below the dashed line shows patients who were not evaluable because of unavailable tumor or plasma samples or an insufficient number of somatic mutations found in tumor. The number of somatic mutations identified in tumors are listed to the left of the tree plot in descending order, colored by mutation type. Baseline MAF is plotted on the left side of tree plot, and on-treatment MAF is plotted on the right side. The central spine of the tree plot shows the tumor cellularity using two methods, pathological cellularity evaluated from hematoxylin and eosin sample and cellularity assessed from molecular sequencing data, as well as BOR RECIST for each patient. (B) Boxplot of WGMAF values for baseline samples and follow-up samples sorted by clinical PD, SD, and PR. P values were calculated using the Wilcoxon signed-rank test. (C) Kaplan-Meier survival curves showing progression-free survival probability and OS probability based on the median WGMAF value for CheckPAC patients at the second follow-up (on-treatment) plasma evaluation. Nonresponders were classified as those with WGMAF above median value of 0.87%, while responders were classified as those with WGMAF below 0.87%.
Fig. 3.
Fig. 3.. cfDNA fragmentation features reflect underlying tumor biology in pancreatic cancer.
(A) Changes in the cell-free chromosomal arm content in the circulation (plasma z scores) compared to the changes in chromosome arm content in tumors (tumor median log ratio) for patients who had greater than 10% plasma MAF by WGMAF. (B) Fraction of cases with copy number variation (CNV) changes by chromosomal arm for PDAC cancers in TCGA are shown alongside assessment of copy number changes in CheckPAC patients, as quantified by the median log ratio by arm for tumor copy number gains and losses, as well as z scores by arm for all patients with plasma samples at baseline and at follow-up for each of the clinical RECIST 1.1 response categories.
Fig. 4.
Fig. 4.. Genome-wide cfDNA fragmentation profiles comprise chromatin structures from peripheral blood cells and pancreatic cancer.
Comparison of plasma fragmentation features to reference A/B compartments across chromosome 14. The first panel shows chromatin A/B compartments derived from pancreatic cancer tissue methylation (36). The second panel shows a median deconvoluted pancreatic cancer component based on the six samples with the highest ctDNA levels. The third panel shows the median fragmentation profile in the plasma for those samples, and the fourth panel shows the median fragmentation profile for a set of healthy plasma controls. The final panel shows chromatin A/B compartments for lymphoblast cells. Dark shading indicates regions of the genome where the two reference tracks are discordant in domain (open/closed) or magnitude. The extracted pancreatic cancer component has the greatest similarity to the pancreatic cancer reference track, and the healthy plasma has the greatest similarity to the lymphoblast reference track.
Fig. 5.
Fig. 5.. Heatmap of clinical features and cfDNA fragmentation and genomic repeat features.
The vertical axis is categorized by all patients with plasma samples at baseline and at follow-up for each of the clinical RECIST 1.1 response categories and sorted by ARTEMIS-DELFI scores in descending order. All molecular features evaluated are plotted along the horizontal axis and colored by feature type. The heatmap color scale reflects the deviation of cfDNA features as compared to the mean of noncancer individuals.
Fig. 6.
Fig. 6.. ARTEMIS-DELFI scores predict survival for patients in CheckPAC trial.
(A) Boxplot of ARTEMIS-DELFI scores for all patients with plasma samples at baseline, and at follow-up for each of the clinical RECIST 1.1 response categories. (B) Kaplan-Meier curves of progression-free survival probability and OS probability based on median landmark ARTEMIS-DELFI score at 8 weeks. Patients are classified as responders or nonresponders if follow-up ARTEMIS-DELFI scores are below or above the median follow-up score, respectively. (C) Kaplan-Meier curves of progression-free survival probability and OS probability based on “fast-fail” landmark ARTEMIS-DELFI score after one cycle of treatment (2 weeks). Patients are classified as responders or nonresponders if follow-up ARTEMIS-DELFI scores are below or above the median follow-up score, respectively
Fig. 7.
Fig. 7.. Multivariate hazard analyses demonstrate on-treatment ARTEMIS-DELFI scores as independent predictors of OS for patients in the CheckPAC trial.
Multivariate Cox proportional hazard analyses were generated for each molecular method and fit to OS adjusting for clinical subgroups. Each of the indicated subgroups that have been shown to be significant on univariate analyses in previous studies (7) have been included in the multivariate analysis. Hazard models are shown using (A) ARTEMIS-DELFI scores at baseline and 8-week follow-up values for patients in the CheckPAC study and (B) ARTEMIS-DELFI scores at baseline and after one cycle of treatment for patients in the CheckPAC study.
Fig. 8.
Fig. 8.. Example of a molecular responder and nonresponder to treatment using different methodologies.
Response to treatment is shown for a patient with clinical BOR of partial response (A) and stable disease (B). Patient clinical paths are shown in the top panels, followed by methodologies for monitoring response to treatment. For the top panels, patient treatment is indicated in the top two rows, radiologic assessments are plotted in the third row, and the last follow-up is indicated in the fourth row. Sum of target lesions were assessed from standard-of-care CT scans. WGMAF, targeted MAF, and ARTEMIS-DELFI scores are plotted for each of the blood draw time points. CA19-9 was measured clinically at regular intervals throughout treatment.
Fig. 9.
Fig. 9.. Multivariate hazard analyses demonstrate on-treatment ARTEMIS-DELFI scores as independent predictors of OS for patients in the PACTO trial.
Multivariate Cox proportional hazard analyses were generated for each molecular method and fit to OS adjusting for clinical subgroups. Each of the indicated subgroups that have been shown to be significant on univariate analyses were included in the multivariate analysis. Hazard models are shown using (A) ARTEMIS-DELFI scores at baseline and 8-week follow-up for patients in the PACTO study and (B) ARTEMIS-DELFI scores at baseline and after one cycle of treatment for patients in the PACTO study.

Similar articles

References

    1. Sung H., Ferlay J., Siegel R. L., Laversanne M., Soerjomataram I., Jemal A., Bray F., Global Cancer Statistics 2020: GLOBOCAN estimates of incidence and mortality worldwide for 36 cancers in 185 countries. CA Cancer J. Clin. 71, 209–249 (2021). - PubMed
    1. Rishi A., Goggins M., Wood L. D., Hruban R. H., Pathological and molecular evaluation of pancreatic neoplasms. Semin. Oncol. 42, 28–39 (2015). - PMC - PubMed
    1. Siegel R. L., Miller K. D., Wagle N. S., Jemal A., Cancer statistics, 2023. CA Cancer J. Clin. 73, 17–48 (2023). - PubMed
    1. Ducreux M., Cuhna A. S., Caramella C., Hollebecque A., Burtin P., Goéré D., Seufferlein T., Haustermans K., Laethem J. L. V., Conroy T., Arnold D., ESMO Guidelines Committee , Cancer of the pancreas: ESMO clinical practice guidelines for diagnosis, treatment and follow-up. Ann. Oncol. 26, v56–v68 (2015). - PubMed
    1. Fan J. Q., Wang M.-F., Chen H.-L., Shang D., Das J. K., Song J., Current advances and outlooks in immunotherapy for pancreatic ductal adenocarcinoma. Mol. Cancer 19, 32 (2020). - PMC - PubMed