. 2025 May 23;11(21):eads4970.
doi: 10.1126/sciadv.ads4970. Epub 2025 May 21.

Communication of perceptual predictions from the hippocampus to the deep layers of the parahippocampal cortex

Affiliations

Communication of perceptual predictions from the hippocampus to the deep layers of the parahippocampal cortex

Oliver Warrington et al. Sci Adv. .

Abstract

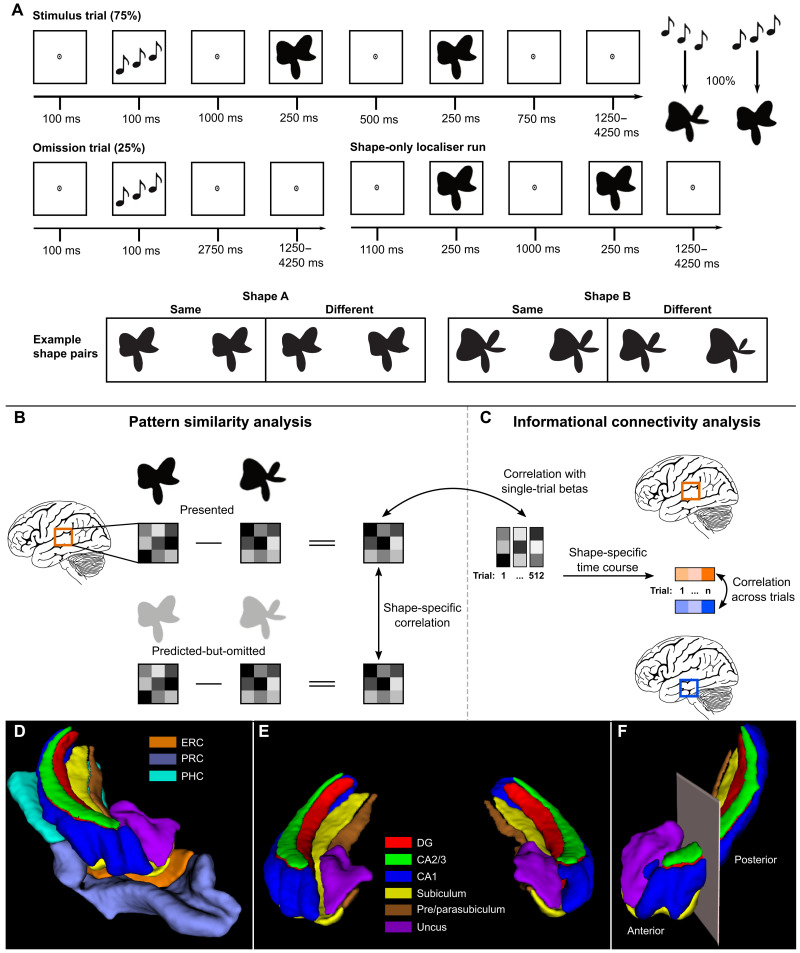
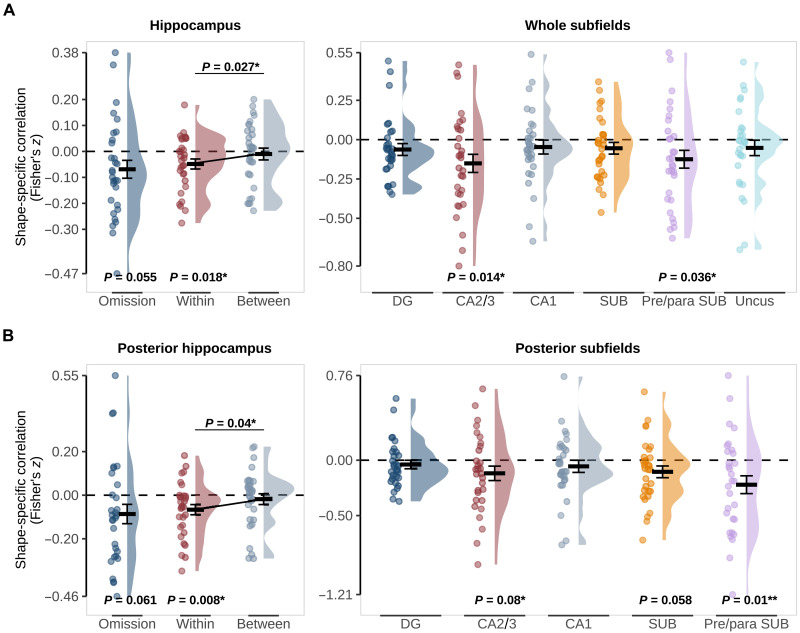
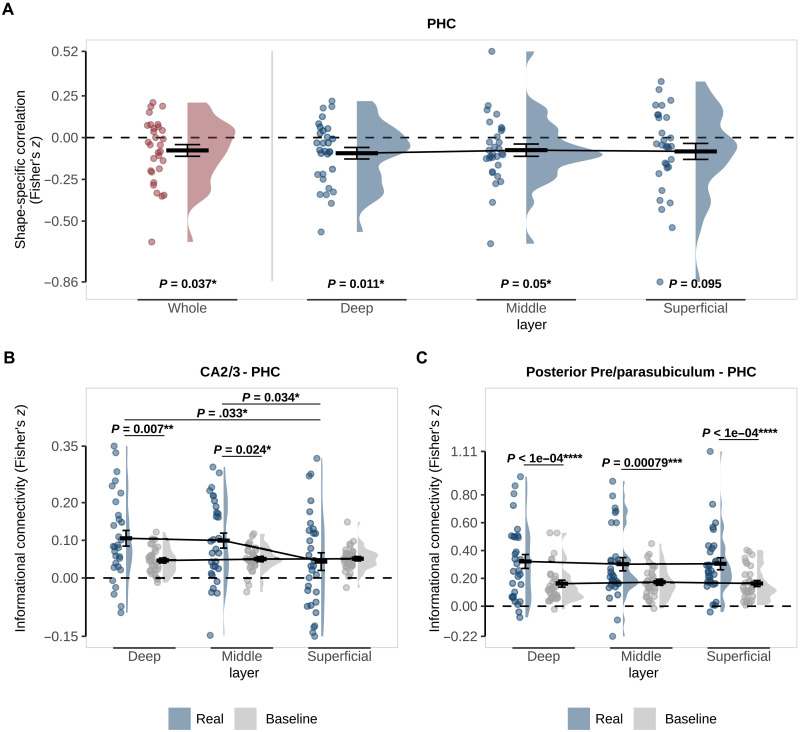
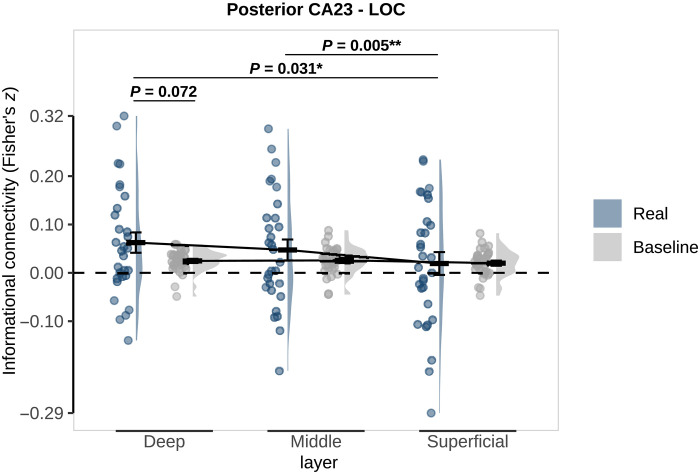
Current evidence suggests that the hippocampus is essential for exploiting predictive relationships during perception. However, it remains unclear whether the hippocampus drives the communication of predictions to sensory cortex or receives prediction signals from elsewhere. We collected 7-tesla fMRI data in the medial temporal lobe (MTL) while auditory cues predicted abstract shapes. Strikingly, neural patterns evoked by predicted shapes in CA2/3, pre/parasubiculum, and the parahippocampal cortex (PHC) were negatively correlated to patterns evoked by the same shapes when actually presented. Using layer-specific analyses, we ask: In which direction are predictions communicated between the hippocampus and neocortex? Superficial layers of the MTL cortex project to the hippocampus, while the deep layers receive feedback projections. Informational connectivity analyses revealed that communication between CA2/3 and PHC was specific to the deep layers of PHC. These findings suggest that the hippocampus generates predictions through pattern completion in CA2/3 and feeds these predictions back to the neocortex.


Figures

Fig. 1.
Fig. 1.. Overview of experimental paradigm and analysis.
(A) Prediction runs included stimulus and omission trials. In stimulus trials, the auditory cue preceded the presentation of two consecutive shape stimuli. The second shape was identical to the first or slightly warped. Participants’ task was to report whether the shapes were the same or different. During prediction runs, the auditory cue (ascending versus descending tones) predicted whether the first shape on that trial would be A or B. The cue was valid in 75% of trials (stimulus trials), whereas the expected shape was omitted in the other 25% of trials (omission trials). On omission trials, participants had no task. In the shape-only localizer run participants performed the same shape-discrimination task without auditory cues. (B) To perform the pattern similarity analysis, the activity patterns of shape B were subtracted from shape A separately for presented shapes and predicted-but-omitted shapes. We then used Pearson’s correlation to determine the pattern similarity between presented and predicted-but-omitted shapes for each region of interest. (C) To perform the informational connectivity analysis, the shape-specific activity pattern from the localizer was correlated with single-trial betas from the omission trials for each region to generate a shape-specific time course of information. We then correlated these timecourses between regions to determine their shared fluctuations in shape information. (D) 3D render of a representative MTL and hippocampal subfield segmentation of one hemisphere viewed from the anterior perspective. (E) 3D render of a representative hippocampal subfield segmentation of both hemispheres viewed from the anterior perspective. (F) 3D render of the anterior-posterior boundary viewed from the anterolateral perspective. The boundary was defined as the last coronal slice in which the uncus was visible. Segmentations were generated with the ASHS toolbox (79) trained on an atlas of manual 7-T segmentations (80).
Fig. 2.
Fig. 2.. Pattern similarity between predicted-but-omitted shapes and presented shapes in the hippocampus.
(A) Whole Hippocampus (left) and subfields (right). (B) Posterior Hippocampus (left) and subfields (right). “Omission” reflects similarity in shape-specific (shape A − shape B) activity patterns in the localizer and omission trials with P values for a two-sided, one-sample t test against 0. “Within” and “Between” reflect pattern similarity within the same shape (e.g., shape A presented − shape A omitted) and between shapes (e.g., shape A presented − shape B omitted) with P values for a two-sided, paired t test. Crossbars and error bars represent the mean and SEM, respectively. Individual subject values are plotted in points alongside the probability density estimate.
Fig. 3.
Fig. 3.. Representations and connectivity of PHC during omission trials.
(A) Pattern similarity analysis in PHC as a whole (red) and specific to the deep, middle, and superficial layers (blue). Pattern similarity reflects the correlation between shape-specific (shape B − shape A) activity patterns in the localizer and omission trials with P values for a two-sided, one-sample t test against 0. (B) Informational connectivity of CA2/3 and (C) posterior pre/parasubiculum with PHC layers. Real connectivity (blue) is the observed correlation between regions on omission trials. Baseline connectivity (gray) was calculated by randomly shuffling the shape labels across 100 permutations. P values represent post hoc paired t tests investigating the differences between real and baseline and across layers. For all figures, crossbars and error bars represent the mean and SEM, respectively. Individual subject values are plotted in points alongside the probability density estimate.
Fig. 4.
Fig. 4.. Layer-specific informational connectivity between posterior CA2/3 and LOC during omission trials.
Real connectivity (blue) is the observed correlation between regions on omission trials. Baseline connectivity (gray) was calculated by randomly shuffling the shape labels across 100 permutations. P values represent post hoc paired t tests investigating the differences between real and baseline and across layers. Crossbars and error bars represent the mean and SEM, respectively. Individual subject values are plotted in points alongside the probability density estimate.

Similar articles

References

    1. De Lange F. P., Heilbron M., Kok P., How do expectations shape perception? Trends Cogn. Sci. 22, 764–779 (2018). - PubMed
    1. Barron H. C., Auksztulewicz R., Friston K., Prediction and memory: A predictive coding account. Prog. Neurobiol. 192, 101821 (2020). - PMC - PubMed
    1. Nadel L., Peterson M. A., The hippocampus: Part of an interactive posterior representational system spanning perceptual and memorial systems. J. Exp. Psychol. Gen. 142, 1242–1254 (2013). - PubMed
    1. Schapiro A. C., Kustner L. V., Turk-Browne N. B., Shaping of object representations in the human medial temporal lobe based on temporal regularities. Curr. Biol. 22, 1622–1627 (2012). - PMC - PubMed
    1. Hindy N. C., Ng F. Y., Turk-Browne N. B., Linking pattern completion in the hippocampus to predictive coding in visual cortex. Nat. Neurosci. 19, 665–667 (2016). - PMC - PubMed

LinkOut - more resources