. 2025 May 23;11(21):eadv1171.
doi: 10.1126/sciadv.adv1171. Epub 2025 May 21.

The end-Cretaceous mass extinction restructured functional diversity but failed to configure the modern marine biota

Affiliations

The end-Cretaceous mass extinction restructured functional diversity but failed to configure the modern marine biota

Stewart M Edie et al. Sci Adv. .

Abstract

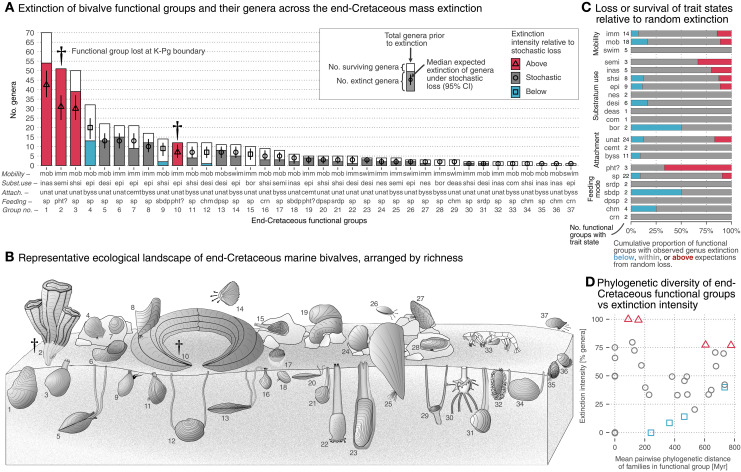
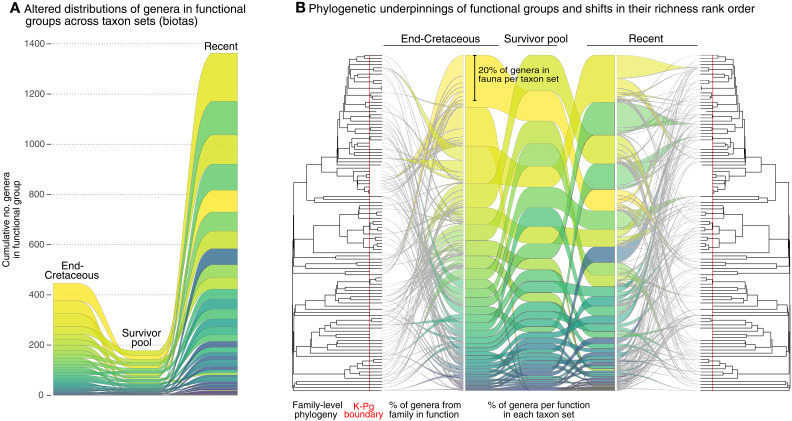
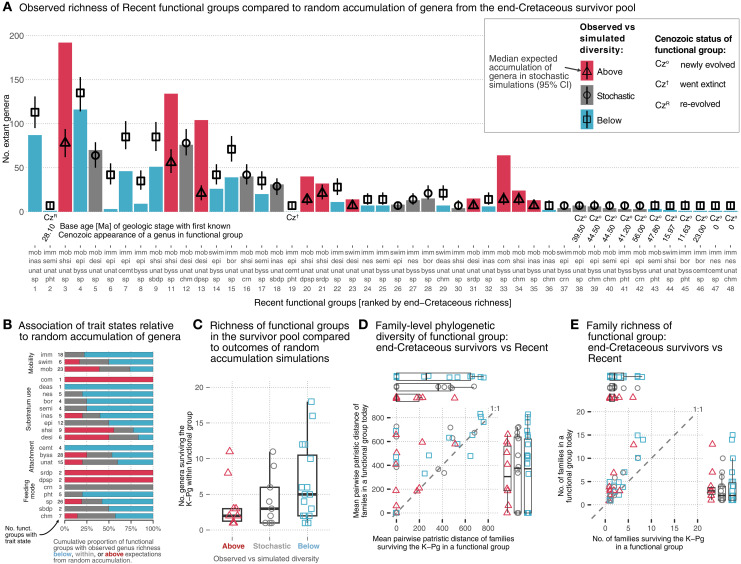
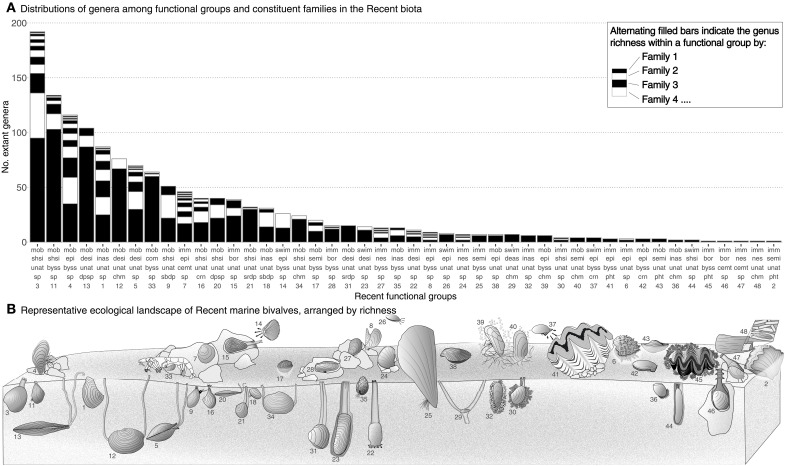
The end-Cretaceous (K-Pg) mass extinction shows how large-scale taxonomic loss affects functional diversity over short and long timeframes. In a macroevolutionary model system, we find that, despite losing ~60% of genera and ~20% of family-level diversity, marine bivalves lost only ~5% of their functional diversity, inconsistent with random extinction. Even with evolutionary opportunities presented by a disrupted ecosystem, low-diversity groups prior to the extinction or those originating in the Cenozoic rarely reach higher ranks today, implying long-term diversity ceilings to certain ecological roles. Clades that survived the extinction tend to dominate functions today, 66 million years post-extinction, but both relative richness and phylogenetic structure of those functional groups have been significantly shuffled. Thus, neither the composition of the pre-extinction biota nor the set of taxa that survived the extinction fully accounts for the functional and phylogenetic structure of today's biota. The extinction disrupted Mesozoic biodiversity but did not fully determine the present-day configuration.


Figures

Fig. 1.
Fig. 1.. Extinction dynamics of marine bivalve functional groups across the end-Cretaceous mass extinction (~66 Ma).
(A) Observed extinction intensity of genera within functional groups compared to random loss. CI, confidence interval. (B) Representative members of end-Cretaceous functional groups in life position, arranged by rank of genus richness in (A). Illustrations are not to scale but do reflect general differences in the sizes of taxa. Abbreviations for functional states: Mobility—imm, immobile; mob, mobile; swim, swimming; Substratum use—bor, borer; com, commensal; deas, deep infaunal asiphonate; desi, deep infaunal siphonate; epi, epifaunal; inas, infaunal asiphonate; nes, nestler; semi, semi-infaunal; shsi, shallow infaunal siphonate; Attachment—byss, byssate; cemt, cemented; unat, unattached; Feeding mode—chm, chemosymbiotic; crn, carnivore; dpsp, mixed deposit/suspension; pht, photosymbiotic; sbdep, subsurface deposit; srdp, surface deposit; sp, suspension. †, extinct functional group. “Group numbers” are unique to a functional group and shared across all figures. (C) Association of functional trait states with the extinction intensity of genera in functional groups. For example, three functional groups include the semi-infaunal state, and one of those groups (i.e., 33% of the total) had higher than expected genus extinction compared to random loss. (D) Phylogenetic diversity of functional groups prior to the K-Pg event compared to their extinction intensity of genera. Symbols and colors show the observed extinction intensity in a functional group relative to random loss as in (A).
Fig. 2.
Fig. 2.. Shifting distributions of genera within functional groups and their phylogenetic underpinnings among the end-Cretaceous, survival pool, and Recent biotas.
(A) Changes in absolute richness of genera within functional groups between the end-Cretaceous biota, the survivor pool, and today. Warmer colors indicate higher genus richness. Mixing of the color gradient in the survivor pool and Recent biota indicates shifts in the richness rank order of functional groups. (B) Phylogenetic underpinnings of functional group composition for the end-Cretaceous and Recent biotas. The proportion of genera in a functional group per family is reflected by the widths of ribbons connecting the tips of the family-level phylogeny to functional groups. The middle panel shows the proportional changes in genus richness of functional groups among taxon sets. The connections between the taxon sets are to visualize shifts in the rank order of functional groups and do not imply smooth transitions between them.
Fig. 3.
Fig. 3.. Marine bivalve functional diversity in the Recent biota relative to random diversity accumulation from the end-Cretaceous survival pool.
(A) Genus richness of Recent functional groups arrayed by their richness rank in the end-Cretaceous biota; observed richness is compared to the expectations from the random accumulation of genera starting from the distribution of genera in the survivor pool. Functional abbreviations as in Fig. 1B. (B) Richness of functional trait states in the Recent biota relative to the expectation of random accumulation of genera. For example, all three of the functional groups with cemented attachment accumulated fewer genera than expected. (C) Number of genera surviving within a functional group compared to its Recent richness relative to random accumulation. (D) Phylogenetic diversity of families surviving the K-Pg event within a functional group compared to the phylogenetic diversity of families within the group today. Boxplots along axes show the phylogenetic diversity of families surviving the K-Pg event within functional groups (top) and for the entire Recent biota (right). (E) Number of families surviving the K-Pg event within a functional group compared to the number of families within the group today. Boxplots along axes show the numbers of families surviving the K-Pg event within functional groups (top) and for the entire Recent biota (right).
Fig. 4.
Fig. 4.. Ecological landscape of marine bivalves in the Recent biota and its taxonomic underpinnings.
(A) Genus richness of functional groups today, showing the distribution of genus richness per family within groups as alternating black and white bars. Functional abbreviations as in Fig. 1B. (B) Representative members of Recent functional groups in life position, arranged by rank of genus richness [see numbers along the x axis in (A)].
Fig. 5.
Fig. 5.. Taxonomic incumbency from the K-Pg event and its relation to the richness structure of functional groups in the Recent biota.
(A) The number of genera today from families surviving the K-Pg event within a functional group compared to the number of genera from families entering the functional group during the Cenozoic. Blue points show genus richness from families that lost a function at the K-Pg event but re-evolved it in the Cenozoic. (B) As in (A), but for functional groups that evolved during the Cenozoic. Data for both axes are integers, but points are jittered slightly to show overlap of multiple functional groups in the space.

Similar articles

References

    1. Cole S. R., Hopkins M. J., Selectivity and the effect of mass extinctions on disparity and functional ecology. Sci. Adv. 7, eabf4072 (2021). - PMC - PubMed
    1. Novack-Gottshall P. M., Sultan A., Smith N. S., Purcell J., Hanson K. E., Lively R., Ranjha I., Collins C., Parker R., Sumrall C. D., Deline B., Morphological volatility precedes ecological innovation in early echinoderms. Nat. Ecol. Evol. 6, 263–272 (2022). - PubMed
    1. Marshall C. R., Forty years later: The status of the “Big Five” mass extinctions. Camb. Prism Extinct. 1, e5 (2023). - PMC - PubMed
    1. Polly P. D., Extinction and morphospace occupation: A critical review. Camb. Prism Extinct. 1, e17 (2023). - PMC - PubMed
    1. Jablonski D., Edie S. M., Mass extinctions and their rebounds: A macroevolutionary framework. Paleobiology 51, 1–14 (2025).

LinkOut - more resources