. 2025 May 23;11(21):eadv0558.
doi: 10.1126/sciadv.adv0558. Epub 2025 May 21.

Sphingolipid synthesis in tumor-associated macrophages confers immunotherapy resistance in hepatocellular carcinoma

Affiliations

Sphingolipid synthesis in tumor-associated macrophages confers immunotherapy resistance in hepatocellular carcinoma

Xiaozhen Zhang et al. Sci Adv. .

Abstract

Dysregulated metabolism of immune cells in the tumor microenvironment leads to immune evasion and tumor progression. As a major cell component in the tumor, the metabolic reprogramming of tumor-associated macrophages (TAMs) creates an immunosuppressive microenvironment in hepatocellular carcinoma (HCC). Our study found that sphingolipid (particularly, sphingosine-1-phosphate or S1P) levels are a clinical indicator for prognosis and immunotherapy response in patients with HCC. S1P primarily derived from TAMs, where NIMA-related kinase 2 (NEK2) plays a key role in controlling the activity of serine palmitoyl-CoA transferase, a rate-limiting enzyme in S1P biosynthesis. The S1P produced by NEK2hi TAMs promotes hepatic tumor progression and confers immunotherapy resistance. Targeting S1P synthesis with a NEK2 inhibitor or S1P antagonist disrupted the immunosuppressive function of macrophages, shifted regulatory T cells (Tregs) to TH17 cells, and increased the number and activity of tumor-infiltrating T effectors, thereby enhancing antitumor efficacy in synergy with immune checkpoint blockade therapy.


Figures
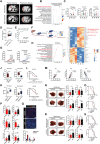
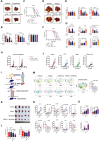
Fig. 1.
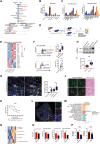
Fig. 1.. S1P metabolism is elevated in the αPD-1 resistance group and contributes to HCC progression in an immune-dependent manner.
(A) Represent images of responder (PR) and nonresponder (PD) in a clinical trial. (B) KEGG by LC-MS metabonomics of serum in the responder group (n = 20)/nonresponder group (n = 10). TCA, tricarboxylic acid; cAMP, cyclic adenosine 3′,5′-monophosphate. (C) S1P, sphinganine, and SM levels in serum from patients with CR, PR, SD, and PD treated with sintilimab. (D) S1P level in serum from patients before and after sintilimab treatment. (E) ROC evaluating of S1P as a predictive biomarker for immunotherapy response. AUC, area under the curve. (F) Schematic of model establishment, sample collection, and analysis. (G) Tumor volume changes in huHSC-NCG mice treated with sintilimab (responder versus nonresponder). (H and I) KEGG and heatmap analysis of tumor tissues in responder (R)/nonresponder (NR) groups by LC-MS metabonomics. GPI, glycosylphosphatidylinositol; PE, phosphatidylethanolamine; PI, phosphatidylinositol; PA, phosphatidic acid; PS, phosphatidylserine; PC, phosphatidylcholine; PG, phosphatidylglycerol. (J and K) S1P level in serum and tissue lysates from HCC, benign, stage I to II, and stage III to IV patients. (L) Relapse-free survival (RFS) and overall survival (OS) of patients with HCC between low and high serum S1P. (M) Correlation of CD206+ TAMs, FOXP3+ Tregs, CD8+ T cells, and tissue S1P levels in HCC. (N and O) Representative images, statistics, and survival curve of immunocompetent mice treated with vehicle/S1P in orthotopic and HTVi models. (P) Flow cytometry of tumor tissues in orthotopic model (vehicle versus S1P). (Q) Immunofluorescence of tumor tissues in HTVi model (vehicle versus S1P). (R and S) Representative images, statistics, and survival curve of immunodeficient mice treated with vehicle/S1P in orthotopic/HTVi model. *P < 0.05, **P < 0.01, and ****P < 0.0001. ns, not significant. Using a two-tailed, unpaired Student’s t test [(I), (J), (M), (O), (P), and (Q)], nonparametric test, post hoc comparison is Dunn’s test [S1P in (C)], one-way analysis of variance (ANOVA) test post hoc comparison is Tukey test [sphinganine/SM in (C)], Pearson correlation test (L), or log-rank test [(K), (N), and (R)]. Data are from ≥3 independent experiments (means ± SD).
Fig. 2.
Fig. 2.. S1P metabolism mediates an immunosuppressive phenotype and reprograms immunometabolism.
(A) Flow cytometric analysis of TAMs with vehicle and S1P. (B) Expression of genes encoding M2 and M1 phenotype in macrophages with vehicle and S1P (20 μM) by reverse transcription polymerase chain reaction (RT-PCR). (C) MitoTracker Green of TAMs with vehicle and S1P (20 μM). (D) Representative images and statistical results of mitochondrial (red arrowheads) of TAMs with vehicle and S1P by TEM. (E and F) ATP determination and Seahorse analysis in TAMs with vehicle and S1P. 2-DG, 2-deoxyglucose. (G) Proliferation measured by CFSE in CD8+ T cells with vehicle and S1P (20 μM). (H) Expression of genes encoding function of CD8+ T effector cells (Teff) and CD8+ T exhausted cells (Tex) with vehicle and S1P (20 μM) by RT-PCR. (I) Statistical results of GZMB and tumor necrosis factor–α (TNFα) in CD8+ T cells with vehicle and S1P (20 μM). (J) OT-1 T cell–meditated tumor cell killing assay in Hep-53.4 OVA treated with vehicle and S1P. (K) Ex vivo suppression of CFSE-labeled WT naïve CD8+ T cell proliferation by Tregs with vehicle and S1P (10 μM). (L) Expression of genes encoding function of Tregs and TH17 cells with vehicle and S1P (10 μM) by RT-PCR. (M) Statistical results of FoxP3 and IL-17A in CD4+ T with vehicle and S1P. (N to P) MitoTracker Green, Seahorse analysis and ATP determination of CD8+ T cells with vehicle and S1P (20 μM). (Q to S) MitoTracker Green, Seahorse analysis, and ATP determination of Tregs with vehicle and S1P (10 μM). *P < 0.05, **P < 0.01, ***P < 0.001, and ****P < 0.0001. Using a two-tailed, unpaired Student’s t test [(A), (C), (D), (E), (F), (G), (I), (J), (K), and (M) to (S)]. Data are from ≥3 independent experiments (means ± SD).
Fig. 3.
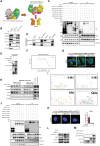
Fig. 3.. NEK2hi TAMs, which was the main source of S1P-related metabolites, were identified as a driver for immunotherapy resistance.
(A) Biochemical pathways for de novo S1P and SM synthesis. ADP, adenosine diphosphate; Pi, inorganic phosphate. (B) SPTLC activity of tumor cell and immune cell sorting from HCC tissues (n = 5). (C) Concentration analysis of S1P by ELISA in cell culture lysates and medium of indicated cells. (D) Schematic diagram showing the process of model establishment, sample collection, and analysis. (E) RNA-seq analysis of HCC-associated TAMs in responder and nonresponder groups. (F) Representative histograms further quantification of NEK2 in TAMs isolated from para-tumor, tumor, responder, and nonresponder samples (n = 5). (G) Representative images and statistical results showing immunofluorescence staining of indicated antibodies in para-tumor, tumor, responder, and nonresponder sample (n = 9). (H) Western blot of NEK2 in TAMs isolated from para-tumor (normal), tumor, responder, and nonresponder samples. (I) Mean fluorescence intensity (MFI) analysis of NEK2hi TAMs in tumor tissue from stage I to II (n = 7) and stage III to IV patients (n = 7). (J) Representative images showing immunofluorescence staining of NEK2hi TAMs in well differentiated and poorly differentiated samples. H&E, hematoxylin and eosin. (K) Correlation of NEK2 in TAMs with prognostic factors in patients with HCC. (L) Multiple IHC labeling using indicated antibodies in tumor tissues. (M and N) KEGG and heatmap analysis of TAMs by LC-MS metabonomics from WT and Nek2cKO mice. CGMP-PKG, cyclic guanosine monophosphate-protein kinase G signaling pathway. (O) Concentration analysis of S1P and sphinganine by ELISA in cell culture lysates and medium of TAMs from WT and Nek2cKO mice. (P) SPTLC activity of TAMs from WT and Nek2cKO mice or with a NEK2 inhibitor (10 μM) (n = 5). *P < 0.05, **P < 0.01, ***P < 0.001, and ****P < 0.0001. Using a two-tailed, unpaired Student’s t test [(F), (G), (I), (O), and (P)] or log-rank test (K). Data are from ≥3 independent experiments (means ± SD). DAPI, 4′,6-diamidino-2-phenylindole.
Fig. 4.
Fig. 4.. NEK2 phosphorylates SPTLC1 at S401 to promote kinase metabolic activity.
(A) Docking model of NEK2 (2XNM) and SPTLC1/SPTLC2 complex (7K0M). (B) Cell lysates from BMDMs analyzed by immunoprecipitation (IP) and Western blot using the antibodies indicated. (C) Western blot analysis of whole-cell lysates and anti-Flag IP derived from 293T cells transfected with indicated constructs. Cells were treated with 10 μM MG132 for 12 hours before harvesting. (D) IP and Western blot using the antibodies indicated in cell lysates from BMDMs. Representative images are shown. (E) GST pull-down assay of NEK2-His and GST-SPTLC1 protein. Representative images are shown. n = 3 independent experiments. (F) Microscale thermophoresis (MST) analysis of NEK2-SPTLC1 interaction measurements. (G) Representative images of individual immunofluorescence staining of NEK2 and SPTLC1 interaction in BMDM cells by Duolink assay combined with immunofluorescence staining using markers for ER (HSP90B1) and nuclei (DAPI). The red dots (NEK2/PD-L1 interaction) indicate their interaction. (H) Trypsin digestion of ER fractions with or without permeabilization in BMDM cells. Representative image is shown, n = 3 independent experiments. (I) SPTLC1 phosphorylation at the S401/S381/S404/S50 residues were identified by MS analysis. (J) Immunoblotting (IB) analysis of Input and anti-Flag IP derived from 293T cells transfected with indicated constructs. Cells were treated with 10 μM MG132 for 12 hours before harvesting. (K) Representative images and statistical results of individual immunofluorescence staining of the NEK2 and SPTLC1 interaction in BMDM cells by a Duolink assay. The red dots (NEK2/SPTLC1 interaction) indicate their interaction. (L) IB analysis of S401-phosphorylated SPTLC1 in BMDM cells with NEK2 inhibitor (10 μM, 48 hours) and NEK2 KO BMDM. (M) In vitro kinase assay and IB analysis of pS401-SPTLC1 expression of recombinant SPTLC1 WT and NEK2 (active) protein. Representative images are shown. n = 3 independent experiments. IgG, immunoglobulin G; GFP, green fluorescent protein; HA, hemagglutinin; m/z, mass/charge ratio.
Fig. 5.
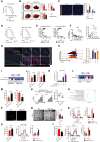
Fig. 5.. NEK2 in macrophages drives hepatocarcinogenesis and progress.
(A) Tumor incidence in WT and Nek2cKO mice (n = 9). (B) Representative images and statistical results of tumor in WT/Nek2cKO mice by orthotopic and HTVi model. (C) mIHC analysis of CD8+ T cells and Foxp3+ Tregs in WT and Nek2cKO mice tumors. (D) Survival of WT and Nek2cKO mice in HTVi and orthotopic model. (E) Immunophenotype analysis of NEK2hi TAMs and NEK2low TAMs in patients’ HCC and HTVi mice. (F) Correlation of NEK2hi TAMs with CD8+ T cells or Tregs in a tissue microarray. (G) mIHC spatial staining of NEK2hi TAMs, CD8+ T cells, and FOXP3+ Tregs in patients’ HCC tumors. (H) CFSE-based proliferation of CD8+ T cells cocultured with WT/Nek2cKO TAMs. (I and J) RT-PCR analysis of CD8+ Teff/Tex and GZMB and TNFα expression in CD8+ T cells cocultured with WT/Nek2cKO TAMs. (K) OT-1 T cell–meditated killing of Hep-53.4 OVA with WT/Nek2cKO TAMs. (L and M) RT-PCR analysis of Tregs and TH17 cells and flow cytometric analysis of Foxp3/IL-17A in Tregs cocultured with WT/Nek2cKO TAMs. (N) Ex vivo suppression of CFSE-labeled WT naïve CD8+ T cell proliferation by Tregs cocultured with WT/Nek2cKO TAMs. (O) KEGG analysis by LC-MS energy reanalysis of WT/Nek2cKO TAMs. (P) MitoTracker Green of WT/Nek2cKO TAMs. (Q) TEM analysis of mitochondrial (red arrowheads) from WT and Nek2cKO TAMs. (R) Representative OCR of WT and Nek2cKO TAMs. (S and T) MitoTracker Green and Seahorse analysis of CD8+ T cells and Tregs cocultured with WT/Nek2cKO TAMs. *P < 0.05, **P < 0.01, ***P < 0.001, and ****P < 0.0001. Using a two-tailed, unpaired Student’s t test [(B), (C), (H), (J), (K), (M), (N), (Q), (R), (S), and (T)], Pearson correlation test (F), or log-rank test [(A) and (D)]. Data are from ≥3 independent experiments (means ± SD).
Fig. 6.
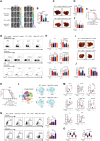
Fig. 6.. NEK2 deficiency in TAMs sensitizes PD-1–targeted HCC immunotherapy.
(A and B) Representative photograph and statistical results of the IVIS imaging system in mice orthotopically implanted with luciferase-expressing Hep-53.4 in Nek2cKO genetic mice in combination with αPD-1 treatment (200 μg per mouse, every 2 days, ip) (n = 7). (C and D) Representative images and statistical results of tumor in Nek2cKO genetic mice in combination with αPD-1 treatment (n = 7). (E) Survival curve of orthotopic tumor implantation in Nek2cKO genetic mice (n = 7). (F) The statistical results of spleen weight of Nek2cKO genetic mice in combination with αPD-1 treatment (n = 7). (G and H) Representative images and statistical results of immune cells in Nek2cKO genetic mice in combination with αPD-1 treatment (n = 7). (I and J) Representative images displaying tumors, tumor weight, and mouse weight of Nek2cKO genetic mice treated with αPD-1(200 μg per mouse, every 2 days, ip) in the HTVi model (n = 5). (K) Survival curve of HTVi model in Nek2cKO genetic mice in combination with αPD-1 (n = 9). (L) Plots of t-distributed stochastic neighbor embedding (tSNE) showing the distinct immune landscape of tumors in the different treatment groups. (M) Proportions of immune cell types in the four treatment groups (n = 5). MHC-II, major histocompatibility complex class II. (N) Flow cytometric analysis and statistical results of functional indication of lymphocytes that have infiltrated the tumors (n = 5). (O) Concentration analysis of S1P by ELISA in tissue lysates and serum from Nek2cKO mice in combination with αPD-1. *P < 0.05, **P < 0.01, and ***P < 0.001. Using a two-tailed, unpaired Student’s t test (O), using one way ANOVA, with post hoc comparisons conducted using Tukey’s test [(B), (D), (F), (H), (J) and (M)] or log-rank test [(E) and (K)]. Data are from ≥3 independent experiments (mean ± SD).
Fig. 7.
Fig. 7.. The S1P antagonist or NEK2 inhibitor and PD-1 antagonist combination eradicates HCC in humanized mouse model.
(A and B) Representative images and statistical results showing tumors harvested from the orthotopic model treated with the αPD-1 (200 μg per mouse, every 2 days, ip), fingolimod (10 mg/kg, every day, ip), or their combination (n = 7). (C) Survival curve of combination therapy in orthotopic model (n = 7). (D and E) Representative images and statistical results showing tumors harvested from the HTVi model treated with the αPD-1 (200 μg per mouse, every 2 days, ip), NEK2 inhibitor (5 mg/kg, every 2 days), or their combination (n = 7). (F) Survival curve of combination therapy in the HTVi model. (G) Statistical results of lymphocytes that have infiltrated the tumors (n = 7) by flow cytometric analysis. (H) Tumor growth curve of mice in individual groups is shown (n = 7). (I) Schematic protocol for combination therapy (NEK2 inhibitor: 5 mg/kg, every 3 days, ip; sintilimab: 10 mg/kg, every 7 days, ip) in the huHSC-NCG model. (J to L) Representative images displaying tumors, tumor volume, tumor weight, and mouse weight of combination therapy in huHSC-NCG model (n = 5). (M) Plots of tSNE showing the distinct immune landscape of tumors in the different treatment groups. (N) Proportions of immune cell types in the four treatment groups (n = 5). (O) Statistical results of functional indication of lymphocytes that have infiltrated the tumors in huHSC-NCG model (n = 5) by flow cytometric analysis. *P < 0.05, **P < 0.01, and ***P < 0.001. Using one-way ANOVA, with post hoc comparisons conducted using Tukey’s test [(B), (E), (G), (L), (M), (N), and (P)] or log-rank test [(C) and (F)]. Data are from ≥3 independent experiments (mean ± SD).
Fig. 8.
Fig. 8.. Predicted model of the NEK2-mediated sphingolipid synthesis in macrophages.
A schematic model is proposed to illustrate how tumor immune surveillance and therapeutic resistance are regulated by NEK2-mediated sphingolipid synthesis in macrophages. Combining the NEK2 inhibitor or S1P antagonist with ICB provides notable antitumor efficacy by reprogramming the TME.

References

    1. Bray F., Laversanne M., Sung H., Ferlay J., Siegel R. L., Soerjomataram I., Jemal A., Global cancer statistics 2022: GLOBOCAN estimates of incidence and mortality worldwide for 36 cancers in 185 countries. CA Cancer J. Clin. 74, 229–263 (2024). - PubMed
    1. Noy R., Pollard J. W., Tumor-associated macrophages: From mechanisms to therapy. Immunity 41, 49–61 (2014). - PMC - PubMed
    1. Vitale I., Manic G., Coussens L. M., Kroemer G., Galluzzi L., Macrophages and metabolism in the tumor microenvironment. Cell Metab. 30, 36–50 (2019). - PubMed
    1. Christofides A., Strauss L., Yeo A., Cao C., Charest A., Boussiotis V. A., The complex role of tumor-infiltrating macrophages. Nat. Immunol. 23, 1148–1156 (2022). - PMC - PubMed
    1. Xiao J., Wang S., Chen L., Ding X., Dang Y., Han M., Zheng Y., Shen H., Wu S., Wang M., Yang D., Li N., Dong C., Hu M., Su C., Li W., Hui L., Ye Y., Tang H., Wei B., Wang H., 25-Hydroxycholesterol regulates lysosome AMP kinase activation and metabolic reprogramming to educate immunosuppressive macrophages. Immunity 57, 1087–1104.e7 (2024). - PubMed

MeSH terms