. 2025 Jun 4;17(22):32111-32126.
doi: 10.1021/acsami.5c08974. Epub 2025 May 21.

Core-Shell ZnO2@Cerium-Based Metal-Organic Framework with Low Turnover, Dual-Catalytic Activity for Biosafe Biofilm Dispersal and Immune Modulation

Affiliations

Core-Shell ZnO2@Cerium-Based Metal-Organic Framework with Low Turnover, Dual-Catalytic Activity for Biosafe Biofilm Dispersal and Immune Modulation

Renfei Wu et al. ACS Appl Mater Interfaces. .

Abstract

The era of relying on antibiotics for curing bacterial infections is rapidly approaching an end, necessitating development of non-antibiotic-based infection-control strategies. Dispersal of infectious biofilms is a potential strategy but yields dispersed bacteria in blood that may cause sepsis. We report a bromide-loaded, core-shell ZnO2-nanoparticle/Ce-based metal-organic framework (ZnO2@CeMOF/Br) of which the ZnO2 core degrades at pH ≤ 6.5, leaving the MOF's Ce node intact. ZnO2-core degradation initially generates a nonradical, relatively stable, low-oxidative hydrogen peroxide that can cleave matrix DNA causing dispersal of Staphylococcus aureus biofilms and reacts with bromide ions to form transient hypobromous acid. Hypobromous acid modulates macrophage polarization toward an M1-like phenotype to clear dispersed bacteria from blood. Subsequently the Ce3+/Ce4+ redox couple forming the Ce node acts as an electron shuttle upon oxidation/reduction to faciltate two catalytic reactions, maintaining hydrolysis of phosphodiester bonds and associated cleavage of matrix DNA as well as modulation of macrophage polarization. Neither growth of tissue cells or macrophages nor hemolysis are negatively affected by exposure to ZnO2@CeMOF/Br nanocatalysts at a ZnO2 nanoparticle over CeMOFs weight ratio ≤ 1.2, up until CeMOF concentrations less than at least 180 μg/mL. Under biosafe, low-turnover catalytic conditions, irrigation of infected wounds in diabetic mice with ZnO2@CeMOF/Br nanocatalysts (90 μg/mL) results in 100% survival, fast recovery of healthy body temperature and weight, lower numbers of CFUs in blood and wound and organ tissues, and macrophage polarization toward an M1-like phenotype, demonstrating potential of ZnO2@CeMOF/Br nanocatalysts for non-antibiotic-based infection control.

Keywords: biofilm; extracellular DNA; immune modulation; metal−organic framework; sepsis; turnover frequency; turnover number.


Figures

1
1
Synthesis, reactions initiated by core–shell ZnO2@CeMOF/Br nanocatalysts, and the role of the Ce3+/Ce4+ redox couple in the hypothesized, dual-working mechanism of core–shell ZnO2@CeMOF/Br nanocatalysts, yielding cleavage of matrix DNA and immune modulation. (A) Synthesis of core–shell ZnO2@CeMOFs by seed-mediated growth, utilizing 2-methylimidazole as an organic linker, including loading with Br ions in the pores of Ce-based MOFs. (B) Reactions initiated by ZnO2@CeMOF/Br nanocatalysts in an acidic environment: (I) H+-induced generation of nonradical hydrogen peroxide (H2O2) from ZnO2 and (II) conversion of bromide ions (Br) and nonradical hydrogen peroxide into transient hypobromous acid (HBrO). (C) Hypothesized dual-working mechanism of core–shell ZnO2@CeMOF/Br nanocatalysts based on the initial reactions provoked, yielding dispersal of biofilm bacteria and modulation of macrophage polarization toward a more M1-like phenotype. (D) Intact Ce node in CeMOFs after degradation of ZnO2 nanoparticles providing a redox couple hypothesized to facilitate catalytic hydrolysis of phosphodiester bonds in DNA and generation of hypobromous acid.
2
2
Synthesis and characterization of core–shell ZnO2@CeMOFs in the absence of bromide loading. ZnO2@CeMOFs have been prepared at a weight ratio of ZnO2 and CeMOF of 1.2 (see also Section ). (A) TEM micrograph of ZnO2 nanoparticles, with diameter distribution obtained by measuring the diameters of 100 nanoparticles (bin size, 10 nm). (B) Same as panel A, now for CeMOFs. (C) Coordination interaction between imidazole groups and Zn2+ ions, facilitating seed-mediated growth of CeMOFs, encapsulating ZnO2 nanoparticles. (D) TEM micrograph of ZnO2@CeMOFs (for details, see Figure A). (E) High-angle annular dark-field (HAADF), scanning TEM micrograph of single ZnO2@CeMOFs and corresponding energy-dispersive X-ray mapping of Zn and Ce in core–shell ZnO2@CeMOFs, clearly distinguishing the Zn-rich core and the Ce-rich shell. (F) ζ potentials of ZnO2, CeMOFs and ZnO2@CeMOFs in 10 mM potassium phosphate buffer (pH 7.4). Data represent means over triplicate experiments with error bars indicating standard deviations. (G) FT-IR spectra of ZnO2 nanoparticles, CeMOFs and ZnO2@CeMOFs, with arrows indicating characteristic absorption bands. (H) X-ray diffraction patterns of ZnO2 nanoparticles, CeMOFs and core–shell ZnO2@CeMOFs. (I) Nitrogen (N2) adsorption–desorption isotherms measured at 77 K of ZnO2 nanoparticles, CeMOFs and core–shell ZnO2@CeMOFs. The solid and open symbols (mainly overlapping) represent absorption and desorption, respectively.
3
3
Cytotoxicity of ZnO2 nanoparticles, CeMOFs and ZnO2@CeMOFs synthesized at different ratios of ZnO2 over CeMOFs toward NIH 3T3 fibroblasts, human umbilical vein endothelial cells (HUVECs), and J774A.1 macrophages. (A) Relative viability of fibroblasts, HUVECs, and macrophages, grown in the presence of different concentrations of ZnO2 nanoparticles or CeMOFs. Viability was expressed with respect to growth medium without ZnO2 nanoparticles and CeMOFs, set at 100%. (B) Same as panel A, now for growth in the presence of ZnO2@CeMOFs. Data are presented in CeMOFs equivalent concentrations. (C) Hemolysis of mouse red blood cells after 3 h of exposure to different concentrations of ZnO2 nanoparticles, CeMOFs and ZnO2@CeMOFs. (C1) Data for ZnO2 nanoparticles and CeMOFs. (C2) Data for ZnO2@CeMOFs. Hemolysis was derived from UV absorbance at 540 nm, setting hemoglobin absorption of cells exposed to ultrapure water as 100%, and that exposed to PBS as 0%. Data represent means over five experiments with separately prepared cell cultures, and error bars indicate standard deviations.
4
4
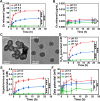
Acid-responsive core–shell ZnO2@CeMOFs and bromide-ion loading at a CeMOF concentration of 90 μg/mL. (A) Release of Zn from ZnO2@CeMOF/Br nanocatalysts as a function of exposure time in 10 mM potassium phosphate buffers with different pH. (B) Same as panel A, now for the release of Ce. (C) TEM micrographs of ZnO2@CeMOF/Br nanocatalysts after 24 h exposure to phosphate buffer. (D) Total amount of nonradical hydrogen peroxide (H2O2) generated from ZnO2@CeMOF nanocatalysts as a function of time during exposure to phosphate buffer with different pH, measured using a Hydrogen Peroxide Assay Kit (see Figure S3). (E) Same as panel D, now for the generation of transient hypobromous acid by ZnO2@CeMOF/Br nanocatalysts, measured from the bromination of phenol red to bromophenol blue (see Figure S4). (F) ζ potentials of bromide-loaded ZnO2@CeMOF/Br nanocatalysts as a function of exposure time to 10 mM potassium phosphate buffers with different pH. Data represent means over triplicate experiments, and error bars indicate standard deviations. Statistically significant differences between pairs of data are indicated by the vertical spanning bars (*p < 0.05; **p < 0.01; ***p < 0.001; two-tailed Student’s t test). ns indicates no significance.
5
5
Hydrolysis of phosphodiester bonds in BNPP and dispersal of 24 h of S. aureus Xen36 biofilms by ZnO2, CeMOFs, and ZnO2@CeMOFs, with and without bromide-ion loading in vitro and in the absence and presence of macrophages (mφ). (A) Hydrolysis of phosphodiester bonds in BNPP upon 24 h exposure to ZnO2 nanoparticles (concentration, 110 μg/mL), CeMOFs and ZnO2@CeMOFs with and without bromide-ion loading (CeMOF concentration, 90 μg/mL) suspended in potassium phosphate buffer (10 mM, pH 5.5). Hydrolysis was calculated from the absorbance at 400 nm due to nitrophenolate arising due to hydrolysis of phosphodiester bonds (Figure S5C) and expressed relative to the absorbance of nitrophenolate arising from hydrolysis in 0.4 mM BNPP. (B) CLSM overlay and cross-sectional images of 24 h old biofilms exposed for 24 h to different concentrations of ZnO2@CeMOF/Br nanocatalysts. (C) Biofilm thickness as a function of the concentration of ZnO2@CeMOFs (see Figure S6A for CLSM images) and ZnO2@CeMOF/Br nanocatalysts (see panel B for images). Data in the presence of macrophages were derived by an additional 24 h growth in the presence of macrophages, following initial exposure to ZnO2@CeMOFs (see Figure S6B for CLSM images) and ZnO2@CeMOF/Br nanocatalysts (see Figure S7 for images). Note, open symbols refer to data obtained by 24 h of additional growth in full medium in the absence of macrophages, following initial exposure to ZnO2@CeMOFs and ZnO2@CeMOF/Br nanocatalysts. (D) Same as panel C, now for the number of CFUs per unit volume in the remaining biofilm. Volumetric bacterial densities in biofilms were calculated as the number of CFUs cultured from a specific biofilm volume, divided by the biofilm volume derived from CLSM images as in panel B. Data represent means over triplicate experiments with separately cultured bacteria and error bars indicating standard deviations. Statistically significant differences between pairs of data are indicated by the spanning bars (**p < 0.01;***p < 0.001; two-tailed Student’s t test).
6
6
Modulation of macrophage polarization toward an M1-like phenotype upon 24 h exposure to ZnO2@CeMOF/Br nanocatalysts. Macrophages in Dulbecco’s modified Eagle medium high glucose (DMEM-HG) were exposed to ZnO2 nanoparticles (ZnO2 concentration, 110 μg/mL), CeMOFs, and ZnO2@CeMOFs with and without bromide-ion loading (MOF concentration, 90 μg/mL) suspended in DMEM-HG or to lipopolysaccharides (LPS, 10 μg/mL) and exogenous hypobromous acid (5 μg/mL) in DMEM-HG. Secretions of TNF-α and IL-6 were measured using different enzyme-linked immunosorbent assays (see Figure S8 for calibration curves). (A) TNF-α secretion. (B) IL-6 secretion. Data represent means over triplicate experiments with separately cultured macrophages, and error bars indicate standard deviations. Statistically significant differences between pairs of data are indicated by the horizontal spanning bars (**p < 0.01; ***p < 0.001; two-tailed Student’s t test).
7
7
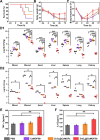
Biosafe treatment of S. aureus Xen36 infected wounds using ZnO2@CeMOF/Br nanocatalysts in diabetic mice. Infected wounds with an average area of 6 cm2 were treated by irrigation with 100 μL of PBS or suspensions with different concentrations of CeMOF/Br, ZnO2@CeMOFs, or ZnO2@CeMOF/Br nanocatalysts (90 μg/mL MOF concentration). (A) Kaplan–Meijer curve of the survival of mice as a function of time after initiating different treatments. (B) Average body weight of surviving mice as a function of time after initiating treatment. (C) Average body temperature of surviving mice as a function of time after initiating treatment. (D) Number of S. aureus Xen36 (CFU/g) in surviving mice (median) retrieved from blood, wound, and other organ tissues of mice sacrificed 24 h (panel D1) and 72 h (panel D2) after initiating treatment (separate group of mice). (E) TNF-α in wounds of surviving mice, sacrificed after 24 h. (F) IL-6 in wounds of surviving mice, sacrificed after 24 h. All data, with the exception of those presented in panel D, represent means over surviving mice in a group of five, with error bars indicating standard deviations. Statistically significant differences between pairs of data are indicated by the spanning bars (*p < 0.05: **p < 0.01; ***p < 0.001; two-tailed Student’s t test for panels D1, E, and F and permutation test for panel D2.
8
8
Different stages in the two catalytic reaction cycles induced by core–shell ZnO2@CeMOF/Br nanocatalysts in an acidic environment following initial generation of nonradical hydrogen peroxide and hypobromous acid by degradation of the ZnO2 nanoparticle core. Each catalytic reaction occurs in the presence of Ce3+/Ce4+ and HBrO/Br, depending on the stages of progression of each reaction. (A) Catalytic mechanism responsible for the repetitive hydrolysis of phosphodiester bonds and cleavage of extracellular matrix DNA. The intact Ce node in its Ce3+ state is oxidized to Ce4+, donating an electron to the oxygen atoms in phosphodiester bonds. This adds negative charge to the phosphate group and induces polarization of the two ester groups, which makes the bond between the esters and the phosphate group attractive for interaction with nucleophiles such as OH and H2O, causing hydrolysis of phosphodiester bonds. After hydrolysis, the electron previously donated to the phosphate group returns to the Ce4+ node, converting it back into Ce3+. (B) Catalytic mechanism responsible for the repetitive generation of hypobromous acid and the modulation of macrophage polarization toward an M1-like phenotype. Upon performing its modulatory function, HBrO decomposes into H2O and Br, requiring two electrons which are donated by the Ce3+ ions in the Ce3+/Ce4+ redox couple that is oxidized to Ce4+. After performing its modulatory function, the Ce3+/Ce4+ redox couple facilitates the formation of bromine and therewith returns to its Ce3+ state and bromine reacts with H2O to form hypobromous acid again.

Similar articles

References

    1. Lewis K.. Platforms for antibiotic discovery. Nat. Rev. Drug. Discovery. 2013;12(5):371–387. doi: 10.1038/nrd3975. - DOI - PubMed
    1. Cook M. A., Wright G. D.. The past, present, and future of antibiotics. Sci. Transl. Med. 2022;14(657):eabo7793. doi: 10.1126/scitranslmed.abo7793. - DOI - PubMed
    1. Zhang S., Yang H., Wang M., Mantovani D., Yang K., Witte F., Tan L., Yue B., Qu X.. Immunomodulatory biomaterials against bacterial infections: Progress, challenges, and future perspectives. Innovation. 2023;4(6):100503. doi: 10.1016/j.xinn.2023.100503. - DOI - PMC - PubMed
    1. Klein S. L., Flanagan K. L.. Sex differences in immune responses. Nat. Rev. Immunol. 2016;16(10):626–638. doi: 10.1038/nri.2016.90. - DOI - PubMed
    1. Castelo-Branco C., Soveral I.. The immune system and aging: a review. Gynecol. Endocrinol. 2014;30(1):16–22. doi: 10.3109/09513590.2013.852531. - DOI - PubMed

MeSH terms