. 2025 May 21;16(1):4714.
doi: 10.1038/s41467-025-59773-4.

GLP-1R/GCGR dual agonism dissipates hepatic steatosis to restore insulin sensitivity and rescue pancreatic β-cell function in obese male mice

Affiliations

GLP-1R/GCGR dual agonism dissipates hepatic steatosis to restore insulin sensitivity and rescue pancreatic β-cell function in obese male mice

Rhianna C Laker et al. Nat Commun. .

Abstract

An early driver of Type 2 diabetes mellitus (T2D) is ectopic fat accumulation, especially in the liver, that impairs insulin sensitivity. In T2D, GLP-1R/GCGR dual-agonists reduce glycaemia, body weight and hepatic steatosis. Here, we utilize cotadutide, a well characterized GLP-1R/GCGR dual-agonist, and demonstrate improvement of insulin sensitivity during hyperinsulinemic euglycemic clamp following sub-chronic dosing in male, diet-induced obese (DIO) mice. Phosphoproteomic analyses of insulin stimulated liver from cotadutide-treated mice identifies previously unknown and known phosphorylation sites on key insulin signaling proteins associated with improved insulin sensitivity. Cotadutide or GCGR mono-agonist treatment also increases brown adipose tissue (BAT) insulin-stimulated glucose uptake, while GLP-1R mono-agonist shows a weak effect. BAT from cotadutide-treated mice have induction of UCP-1 protein, increased mitochondrial area and a transcriptomic profile of increased fat oxidation and mitochondrial activity. Finally, the cotadutide-induced improvement in insulin sensitivity is associated with reduction of insulin secretion from isolated pancreatic islets indicating reduced insulin secretory demand. Here we show, GLP-1R/GCGR dual agonism provides multimodal efficacy to decrease hepatic steatosis and consequently improve insulin sensitivity, in concert with recovery of endogenous β-cell function and reduced insulin demand. This substantiates GLP-1R/GCGR dual-agonism as a potentially effective T2D treatment.


Conflict of interest statement

Competing interests: R.C.L., C.J.R., S.W., S.O., A.C.-A., S.K., S.E., N.B., and A.A. are current employees of AstraZeneca and may own stock in AstraZeneca. K.K., S.S., X.L., C.B., and G.P. are former employees and may also own stock in AstraZeneca. T.K. and M.R.L. have received research support from AstraZeneca. The remaining authors declare no competing interests.

Figures

Fig. 1
Fig. 1. Cotadutide improves whole-body and hepatic insulin sensitivity in hyperinsulinemic euglycemic clamp in DIO mice.
Metabolic parameters of DIO mice as assessed via a hyperinsulinemic euglycemic clamp following 28-day treatment of cotadutide (10 nmol/kg, blue upward triangles), liraglutide (5 nmol/kg, purple downward triangles), or g1437 (5 nmol/kg, gold diamonds) compared to vehicle (red circles). Reduction in body weight (BW) throughout the 28-day dosing period is shown as % change (A). Fasting blood glucose prior to clamp (B). Plasma insulin levels during fasting or clamp conditions (C). Blood glucose profile over time during clamp (D). Glucose infusion rate (GIR) (E) and the area under the glucose curve (AUC) (F) over time during the clamp. Rate of glucose disposal during fasting or clamp conditions (G) and plotted against the corresponding plasma insulin levels (H). Hepatic glucose production during fasting or clamp conditions (I) and plotted against the corresponding plasma insulin levels (J). Vehicle (n = 9), cotadutide (n = 8), liraglutide (n = 10), g1437 (n = 8). Data shown as the mean ± SEM. In (A), lines above the graph indicate differences compared with the vehicle at each time point and correspond to the respective group color. Two-way ANOVA with Tukey’s multiple comparisons post hoc (A), One-way ANOVA with Tukey’s multiple comparisons post hoc (B, C, F, G, I). *p < 0.05, **p < 0.01, ***p < 0.001, ****p < .0001. Exact p values are included in the Source Data file. Source data are provided as a Source Data file.
Fig. 2
Fig. 2. Cotadutide-treated DIO mice have normal insulin secretory capacity in response to hyperglycemia.
Metabolic parameters of DIO mice as assessed via a hyperglycemic clamp following 7-day treatment of cotadutide (10 nmol/kg, blue upward triangles), liraglutide (10 nmol/kg, purple downward triangles), or g1437 (10 nmol/kg, gold diamonds) compared to vehicle (red circles). Reduction in body weight (BW) throughout the 7-day dosing period is shown as % change (A). Fasting blood glucose (B) and fasting plasma insulin (C) prior to the clamp. Glucose infusion rate (GIR) (D), blood glucose levels (E), the area under the glucose curve (AUC) (F), and plasma insulin levels (G) during clamp conditions. Glucose disposal (Rd) under fasting and clamp conditions (H). Endogenous glucose production under fasting and clamp (I). Baseline (core) glycogen levels prior to clamp (J), net glycogen synthesis during clamp (K), and total glycogen at the end of the clamp (L). Vehicle (n = 10), cotadutide (n = 9), liraglutide (n = 9), g1437 (n = 10). Data are shown as the mean ± SEM. In (A, D, G), lines above the graph indicate differences compared with the vehicle at each time point and correspond to the respective group color. Two-way ANOVA with Tukey’s multiple comparisons post hoc (A, D, G), One-way ANOVA with Tukey’s multiple comparisons post hoc (B, C, F, HL). *p < 0.05, **p < 0.01, ***p < 0.001, ****p < .0001. Exact p values are included in the Source Data file. Source data are provided as a Source Data file.
Fig. 3
Fig. 3. Cotadutide induces changes in the hepatic proteome of metabolism-related proteins in DIO mice.
Experimental design for proteomic and phosphoproteomics study in which DIO mice were treated with cotadutide or vehicle for 28 days, then injected with PBS or insulin yielding four groups: vehicle + PBS (VP), vehicle + insulin (VI), cotadutide + PBS (CP), and cotadutide + insulin (CI). Created in BioRender. Kajani, S. (2025) https://BioRender.com/t03r158 (A). Volcano plot of significant up- (red, 531) or down-regulated (blue, 431) hepatic proteins comparing CP/VP as identified via proteomics (B). KEGG pathway analysis of all significantly differentially regulated hepatic proteins comparing CP/VP (C). n = 4 mice per group. In (B), dashed line denotes p = 0.05 and solid lines mark cut-off values for abundance ratio <0.76 or >1.315. The in-built one-way ANOVA statistical test in Proteome Discover (PD) was used to generate p values. In (C), KEGG term ranking based on FDR and significance based on FDR <0.05. Source data are provided as a Source Data file.
Fig. 4
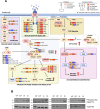
Fig. 4. Cotadutide enhances hepatic insulin-stimulated signaling pathways in DIO mice.
Schematic depicting proteomic and phosphoproteomics changes in the insulin signaling pathway based on the experimental design described in Fig. 3A including comparisons (detailed further in figure key) between the following groups: vehicle + PBS (VP), vehicle + insulin (VI), cotadutide + PBS (CP), and cotadutide +  insulin (CI). Due to space limitations, selected phosphosites are shown. *Indicates data derived from immunoblot or separate proteomic studies as noted in text. The full list of phosphosites is detailed in Supplementary Data. Created in BioRender. Kajani, S. (2025) https://BioRender.com/t41v037 (A). Immunoblot of phosphorylated AKT at serine 473 from the groups described in Fig. 3A compared to total AKT (B). n = 4 mice per group. In (A, B), increased or decreased proteomic or phosphoproteomics changes based on p < 0.05 and abundance ratio <0.76 or >1.315, or p < 0.01 and abundance ratio <0.76 or >1.315, respectively. The in-built one-way ANOVA test in Proteome Discover (PD) was used to generate p values. Source data are provided as a Source Data file.
Fig. 5
Fig. 5. Cotadutide increases brown adipose tissue glucose uptake.
Analysis of glucose uptake in DIO mice following 28-day treatment of cotadutide (10 nmol/kg, blue upward triangles), liraglutide (5 nmol/kg, purple downward triangles) (A, B), 10 nmol/kg (CE)), or g1437 (5 nmol/kg, gold diamonds), compared to vehicle (red circles). Tissue-specific glucose uptake (Rd) in gastrocnemius (Gastroc), vastus lateralis (Vastus L), perigonadal adipose tissue (PG AT), subcutaneous adipose tissue (SubQ AT) (A), soleus muscle, brown adipose tissue (Brown AT), heart, and brain tissue (B). Vechicle (n = 9), cotadutide (n = 8), liraglutide (n = 9), g1437 (n = 8). Reduction in body weight (BW) throughout the 28-day dosing period is shown as % change, with fluorodeoxyglucose (FDG) positron emission tomography (PET) imaging timepoints indicated (C). n = 8 mice per group. Quantification of FDG-PET glucose uptake measurements in brown adipose tissue (BAT) at baseline, day 14, or day 28 of treatment (D). Representative image from FDG-PET studies summarized in (D), (E). n = 8 mice per group, except cotadutide baseline (n = 4), liraglutide D14 (n = 7), g1437 D14 (n = 7). Data shown as the mean ± SEM. In (C), lines below the graph indicate differences compared with a vehicle at each time point and correspond to the respective group color. One-way ANOVA with Tukey’s multiple comparisons post hoc for each tissue (A, B) or each treatment group (D), Two-way ANOVA with Tukey’s multiple comparisons post hoc (C). *p < 0.05, **p < 0.01, ***p < 0.001, ****p < .0001. Exact p values are included in the Source Data file. Source data are provided as a Source Data file.
Fig. 6
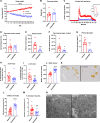
Fig. 6. Cotadutide increases brown adipose tissue mitochondrial activity and content.
Transcriptomic and histological analyses of brown adipose tissue (BAT) following 28-day treatment of cotadutide (10 nmol/kg, blue triangles), compared to vehicle (red circles). Volcano plot of genes significantly up- (red) or down-regulated (blue) by cotadutide in BAT as identified via RNA-seq. Vehicle (n = 4); Cotadutide (n = 5) mice per group (A). Gene ontology analysis for enriched biological process (red), molecular function (orange), or cellular component (yellow) for genes significantly upregulated by cotadutide in BAT (B). Representative images of immunohistochemical staining of BAT for UCP-1 (C) and H&E (D) of vehicle (top) and cotadutide (bottom). Vehicle (n = 8); Cotadutide (n = 7) mice per group. Quantification of BAT Score from H&E staining (E) Vehicle (n = 8); Cotadutide (n = 7) mice per group. Quantification of histological parameters from electron microscopy imaging in J, including lipid droplet area (F), lipid droplet size (G), mitochondria area (H), and mitochondria size (I). Biologic replicates are n = 2 mice per group. Technical replicates are vehicle (n = 10) and cotadutide (n = 19) images per mouse. Representative images of electron microscopy imaging of vehicle (left) and cotadutide (right) BAT (J). Adjustments were made for multiple comparisons using the Benjamini–Hochberg adjustment. Genes with Benjamini–Hochberg false discovery rate <0.05 as determined by DESeq2 were considered significant (A) two-sided Student’s t-test (EI). Data shown as the mean ± SEM. *p < 0.05, **p < 0.01, ***p < 0.001, ****p < .0001. Exact p values are included in the Source Data file. Source data are provided as a Source Data file.
Fig. 7
Fig. 7. Improved insulin sensitivity by cotadutide results in reduced insulin secretory demand on the pancreatic β-cell.
Analysis of pancreatic function following 28-day treatment of cotadutide (10 nmol/kg, blue triangles), compared to vehicle (red circles). Reduction in body weight (BW) throughout the 28-day dosing period shown as % change (n = 8 mice per group) (A). Total pancreas weight (n = 8 mice per group) (B). Insulin levels in perfusate from isolated pancreatic islets across time (main) and the area under the curve (inset) (n = 8 mice per group) (C). Total pancreatic insulin content (D) or plasma insulin levels (n = 8 mice per group) (E). Total pancreatic glucagon content (n = 8 mice per group) (F) or plasma glucagon levels (n = 7 mice per group) (G). Quantification of β-cell mass (H), α-cell mass (I), or MAFA-positive staining nuclei (J) from multiplexed immunohistochemistry of pancreata. Representative images of immunohistochemistry. Biologic replicates are n = 8 mice per group. Technical replicates are n = 2 images per mouse. K. Quantification of mature granules (L) or immature granules (M) from electron microscopy of pancreatic β-cell islets. Biological replicates are n = 2 mice per group. Technical replicates are n = 29 (cotadutide) and n = 31 (vehicle) β-cells imaged per mouse. Representative images of electron microscopy (N). Two-way ANOVA with Tukey’s multiple comparisons post hoc (A), two-sided Student’s t-test (B, C (inset), DJ, L, M). Data shown as the mean ± SEM. *p < 0.05, **p < 0.01, ***p < 0.001, ****p < .0001. Exact p values are included in the Source Data file. Source data are provided as a Source Data file.
Fig. 8
Fig. 8. Updated summary of Cotadutide mechanism of action.
Cotadutide-mediated GLP-1R agonism at the brain inhibits appetite, resulting in decreased food intake and body weight loss, while GCGR agonism at the liver reduces hepatic fat accumulation. Adapted from ref. , with permission from SNCSC. Here, we build on this model and demonstrate that Cotadutide improves whole-body insulin sensitivity through multimodal effects. In the liver, GCGR agonism enhances insulin-stimulated signaling and improves hepatic insulin sensitivity. Cotadutide treatment also increases insulin-stimulated glucose uptake in the brown adipose tissue and enhances brown adipose tissue metabolic activity. These effects facilitate a reduced demand for insulin production in the pancreas and allow for recovery of endogenous β-cell function.

References

    1. Kosmalski, M. et al. The coexistence of nonalcoholic fatty liver disease and type 2 diabetes mellitus. J Clin Med. 11, 1375 (2022). - PMC - PubMed
    1. Chen, K. et al. Clinical spectrum of non-alcoholic fatty liver disease in patients with diabetes mellitus. PLoS ONE15, e0236977 (2020). - PMC - PubMed
    1. Plantinga, L. C. et al. Prevalence of chronic kidney disease in US adults with undiagnosed diabetes or prediabetes. Clin. J. Am. Soc. Nephrol.5, 673–682 (2010). - PMC - PubMed
    1. Xu, M. et al. Type 2 diabetes, diabetes genetic score and risk of decreased renal function and albuminuria: a Mendelian randomization study. EBioMedicine6, 162–170 (2016). - PMC - PubMed
    1. Caussy, C., Aubin, A. & Loomba, R. The relationship between type 2 diabetes, NAFLD, and cardiovascular risk. Curr. Diab. Rep.21, 15 (2021). - PMC - PubMed

MeSH terms

LinkOut - more resources