. 2025 May 22;16(1):4743.
doi: 10.1038/s41467-025-59959-w.

Exercise-induced CLCF1 attenuates age-related muscle and bone decline in mice

Affiliations

Exercise-induced CLCF1 attenuates age-related muscle and bone decline in mice

Jae Sook Kang et al. Nat Commun. .

Abstract

Skeletal muscle undergoes many alterations with aging. However, the impact of aging on muscle's ability to secrete myokines and its subsequent effects on the body remain largely unexplored. Here, we identify myokines that have the potential to ameliorate age-related muscle and bone decline. Notably, circulating levels of cardiotrophin-like cytokine factor 1 (CLCF1) decrease with age, while exercise significantly upregulates CLCF1 levels in both humans and rodents. Restoring CLCF1 levels in aged male mice improves their physical performance, glucose tolerance, and mitochondrial activity. Furthermore, CLCF1 protects against age-induced bone loss by inhibiting osteoclastogenesis and promoting osteoblast differentiation in aged male mice. These improvements mirror some of the effects of exercise training. Conversely, blocking CLCF1 activity significantly abolishes these beneficial effects, confirming the crucial role of CLCF1 in mediating the positive effects of exercise on muscle and bone health in male mice. These findings collectively suggest that CLCF1 may contribute to the regulation of age-associated musculoskeletal deterioration, and warrant further investigation into its potential role as a modulator of musculoskeletal health during aging.


Conflict of interest statement

Competing interests: The authors declare no competing interests.

Figures

Fig. 1
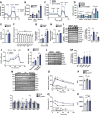
Fig. 1. Exercise induces CLCF1 expression in skeletal muscle.
A Volcano plots showing differentially expressed genes (DEGs) encoding secretory proteins in skeletal muscles of young and old adults before and after 12 weeks of progressive resistance training. B Expression levels of genes commonly found in three DEG groups (yBase, n = 15; y1st, n = 16; yFinal, n = 16; oBase, n = 12; o1st, n = 12; oFinal, n = 12, p = 0.0278, 0.0453, 0.0223 (CLCF1); 0.0011, 0.0379 (LCAT); 0.005, 0.0299, 0.014, 0.0095 (CCL2); 2.00e-7, 0.0002 (PRSS50): young and old adults). C Clcf1 expression in C2C12 myotubes treated with AICAR (1 mM, 24 h; n = 3, p = 0.001; biological replicates). D Left: Immunoblot analysis of C2C12 myotubes treated with AICAR. Right: Quantification by densitometry analysis (n = 4, p = 0.0026). E Clcf1 expression in C2C12 myotubes subjected to electrical pulse contraction (EPS; n = 6, p = 0.0015; biological replicates). F Left: Immunoblot of C2C12 myotubes after EPS. Right: Quantification of western blots by densitometry analysis (n = 3, p = 0.046). G mRNA expression of Clcf1 in skeletal muscles following treadmill running (3 mo, male, created in BioRender.com) (n = 4; p = 0.0062, 0.047, 0.018). H Plasma concentration of CLCF1 measured 30, 60, or 90 min after treadmill exercise in young (3 mo, male) and aged (24 mo, male) mice (n = 4, p = 0.026, 0.038, 1.3e-4), Box plots show the median (center line), interquartile range (25th–75th percentiles), and the full data range (minimum to maximum, shown as whiskers). I Plasma CLCF1 concentration in young (3 mo, male), middle-aged (8 mo, male), and aged (18 mo, male) mice (n = 10; p = 3.4.e-4, 1e-6, 0.041). Data are presented as means ± s.e.m.; one-way ANOVA with post hoc Tukey’s multiple comparison test (B, I); two-tailed unpaired Student’s t-test (CG); two-way ANOVA with post hoc Tukey’s multiple comparison test (H). *p < 0.05, **p < 0.005 and ***p < 0.001. Source data are provided as a Source Data file.
Fig. 2
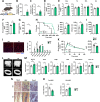
Fig. 2. Supplementation of CLCF1 improves muscle function and bone density in aged mice.
A Experimental scheme (created in BioRender.com). Aged mice (20 mo, male) were treated daily with CLCF1 (0.1 or 0.5 mg/kg) or vehicle for 2 weeks. B Muscle weights (SOL, GA, EDL, and TA) (vehicle, n = 8; 0.1 mg/kg, n = 9; 0.5 mg/kg, n = 11). C Grip strength test (vehicle, n = 11; 0.1 mg/kg, n = 7; 0.5 mg/kg, n = 10; p = 0.0081). D Running curves (vehicle, n = 8; 0.1 mg/kg, n = 7; 0.5 mg/kg, n = 7; p = 6.7e-5, 0.0018), E distance ran (vehicle, n = 8; 0.1 mg/kg, n = 8; 0.5 mg/kg, n = 7; p = 0.0008, 0.0012), and F time to exhaustion (vehicle, n = 8; 0.1 mg/kg, n = 8; 0.5 mg/kg, n = 7; p = 0.0010, 0.0014). G Left: Full cross-section of TA muscle. Scale bar, 0.5 mm. Right: Total muscle fiber number (vehicle, n = 6; 0.5 mg/kg, n = 5). H Laminin-stained myofibers in TA of young, old, and old-CLCF1 mice (0.5 mg/kg). Scale bar, 50 μm. IK Quantification of muscle fiber size (n = 3, biological replicates): I mean muscle fiber area (p = 0.038), J frequency distribution of fiber areas, and K quartile analysis of the distribution (p = 0.0364, 0.0427, 0.0406). L The maximum twitch force at superamaximal voltage, M tetanic force at different stimulation frequencies (10–150 Hz) and area under curve (p = 0.039, 0.0043, 0.0040), N, O fatigue resistance and area under curve of old and old-CLCF1 mice (n = 10; p = 0.034). P Representative micro-CT images of the trabecular and cortical bone compartments of distal femoral metaphyseal regions (old and old-CLCF1 mice, 0.5 mg/kg) Scale bar, 1 mm. Q Measurement of trabecular bone volume/total volume (BV/TV), trabecular thickness (TbTh), trabecular separation (TbSp), trabecular number (TbN), cortical bone volume/total volume (Corti BV/TV), and cortical thickness (Corti Th) (n = 8; p = 0.022, 0.196, 0.038, 0.013, 0.019, 0.093). R Representative hematoxylin/eosin (H&E), TRAP, and Runx2-stained histological sections of proximal tibiae. Scale bar, 100 μm. S Quantification of osteoclast number per bone surface (n = 8; p = 0.02) and T Osteoblast (n = 8). Data are presented as means ± s.e.m.; two-tailed unpaired Student’s t-test (BK, O, Q, S, T); Mann–Whitney U test (D); or two-way ANOVA with post hoc Bonferroni’s multiple comparison test (M, N). *p < 0.05, **p < 0.005 and ***p < 0.001; n.s., p > 0.05. Source data are provided as a Source Data file.
Fig. 3
Fig. 3. Recombinant CLCF1 treatment stimulates glucose uptake and glucose metabolism.
A, B Oxygen consumption rate (OCR) and quantification of basal respiration, ATP production, and maximal respiration in C2C12 myotubes treated with CLCF1 (100 ng/ml) for 48 h (vehicle, n = 10; CLCF1, n = 9; biological replicates, p = 1.0e-6, 7.0e-7, 1.3e-8). C OCR traces and D quantification in response to UK5099. (n = 10; p = 1.6e-5, 5.2e-7, 1.6e-4, 4.6e-5, 2.0e-11, 2.0e-11, 2.0e-11). E, F Mitochondrial DNA content and expression of mitochondrial genes in C2C12 myotubes after 48 h of CLCF1 treatment (n = 3). G Relative level of glucose uptake in C2C12 myotubes with CLCF1 treatment overnight (n = 6; p = 9.8e-3, 2.86e-2). H Relative level of fatty acid uptake in C2C12 myotube with CLCF1 overnight (n = 5). I Left: Western blot analysis of GLUT1 and GLUT4 in membrane and cytosolic fractions after 24 h of treatment with vehicle or CLCF1 in C2C12 myotubes (n = 3; p = 0.0469). Right: Quantification of Western blots was performed by densitometry analysis. J Measurement of glycolysis by extracellular acidification rate (ECAR) in C2C12 myotubes treated with vehicle or CLCF1 for 48 h (n = 8). K Quantification of glycolysis and glycolytic capacity (p = 3.0e-4, 2.0e-4). L Expression of glycolysis-related enzymes in C2C12 myotubes treated with vehicle or CLCF1 for 24 h. M Quantification of glycolytic enzymes (n = 4; p = 3.44e-2, 4.6e-3, 2.05e-2, 2.2e-3). N Top: Expression of glycolysis-related enzymes in muscle of young (3 mo, male), old (20 mo, male), and old-CLCF1 (20 mo, male). Bottom: Quantification of western blots (n = 4; p = 0.0313, 0.0135, 0.0049, 0.0001). O Intraperitoneal glucose tolerance test (IPGTT) in young, old, and old-CLCF1 (p = 4.8e-5, 7.5e-5). P Area under curve (AUC) (young, n = 12; old, n = 10; old_CLCF1, n = 8; biological replicates, p = 0.0149, 0.0293). Q Insulin tolerance test in young, old, and old-CLCF1 (p = 2.5e-6, 8.2e-7). R AUC young, n = 8; old, n = 11; old_CLCF1, n = 10; p = 0.0251, 0.0135. Data are presented as means ± s.e.m.; two-tailed unpaired Student’s t-test (B, EI, K, M); one-way ANOVA with post hoc Bonferroni’s multiple comparison test (J, N, P, R); or two-way ANOVA with post hoc Tukey’s multiple comparison test (D, O, Q). *p < 0.05, **p < 0.005 and ***p < 0.001; n.s., p > 0.05. Source data are provided as a Source Data file.
Fig. 4
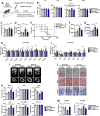
Fig. 4. CLCF1 inhibits osteoclast differentiation and stimulates osteoblast differentiation.
AC BMMs were treated with different concentrations of CLCF1 in the presence of M-CSF and RANKL for 3 days. A The numbers of TRAP-positive osteoclasts were counted (n = 4; biological replicates, p = 3.32e-5, 4.6e-9, 2.0e-10). Scale bar, 100 μm. B Real-time PCR analyses for the expression of the indicated genes (n = 3; p = 2.2e-7, 8.0e-4, 0.4408, 1.0e-9, 1.0e-9). C Western blot for the expression of the indicated molecules. D TRAP staining and quantification of osteoclasts differentiated from BMMs transduced with pMX-IRES-EGFP or CLCF1 and CRLF1 retrovirus for 3 days (n = 3; biological replicates, p = 0.0081). Scale bar, 100 μm. E Schemes of RANKL-induced bone loss (created in BioRender.com). F Representative µCT images of the trabecular and cortical compartments of distal femoral metaphyseal regions. Scale bar, 1 mm. GJ Measurement of trabecular bone volume /total volume (BV/TV, p = 5.0e-5, 0.0052, 0.019), trabecular thickness (TbTh, p = 0.0174, 0.0032), trabecular separation (TbSp, p = 0.0329, 0.0007), trabecular number (TbN, p = 0.0014, 0.000046) (n = 4). KM Osteoblast precursors differentiated with OGM for 3 or 6 days in the presence or absence of CLCF1 (100 ng/mL). K ALP assay after 3 days (n = 3; biological replicates, p = 0.0130). L Alizarin red staining and quantification at 6 days (n = 3; p = 0.0208). M PCR analyses for the expression of the indicated genes (n = 3; p = 1.0e-4, 1.0e-10). N, O Osteoblasts transduced with pMX-IRES-EGFP or CLCF1 and CRLF1 retrovirus were differentiated with OGM for 3 or 6 days. N ALP activity was measured (n = 3; p = 0.0198). O Alizarin red staining and quantification (n = 3; p = 0.0064). P Schemes of BMP2-induced ectopic bone formation (created in BioRender.com). Q Representative µCT images of the ectopic bones. Scale bar, 1 mm. R Measurement of BV and BV/TV (n = 6; p = 0.0451, 0.0437). Data are presented as means ± s.e.m.; two-tailed unpaired Student’s t-test (A, D, R); one-way ANOVA with post hoc Tukey’s multiple comparison test (GJ); or two-way ANOVA with post hoc Tukey’s multiple comparison test (B, KO). *p < 0.05, **p < 0.005 and ***p < 0.001. Source data are provided as a Source Data file.
Fig. 5
Fig. 5. CLCF1 transgenic mice exhibit enhanced muscle function and bone formation.
A Schematic representation of CLCF1-CRLF1 transgenic mice generation (created in BioRender.com). Male TG mice (10 weeks) were used. B, C Relative mRNA expression levels of Clcf1 (WT, n = 9; TG, n = 8; p = 0.0038) (B) and Crlf1 (WT, n = 9; TG, n = 7; p = 0.0051) (C) in TA muscle. D Plasma levels of CLCF1 protein from control and TG mice (WT, n = 4; TG, n = 5; p = 0.0240). E Weight of dissected SOL, TA, EDL, and GA muscles (WT, n = 9; TG, n = 7; biological replicates, p = 0.0096). F Grip strength test (WT, n = 9; TG, n = 7; p = 6.0e-6). G Grid hanging test (WT, n = 8; TG, n = 9; p = 0.0252). H Treadmill running performance test in mice: running curves, distance run, and time to exhaustion (WT, n = 8; TG, n = 7; p = 0.0008, 0.004, 0.003). I The number of fibers in the TA muscle (n = 4; biological replicates). J Immunostaining for myofiber boundaries using laminin in TA muscles of WT and TG mice (WT, n = 3; TG, n = 3; p = 0.0201, 0.001, 6.2e-7, 0.014, 0.005, 7.6e-7). Scale bar, 50 μm. K Glucose tolerance test in WT and TG mice (n = 9; p = 0.0494, 0.0001, 0.0318). L Representative µCT images of the trabecular and cortical compartments of distal femoral metaphyseal regions of control and TG mice. Scale bar, 1 mm. M Measurement of trabecular bone volume/total volume (BV/TV), trabecular thickness (TbTh), trabecular separation (TbSp), trabecular number (TbN), cortical bone volume/total volume (Corti BV/TV), and cortical thickness (Corti Th) (WT, n = 9; TG, n = 8; p = 0.0071, 0.0349, 0.0461, 0.0134). N TRAP, hematoxylin/eosin (H&E), and Runx2 staining of a histological section of proximal tibiae. Scale bar, 100 μm. O Osteoclast number per bone surface and osteoblast number per bone surface were assessed (WT, n = 9; TG, n = 8; p = 0.0001, 0.0067). Data are presented as means ± s.e.m.; two-tailed unpaired Student’s t-test (BO); Log-rank (Mantel–Cox) test (H); or two-way ANOVA with post hoc Bonferroni’s multiple comparison test (K). *p < 0.05, **p < 0.005 and ***p < 0.001. Source data are provided as a Source Data file.
Fig. 6
Fig. 6. Characterization of skeletal muscle-specific CLCF1 knockout (skm KO) mice.
A Scheme showing the generation of skeletal muscle-specific CLCF1 knockout mice and the experimental plan of exercise (created in BioRender.com). We used 12-week-old male skm KO mice. B Relative mRNA expression levels of CLCF1 in TA muscle in WTflx and skm KO mice (n = 3; p = 0.0231). C Weight of dissected SOL, TA, EDL, and GA muscles in WTflx and skm KO mice (n = 5; biological replicates, p = 0.0271, 0.039). D Grip strength test (n = 5; p = 0.0026). E Grid hanging test (n = 5; p = 0.9296). F Treadmill running performance test in mice: running curves, distance run, and time to exhaustion (n = 5). G Immunostaining for myofiber boundaries using laminin in TA muscles of WTflx and skm KO mice. Scale bar, 50 μm. H, I Quantification of muscle fiber size and distribution in TA muscles: H mean muscle fiber area (WT, n = 4; skm KO, n = 3; biological replicates, p = 0.006), I frequency distribution of fiber area (WT, n = 4; skm KO, n = 3; biological replicates, p = 0.027, 0.045, 0.031). J Representative µCT images of the trabecular and cortical compartments of distal femoral metaphyseal regions of WTflx and skm KO mice. Scale bar, 1 mm. K Measurement of trabecular bone volume/total volume (BV/TV), trabecular thickness (TbTh), trabecular separation (TbSp), trabecular number (TbN), cortical bone volume/total volume (Corti BV/TV), and cortical thickness (Corti Th) (n = 5). L TRAP, hematoxylin/eosin (H&E), and Runx2 staining of a histological section of proximal tibiae. Scale bar, 100 μm. M Osteoclast number per bone surface and osteoblast number per bone surface were assessed (n = 5). Data are presented as means ± s.e.m.; two-tailed unpaired Student’s t-test (BE, HM); Log-rank (Mantel–Cox) test for running curve (F). *p < 0.05, **p < 0.005 and ***p < 0.001. Source data are provided as a Source Data file.
Fig. 7
Fig. 7. Exercise’s positive effects on muscle and bone are mitigated by eCNTFR.
A Experimental schemes for eCNTFR supplementation protocols during exercise (n = 8; created in BioRender.com). We used 12-week-old male mice. B Weight of dissected TA, GA, SOL, and EDL muscles (n = 8; p = 0.0674, 0.0754). C Grip strength test (n = 8; p = 0.0009, 0.0205). D Grid hanging test (n = 8; p = 0.0078, 0.0166). EG Treadmill running performance test in mice: E running curves (p = 0.0025, 0.0285), F distance run (n = 7; p = 0.0014, 0.0172), and G time to exhaustion (n = 7; p = 0.0014, 0.0172). H, I mRNA expression of genes involved in fatty acid oxidation (n = 5; p = 1.21e-2, 4.89e-2, 2.3e-3, 5.0e-3, 3.0e-4, 4.0e-4, 1.0e-3, 1.2e-2, 5.0e-5, 1.5e-2, 1.4e-3, 8.0e-3, 8.0e-4) (H) and glycolysis (I) in TA muscles (n = 5, p = 8.2e-3, 8.8e-3, 1.71e-2, 4.0e-4, 6.5e-3, 2.12e-2). J Representative µCT images of the trabecular and cortical compartments of distal femoral metaphyseal regions of vehicle or eCNTFR-supplemented mice during exercise. Scale bar, 1 mm. K Measurement of trabecular bone volume/total volume (BV/TV, p = 3.0e-9, 5.0e-5), trabecular thickness (TbTh), trabecular separation (TbSp, p = 1.0e-7, 0.007), trabecular number (TbN, p = 1.0e-8, 0.0001), cortical bone volume/total volume (Corti BV/TV, p = 0.001, 0.001), and cortical thickness (Corti Th, n = 5). L TRAP, hematoxylin/eosin (H&E), and Runx2 staining of a histological section of proximal tibiae. Scale bar, 100 μm. M Osteoclast number per bone surface and osteoblast number per bone surface were assessed (n = 6; p = 0.0326, 0.0281, 0.0021, 0.0101). Data are presented as means ± s.e.m.; one-way ANOVA with post hoc Tukey’s multiple comparison test (BM); or Log-rank (Mantel–Cox) test (E). *p < 0.05, **p < 0.005 and ***p < 0.001. Source data are provided as a Source Data file.

References

    1. Tagliaferri, C., Wittrant, Y., Davicco, M. J., Walrand, S. & Coxam, V. Muscle and bone, two interconnected tissues. Ageing Res. Rev.21, 55–70 (2015). - PubMed
    1. Yu, X. et al. A pooled analysis of the association between sarcopenia and osteoporosis. Medicine101, e31692 (2022). - PMC - PubMed
    1. Leal, L. G., Lopes, M. A. & Batista, M. L. Jr. Physical exercise-induced myokines and muscle-adipose tissue crosstalk: a review of current knowledge and the implications for health and metabolic diseases. Front. Physiol.9, 1307 (2018). - PMC - PubMed
    1. Karsenty, G. & Mera, P. Molecular bases of the crosstalk between bone and muscle. Bone115, 43–49 (2018). - PMC - PubMed
    1. Bostrom, P. et al. A PGC1-alpha-dependent myokine that drives brown-fat-like development of white fat and thermogenesis. Nature481, 463–468 (2012). - PMC - PubMed

LinkOut - more resources