. 2025 May 21;16(1):4739.
doi: 10.1038/s41467-025-59532-5.

Dermatologist-like explainable AI enhances melanoma diagnosis accuracy: eye-tracking study

Collaborators, Affiliations

Dermatologist-like explainable AI enhances melanoma diagnosis accuracy: eye-tracking study

Tirtha Chanda et al. Nat Commun. .

Abstract

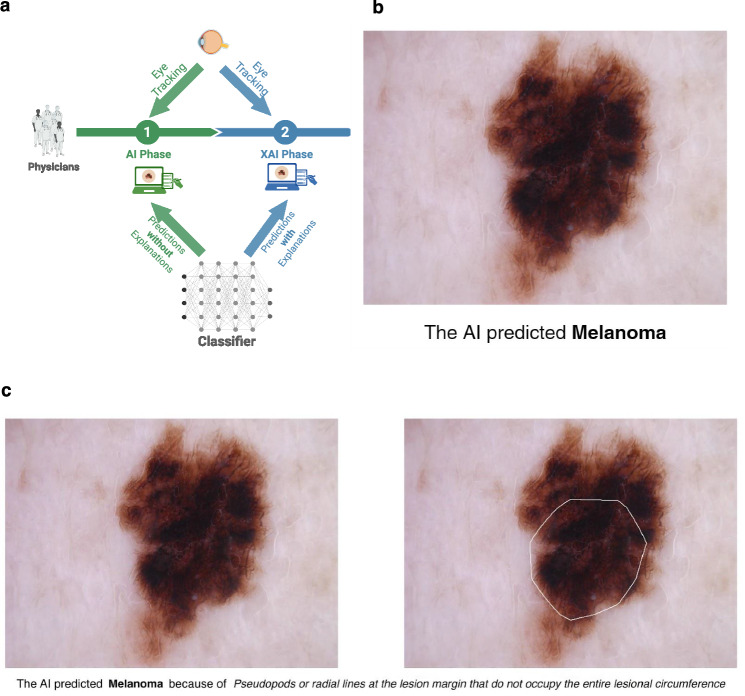
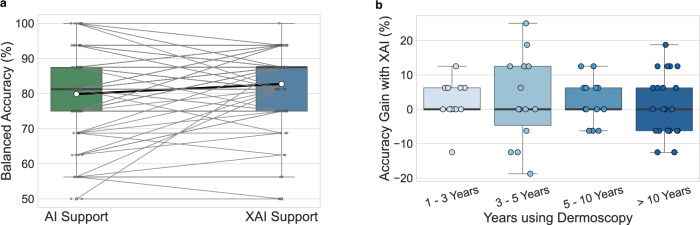
Artificial intelligence (AI) systems substantially improve dermatologists' diagnostic accuracy for melanoma, with explainable AI (XAI) systems further enhancing their confidence and trust in AI-driven decisions. Despite these advancements, there remains a critical need for objective evaluation of how dermatologists engage with both AI and XAI tools. In this study, 76 dermatologists participate in a reader study, diagnosing 16 dermoscopic images of melanomas and nevi using an XAI system that provides detailed, domain-specific explanations, while eye-tracking technology assesses their interactions. Diagnostic performance is compared with that of a standard AI system lacking explanatory features. Here we show that XAI significantly improves dermatologists' diagnostic balanced accuracy by 2.8 percentage points compared to standard AI. Moreover, diagnostic disagreements with AI/XAI systems and complex lesions are associated with elevated cognitive load, as evidenced by increased ocular fixations. These insights have significant implications for the design of AI/XAI tools for visual tasks in dermatology and the broader development of XAI in medical diagnostics.


Conflict of interest statement

Competing interests: J.N.K. declares consulting services for Bioptimus, France; Owkin, France; DoMore Diagnostics, Norway; Panakeia, UK; AstraZeneca, UK; Scailyte, Switzerland; Mindpeak, Germany; and MultiplexDx, Slovakia. Furthermore he holds shares in StratifAI GmbH, Germany, has received a research grant by GSK, and has received honoraria by AstraZeneca, Bayer, Daiichi Sankyo, Eisai, Janssen, MSD, BMS, Roche, Pfizer and Fresenius. T.J.B. would like to disclose that he owns a software company (Smart Health Heidelberg GmbH, Handschuhsheimer Landstr. 9/1, 69120 Heidelberg), outside of the scope of the submitted work. No other competing interests are declared by any of the authors.

Figures

Fig. 1
Fig. 1. Schematic overview of the study design with AI and XAI prediction examples.
a Schematic overview of our two-phase reader study. Dermatologists were asked to diagnose 16 dermoscopic images each, consisting of melanomas and nevi. In the artificial intelligence (AI) phase, they were supported by an AI system that provided the predicted diagnoses for the images and were asked to provide their own diagnoses. In the explainable artificial intelligence (XAI) phase, they received support by an XAI that showed not only the predicted diagnoses but also the corresponding explanations. b An example dermoscopic image with the predicted diagnosis of the AI shown in the AI phase. c An example dermoscopic image, along with the predicted diagnosis from the XAI, and the corresponding textual and regional explanations provided during the XAI phase. Created in BioRender. Chanda, T. (2025).
Fig. 2
Fig. 2. Dermatologists’ diagnostic accuracy with AI and XAI support.
a Dermatologists’ balanced accuracies with artificial intelligence (AI) support and explainable artificial intelligence (XAI) support (P  =  0.013, two-sided paired t-test, n  = 76 participants). The y-axis represents a continuous scale from 0 to 100 but is labeled at discrete intervals (e.g., 50, 60, etc.) for clarity. The gray lines between the boxes connect the same dermatologist between the AI and XAI phases, while the black lines indicate the means across all dermatologists. The horizontal line within each box denotes the median value, and the white dot represents the mean. The upper and lower box limits denote the 1st and 3rd quartiles, respectively, with the whiskers extending to 1.5 times the interquartile range. b Numerical increase in dermatologists’ diagnostic accuracy with XAI over AI (XAI phase accuracy minus AI phase accuracy) (two-sided Spearman’s rank correlation −0.08, P = 0.55, n = 61 dermatologists). Each point represents one dermatologist. The horizontal line within each box denotes the median value, and the white dot represents the mean. The upper and lower box limits denote the 1st and 3rd quartiles, respectively, with the whiskers extending to 1.5 times the interquartile range. Source data are provided as a Source Data file.
Fig. 3
Fig. 3. Fixation patterns and cases of disagreement between dermatologist and classifier.
a Differences in fixation counts in cases where the dermatologist and classifier agreed (P  <  0.001, two-sided t-test, n_agreed=316 cases, n_disagreed = 52 cases) and disagreed (P  <  0.001, two-sided t-test, n_agreed = 317 cases, n_disagreed = 51 cases). The gray lines between the boxes connect the same dermatologist between the artificial intelligence (AI) and explainable artificial intelligence (XAI) phases, and the black lines connecting the boxes indicate the means across all dermatologists. The horizontal line on each box denotes the median value and the white dot denotes the mean. The upper and lower box limits denote the 1st and 3rd quartiles, respectively, and the whiskers extend from the box to 1.5 times the interquartile range. b Distributions of the number of fixations across different experience levels. Fixations are negatively correlated with experience levels (two-sided Spearman Correlation Coefficient, P = 0.002, n = 61 dermatologists). The horizontal line on each box denotes the median value and the white dot denotes the mean. The upper and lower box limits denote the 1st and 3rd quartiles, respectively, and the whiskers extend from the box to 1.5 times the interquartile range. c Relationship between diagnostic difficulty and number of fixations. Difficult cases are associated with a higher number of fixations (two-sided Spearman Correlation Coefficient; P < 0.001, n = 753 images). Data are presented as mean values and bootstrapped confidence intervals derived from 1000 samples. Source data are provided as a Source Data file.

References

    1. Maron, R. C. et al. Artificial Intelligence and its effect on dermatologists’ accuracy in dermoscopic melanoma image classification: web-based survey study. J. Med. Internet Res.22, e18091 (2020). - PMC - PubMed
    1. Chanda, T. et al. Dermatologist-like explainable AI enhances trust and confidence in diagnosing melanoma. Nat. Commun.15, 524 (2024). - PMC - PubMed
    1. Selvaraju, R. R. et al. Grad-CAM: visual explanations from deep networks via gradient-based localization. In 2017 IEEE International Conference on Computer Vision (ICCV) 618–626 10.1109/ICCV.2017.74 (2017).
    1. Bach, S. et al. On pixel-wise explanations for non-linear classifier decisions by layer-wise relevance propagation. PLoS ONE10, e0130140 (2015). - PMC - PubMed
    1. Ribeiro, M. T., Singh, S. & Guestrin, C. ‘Why should i trust you?’: explaining the predictions of any classifier. In Proceedings of the 22nd ACM SIGKDD International Conference on Knowledge Discovery and Data Mining 1135–1144. 10.1145/2939672.2939778 (ACM, San Francisco California USA, 2016).

LinkOut - more resources