. 2025 May 21;16(1):4733.
doi: 10.1038/s41467-025-60084-x.

A searchable atlas of pathogen-sensitive lncRNA networks in human macrophages

Affiliations

A searchable atlas of pathogen-sensitive lncRNA networks in human macrophages

Nils Schmerer et al. Nat Commun. .

Abstract

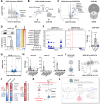
Long noncoding RNAs (lncRNA) are crucial yet underexplored regulators of human immunity. Here we develop GRADR, a method integrating gradient profiling with RNA-binding proteome analysis, to map the protein interactomes of all expressed RNAs in a single experiment to study mechanisms of lncRNA-mediated regulation of human primary macrophages. Applying GRADR alongside CRISPR-multiomics, we reveal a network of NFκB-dependent lncRNAs, including LINC01215, AC022816.1 and ROCKI, which modulate distinct aspects of macrophage immunity, particularly through interactions with mRNA-processing factors, such as hnRNP proteins. We further uncover the function of ROCKI in repressing the messenger of the anti-inflammatory GATA2 transcription factor, thus promoting macrophage activation. Lastly, all data are consolidated in the SMyLR web interface, a searchable reference catalog for exploring lncRNA functions and pathway-dependencies in immune cells. Our results thus not only highlight the important functions of lncRNAs in immune regulation, but also provide a rich resource for lncRNA studies.


Conflict of interest statement

Competing interests: The authors declare no competing interests.

Figures

Fig. 1
Fig. 1. Mapping of lncRNAs implicated in human lung innate immunity.
A Illustration of key alveolar cell types, highlighting macrophage lncRNA networks. B Overview of the SMyLR database, detailing lncRNA pathway dependencies, cell-type specificity, and protein interactions. C Number and fold changes (≥2-fold up or down) of mRNAs in specified cell types following 4 h of flagellin (FLA) (AECII) or LPS (aMФ, G-MФ, M-MФ) stimulation; data averaged from two RNA-seq replicates. D 3D PCA analysis of RNA-seq samples from (C). E Heatmap of all lncRNAs up-regulated ≥ 2-fold in both RNA-seq replicates in aMФ or G-MФ (data from C, D AECII data included for comparison). Top section highlights lncRNAs also upregulated in AECII ≥ 2-fold. F Volcano plot displaying lncRNA changes (4 h LPS vs control treatment) in aMФ, highlighting those also regulated in G-MФ (data from C-E). Two-tailed Student’s t-test p-values are shown. G Illustration of PCLS preparation and culture. H RT-qPCR analysis of IL8 and lncRNA regulation in PCLS post stimulation (results relative to RPS18 and 4 h mock). Three independent experiments; mean values +/- SD. Asterisks denote statistical significance (One-way ANOVA test, p ≤ 0.05). Exact p-values: IL8: 0.017 (4 h LPS), 0.024 (8 h LPS), 0.039 (8 h FLA); ROCKI: 0.034 (8 h FLA); AC010980: 0.042 (8 h FLA); LINC01215: 0.045 (4 h FLA), 0.048 (8 h LPS), 0.017 (8 h FLA); AC022816.1: 0.025 (4 h LPS), 0.011 (8 h LPS). I Left: Illustration of BAL procedure. Right: Linear regression plots with 95% confidence intervals (dashed lines) and Pearson correlation statistics (two-tailed test), comparing the RT-qPCR-determined levels of the indicated lncRNAs with IFNB1 (log2 2-ΔCT values) in bronchoalveolar lavage cell pellets. Samples size variations in individual plots (n ≤ 24) reflect cases where the respective lncRNA was below the detection limit.
Fig. 2
Fig. 2. Pathway dependency of macrophage lncRNAs.
A Illustration of attributes analyzed to characterize immune-responsive lncRNAs in macrophages. B Left: Heatmap (row Z-scores) showing lncRNA expression changes in G-MФ following 2 h and 4 h stimulation with Pam3csk4 (PAM), LPS, or interferon-α (IFN), based on averaged RPKMs from two independent RNA-seq datasets. Right: Top: Illustration of pathways relevant for LPS-dependent lncRNA regulation. Bottom: RNA-seq analysis of the dependence of lncRNAs shown in the heatmap (left) on LPS-induced pathways. Bay = BAY 11-7082 (NFκB inhibitor); Rux = Ruxolitinib (STAT-inhibitor); BX = BX795 (TBK1-IRF3 inhibitor). Fold-changes relative to base-mean, averaged from two independent RNA-seq experiments. C RT-qPCR analysis of lncRNA responses to LPS (4 h) plus either DMSO or inhibitors used in B) at three increasing concentrations; results from three independent experiments; mean values +/- SD. Exact p-values (in the same order as the asterisks): ROCKI: 0.001, 0.013; AC010980: <0.001; LINC00158: <0.001, <0.001; LINC01215: 0.001; AC022816.1: <0.001, <0.001. D Time-series RT-qPCR analysis of IL8, IFNB1, and lncRNA expression in G-MФ treated with LPS; data from three independent experiments, showing mean values +/- SD. Exact p-values: ROCKI: <0.001; LINC00158: <0.001; AC010980: <0.001; LINC01215: <0.001; AC022816.1: 0.004. E Heatmap of lncRNA changes in G-MФ exposed to various live or UV-inactivated bacterial pathogens for 4 h; three independent experiments; RT-qPCR. C, D: One-way ANOVA tests were conducted. C: all inhibitor treatments were compared to the LPS-treated control. D (left panel): P-values were calculated for the linear trends of column averages from left to right. Statistical significance (p ≤ 0.05) is indicated by asterisks.
Fig. 3
Fig. 3. Conservation and functional impact of macrophage lncRNAs.
A Left: Evolutionary tree of selected mammalian species. Right: Percent base conservation of human LPS-inducible macrophage lncRNA sequences across the genomes of indicated species, sorted by evolutionary distance; top panel includes all 24 lncRNAs from Fig. 1E and data are shown as box plots (median and 75th-25th percentile interquartile range, whiskers indicate minimum and maximum data values), with species generation time overlayed; bottom panel focuses on specific lncRNAs. B Illustration of genomic locations of specified lncRNAs relative to nearest neighboring genes (distance in kilobases [kb] provided). Red triangles indicate transcriptional start site positions targeted by CRISPRi for lncRNA silencing. C Volcano plots from CRISPRi-based lncRNA loss-of-function experiments in THP1 cells stimulated with LPS for 8 h. Fold-changes (fc) compare lncRNA-knockdown cells to empty vector control cells. Results from three independent experiments. Two-tailed Student’s t-test p-values are shown. D Cytoscape network of lncRNAs (blue) and mRNAs from panel C, regulated upon lncRNA silencing (≥2-fold up or down, p ≤ 0.05, two-tailed Student’s t-test). E Pie charts showing proportions of all expressed mRNAs or LPS-responsive mRNAs (≥2-fold up or down, p ≤ 0.05, two-tailed Student’s t-test) affected by silencing of one or more lncRNAs. CE: 8 h LPS-stimulated THP1 cells and three independent replicates.
Fig. 4
Fig. 4. Comparative analysis of lncRNA loss-of-function effects at RNA and protein levels.
A Pearson correlation analysis (p-values shown, two-tailed test) comparing RNA-seq-determined significant mRNA fold-changes (from Fig. 3) and corresponding protein fold-changes. B Clustered heatmap showing aggregated factors regulated at both RNA and protein levels (≥2-fold up or down, p ≤ 0.05) upon lncRNA silencing. Clusters (A-H) and their primary Reactome pathways (Supplementary Fig. 5A) are indicated. C ENRICHR-based UMAP visualization of the “Biological Process” GO-term network, highlighting GO-terms associated with gene products that are significantly regulated at the RNA and protein levels (≥2-fold upregulation [red lines] or downregulation [blue lines], p ≤ 0.05, two-tailed Student’s t-test) upon silencing of the depicted lncRNAs. D Top left: correlation of mRNA (≥2-fold up or down, p ≤ 0.05, two-tailed Student’s t-test) and corresponding protein fold-changes (RNA-seq and proteomics, ≥ 3 independent experiments) in response to LPS (8 h, THP1 cells). Pearson correlation p-value (two-tailed test) is shown. Violin plots: fold-changes at the RNA- and protein-level in response to LPS of factors regulated upon lncRNA silencing (≥2-fold up [red] or down [blue], p ≤ 0.05 in data from A, B). Two-tailed Student’s t-test p-values are shown. E Schematic summary of hypothesized functions for the five studied lncRNAs in macrophages. All panels: 8 h LPS-stimulated THP1 cells and ≥ three independent replicates.
Fig. 5
Fig. 5. Development of GRADR for predicting lncRNA-protein interactions in macrophages.
A Illustration of the GRADR methodology. B Z-score heatmap and violin plot (overlayed averages as bars) displaying differential enrichment of RNA-binding and non-RNA-binding protein groups in OOPS-MS eluates (violin plot: averages from three independent experiments). C Illustration of the distribution of representative protein classes within cytoplasmic and nuclear fractions; data averaged from three independent proteomics experiments. D Percentage of ACTB mRNA and RMRP lncRNA across cytoplasmic (C) and nuclear (N) fractions (RNA-seq, averages and individual data points from two independent experiments). E Panels 1-2: GRADR-derived protein interactome for ACTB mRNA and RMRP lncRNA, plotting co-sedimentation Pearson r values against -log10 OOPS-MS RNA-binding p-values (two-tailed Student’s t-test). Proteins with r ≥ 0.5 and p ≤ 0.05 highlighted in blue. Panel 3: Reactome pathway analysis for proteins associated with RMRP (blue in panel 2). F Same as D), but for the indicated lncRNAs. G Grad-seq Pearson correlation matrix for proteins identified by GRADR (r ≥ 0.5 and p ≤ 0.05, two-tailed Student’s t-test) as potential interactors of the five lncRNAs shown in F (Pearson r color coded from red to white [1–0]). % cytoplasmic localization from C indicated to the left, protein-lncRNA interactions are noted below. Relevant clusters were subjected to Bioplanet pathway analysis (shown to the right). H UMAP plot displaying the glycerol gradient distribution (Grad-seq) of the five lncRNAs (highlighted as circles with black outlines) and proteins belonging to several cellular machineries. Relevant machineries highlighted for context. I Grad-seq Pearson r values determined for the indicated splicing-associated proteins (from G) and the five lncRNAs. All panels: 4 h LPS-stimulated G-MФ.
Fig. 6
Fig. 6. Functional dissection of lncRNA ROCKI in macrophages.
A GRADR-derived interactome for ROCKI, analogous to Fig. 5E (two-tailed Student’s test p-values and Pearson r). B Illustration of the ChIRP methodology. C Left: Volcano plot highlighting ChIRP-MS identified ROCKI interactors in THP1 cells (fold-changes comparing ROCKI to control ChIRP captures; two-tailed Student’s t-test p-values). Right: Venn diagram showing overlap between GRADR and ChIRP-MS interactome predictions for ROCKI. D Top: Representative Western blot of hnRNP L in control (-) and hnRNP L ( + ) CLIP eluates (size marker positions in kDa indicated). Bottom: RT-qPCR analysis showing enrichment of ROCKI in hnRNP L CLIP eluates from THP1 and G-MФ cells (two-tailed Student’s t-test; three independent experiments; mean +/- SD). E Left: Row Z-score heatmap of protein abundance in two THP1 hnRNP L CLIP eluates (C = control, L = hnRNP L CLIP). Middle: iBAQ heatmap showing averaged total protein abundance in the hnRNP L CLIP. Right: Fold-enrichment plot for the top 7 eluted proteins. F Left: IGV plots showing control and ROCKI ChIRP-seq signals on both DNA strands at specified genomic loci (THP1 cells). Right: qPCR quantification of ROCKI and MARCKS locus enrichment in ROCKI- compared to control-ChIRP captures. MARCKS primer locations indicated by triangles below IGV plot (colors correspond to replicates shown in qPCR quantifications; three independent experiments; mean +/- SD). Significant differences (p ≤ 0.05, One-way ANOVA test) indicated. G Volcano plot of mRNA regulation upon ROCKI silencing (data from Fig. 3C). Two-tailed Student’s t-test p-values are shown. H RT-qPCR analysis of GATA2 mRNA levels in THP1 cells following the indicated ROCKI and hnRNP knockdowns (KD) (three independent experiments; mean +/- SD). Primers targeting the specified GATA2 exon-exon junctions were used. All significant changes (p ≤ 0.05, One-way ANOVA test) are denoted by blue asterisks. Exact p-values (in the same order as the asterisks): Exon 3-4: 0.004, 0.002. Exon 5-6: 0.032. I Left: GATA2 overexpression strategy. Right: Comparison of protein regulation upon ROCKI silencing (data from Fig. 4, two-tailed Student’s t-test p-value ≤ 0.05)) versus GATA2 overexpression (THP1 cells). Pearson correlation analysis was performed, and r and p-value (two-tailed test) are shown. J Left: averaged fold-changes of LPS-inducible (≥2-fold induction) proteins upon ROCKI and GATA2 silencing (ranked by changes observed in the ROCKI silencing experiment). Right: Regulation of the respective proteins in response to LPS (data from Fig. 4D). K Summarizing model of ROCKI function in conjunction with GATA2 in macrophages. L Illustration of the SMyLR results page. All panels: G-MФ treated with LPS for 4 h, THP1 cells for 8 h.

References

    1. Djebali, S. et al. Landscape of transcription in human cells. Nature489, 101–108 (2012). - PMC - PubMed
    1. Derrien, T. et al. The GENCODE v7 catalog of human long noncoding RNAs: analysis of their gene structure, evolution, and expression. Genome Res. 22, 1775–1789 (2012). - PMC - PubMed
    1. Hon, C. C. et al. An atlas of human long non-coding RNAs with accurate 5’ ends. Nature543, 199–204 (2017). - PMC - PubMed
    1. Mattick, J. S. et al. Long non-coding RNAs: definitions, functions, challenges and recommendations. Nat. Rev. Mol. cell Biol.24, 430–447 (2023). - PMC - PubMed
    1. Rinn, J. L. & Chang, H. Y. Genome regulation by long noncoding RNAs. Annu. Rev. Biochem.81, 145–166 (2012). - PMC - PubMed

MeSH terms

LinkOut - more resources