. 2025 May 21;10(1):23.
doi: 10.1038/s41536-025-00410-5.

Establishment of salivary tissue-organoid biorepository: characterizing salivary gland stem/progenitor cells and novel differentiation marker PSMA/FOLH1

Affiliations

Establishment of salivary tissue-organoid biorepository: characterizing salivary gland stem/progenitor cells and novel differentiation marker PSMA/FOLH1

Syed Mohammed Musheer Aalam et al. NPJ Regen Med. .

Abstract

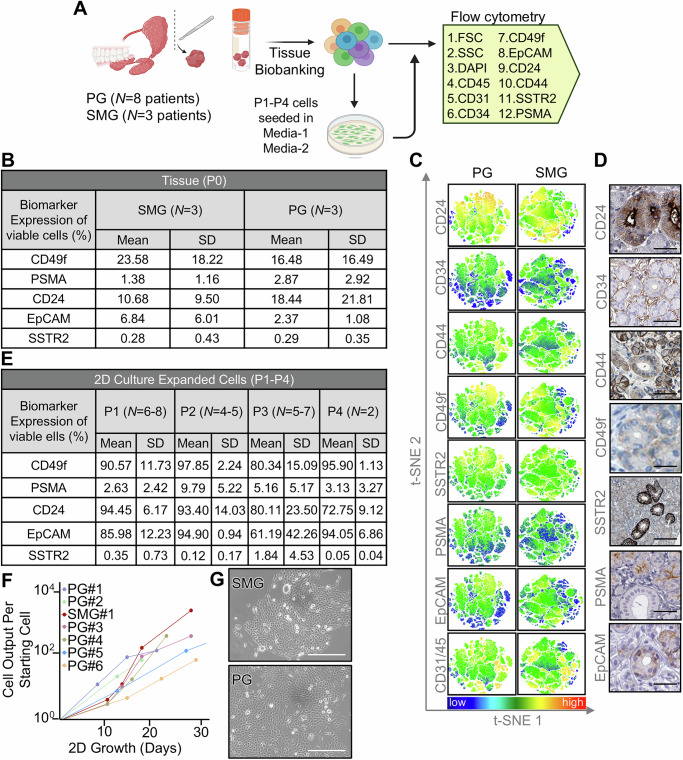
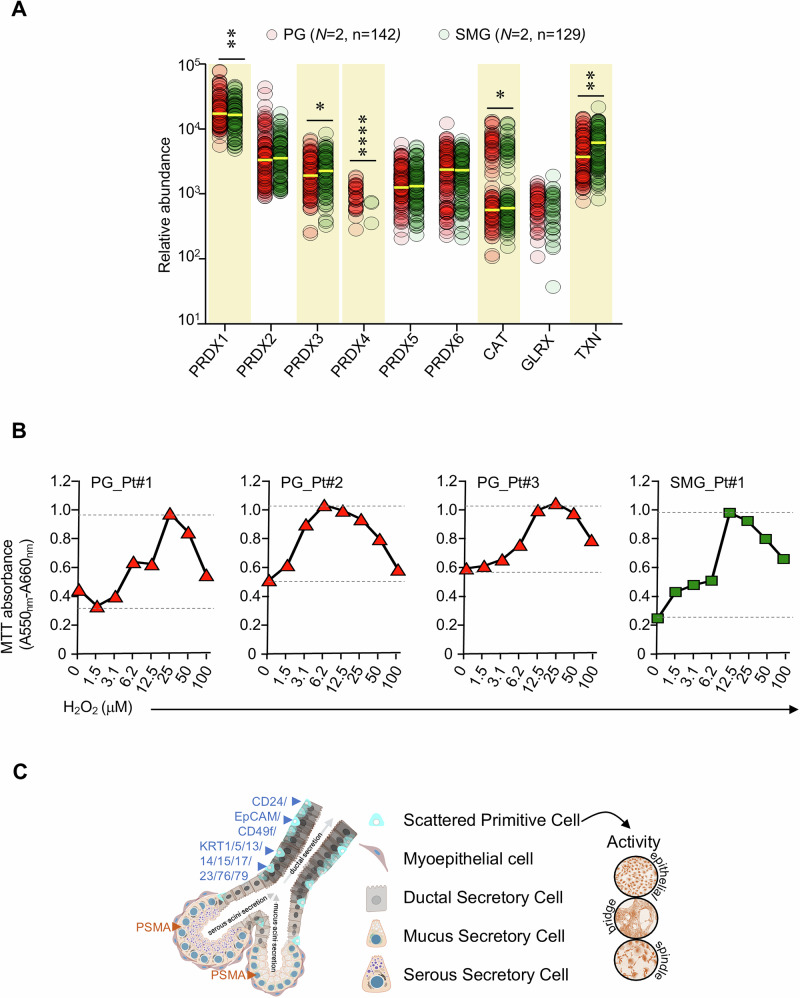
The salivary gland (SG) is vital for oral function and overall health through secretion of saliva. However salivary dysfunction due to aging, medications, autoimmune disorders, and cancer treatments poses significant challenges. We established the first diverse and clinically annotated salivary regenerative biobank at Mayo Clinic to study salivary gland stem/progenitor cells (SGSPCs). Optimization of cell isolation and progenitor assays revealed SGSPCs enriched within the CD24/EpCAM/CD49f+ and PSMA- phenotypes of both submandibular and parotid glands, with clonal differentiation assays highlighting heterogeneity. Induction of PSMA/FOLH1 expression was associated with SGSPC differentiation. Using mass spectrometry-based single cell proteomics, we identified 2461 proteins in SGSPC-enriched cells, including co-expressed cytokeratins, expressed in rare salivary ductal basal cells. Additionally, PRDX, a unique class of peroxiredoxin peroxidases enriched in SGSPCs, demonstrated H2O2-dependent growth, suggesting a role in salivary homeostasis. These findings provide a foundation for SGSPC research and potential regenerative therapies for salivary gland dysfunction.


Conflict of interest statement

Competing interests: The authors declare no competing interests.

Figures

Fig. 1
Fig. 1. Salivary tissue-organoid biobanking preserves primitive salivary cells.
A Schematic workflow outlining the steps involved in the processing of PG and SMG tissues to generate tissue-organoids, as well as their cryopreservation and biobanking from living or deceased male and female donors (created using Biorender.com). B Plot showing the age distribution among PG and SMG donors, considering both living and deceased individuals of both genders in the biobank. C) Plot depicting the weight distribution of PG and SMG tissues received at the laboratory, considering both living and deceased donors of both genders. D Plot illustrating the quantity of patient-derived tissue-organoid cryovials obtained from PG and SMG tissue masses received at the laboratory, considering both living and deceased donors of both genders. E Bar plot illustrating the distribution of PG and SMG tissue-organoids in the biobank, considering donors from both living and deceased individuals of both genders. F H&E staining of SMG and PG tissues and their corresponding tissue-organoids show characteristic ductal and acinar structures (100x magnification). G Representative brightfield images of cultured SMG and PG cells isolated from respective cryopreserved tissue-organoids (100x magnification). H Representative brightfield images of SMG and PG organoids cultured in 3D-matrigel (40x and 100x magnification) derived in culture following dissociation of respective tissue-organoids. I Representative immunofluorescence staining of 3D-matrigel-derived PG organoids with DAPI, Aquaporin 5, NKCC1, SMA, KRT5, KRT7, KRT8 and KRT14 antibodies. J Agarose gel (2%) image showing expression of AMY1A (162 bp), AQP5 (178 bp) in two consecutive 3D organoid cultures but not in 2D SMG and PG cultures by Reverse Transcriptase-Polymerase Chain Reaction (RT-PCR). Gene expression was normalized to ACTB (494 bp). Uncropped gel images are supplied as Supplementary Fig. S12. K) Plot showing 3D OIC frequency from cryopreserved salivary gland tissue-organoids.
Fig. 2
Fig. 2. Immunophenotypic analysis of salivary tissue-organoids.
A Experimental design of FACS-based characterization of cryopreserved salivary gland tissue and culture-expanded salivary cells derived from previously cryopreserved tissue (created using Biorender.com). B FACS-based biomarker characterization of unmanipulated salivary gland tissue. C T-distributed stochastic neighbor embedding (t-SNE) plots of PG and SMG tissue by biomarker of interest. Coloring correlates with expression intensity. Red indicates high expression, while blue signifies the absence of the cell marker expression. D Representative immunohistochemical staining shows expression of various biomarkers in salivary glands (Source: Human Protein Atlas, https://www.proteinatlas.org/). E FACS-based biomarker characterization of 2D-culture expanded cells derived from cryopreserved tissue. F Salivary cells in culture system can be expanded through four passages. G Brightfield image of salivary cell morphology in culture system.
Fig. 3
Fig. 3. Characterization of salivary progenitor activity in 2D and 3D assays.
A Giemsa staining of salivary colonies obtained in 2D colony-forming cell (CFC) assay showing three distinct morphologies under the microscope. B Plot showing the proportions of each of the three distinct colony types in 2D CFC assays when cells are plated, based on salivary gland type, immunophenotype, or in successive passages. C Plot showing the frequency of CFC and 3D-matrigel OIC when plated based on salivary gland type, immunophenotype, or in successive passages in the 2D CFC and 3D-matrigel organoid assays. D Brightfield microscopy images showing 3D-matrigel organoids obtained from FACS-purified CD24+ and EpCAM+ salivary cells, but not from CD24- and EpCAM- salivary cells. E Immunophenotypic characterization of single cells obtained from 3D-matrigel organoids and 2D culture expanded cells from human patient salivary gland tissue-organoids. F Plot showing progenitor yield per starting single PG and SMG cell in culture over time. (*, **, and *** indicate p-values < 0.05, 0.005, and 0.0005, respectively. #, ##, and ### represent p-values < 5 × 107, 5 × 1010, and 5 × 1013, respectively).
Fig. 4
Fig. 4. PSMA is a SGSPC differentiation marker.
A Design of 2D CFC and 3D-matrigel organoid Matrigel experiments to assess clonogenicity of PSMA- and PSMA+ cells. B PSMA- cells demonstrate clonogenic capacity in 2D CFC and 3D-matrigel organoid assays, while PSMA+ cells do not. C PSMA- cells purified from 15 salivary gland patient samples, unlike PSMA+ purified cells, generate organoids in 3D culture. D Proposed hierarchical lineage model by which PSMA+ cells differentiate from the more primitive, stem/progenitor-like, self-renewing PSMA- cells. E Experimental design of 2D and 3D FACS-based characterization of growing PSMA- salivary cells to gauge PSMA+ cell generation. F Agarose gel (2%) image showing expression of FOLH1(PSMA, 182 bp) in two consecutive 3D organoid cultures but not in 2D SMG and PG cultures by RT-PCR. Uncropped gel images are supplied as Supplementary Fig. S12. G PSMA- cells plated in 2D culture generate PSMA+ cells at confluence. H 3D-matrigel organoids derived from PSMA- cells give rise to PSMA+ cells through multiple passages. I Illustration of CpG islands in human PSMA promoter region. J Schematic workflow of bisulfite conversion of 35 of 38 CpG, PCR and sanger sequencing of DNA obtained from SMG. K Hypermethylation ( ~ 70%) of CpG in PSMA promoter in SMG tissue. Each circle indicates individual CpG dinucleotides. White and dark circles represent unmethylated and methylated CpG, respectively.
Fig. 5
Fig. 5. Unbiased LC-MS/MS-based single-cell proteomic profiling of purified primitive salivary cells.
A Overall workflow for single cell proteomics. Single cells (P1) from PG and SMG cells were isolated by FACS using DAPI-CD45-CD31-EpCAM+ immunophenotype, lysed and digested in 384-well plate using cellenONE platform. Mass spectrometry data of each single cell were acquired in diaPASEF mode using the timsTOF SCP mass spectrometer. A total of 2461 proteins across 271 single cells were identified (created using Biorender.com). B Number of identified proteins per cell from SMG and PG P1 cultures. On average, 1143 proteins and 1270 proteins per single cell were identified from PG and SMG, respectively. C A Venn diagram showing number of shared and unique differentially expressed proteins within the progenitor-rich single cells of both SMG and PG. D Dot plot showing protein counts per cell of 20 most abundantly detected proteins in progenitor rich cells in total salivary gland, SMG and PG. E Pie chart showing the sub-cellular location of proteins detected in PG (N = 2, n = 142) and SMG cells (N = 2, n = 129). G Pie chart showing the molecular type of proteins detected in PG (N = 2, n = 142) and SMG cells (N = 2, n = 129). N represents the number of patient samples and n represents number of SGSPC analyzed. Ingenuity pathway analysis was used for categorizing subcellular localization and function of proteins (QIAGEN Inc., https://digitalinsights.qiagen.com/IPA). N denotes the number of patients; n denotes the number of single cells.
Fig. 6
Fig. 6. Unbiased single cell proteome profiling identifies salivary stem/progenitor-specific cytokeratin profile.
A A plot showing the relative abundance of cytokeratins detected per individual cells (P1) from PG and SMG cells isolated by FACS using DAPI-CD45-CD31-EpCAM+ immunophenotype enriching for SGSPC activity. B The relationship between the keratin expression profile identified through single-cell proteomics in SGSPC and the salivary epithelial cell-type specific expression patterns in the immunohistochemistry-based map of human protein expression profiles explored through the Human Protein Atlas (https://www.proteinatlas.org/). C SGSPC-expressed keratins map to scattered ductal basal cells in salivary glands (Source: Human Protein Atlas, https://www.proteinatlas.org/). D UMAP-based cluster analysis of mouse SMG scRNA-seq data showing salivary cell clusters. E Dot plot showing the expression of murine analogs of human SGSPC-expressed cytokeratins (and EpCAM) across mouse salivary cell types (*, ** *** indicate p-values < 0.05, 0.005 0.0005, and 0.0001 respectively).
Fig. 7
Fig. 7. Single-cell proteomic analysis discriminates PG and SMG cells.
A Partial least squares discriminant analysis (PLS-DA) plot separates PG and SMG cells into distinct clusters. Proteins identified ≥50% of each cell types were used for the analysis after batch effect correction. Each circle represents data from an individual single cell. B Variable importance in projection (VIP) score plot of top 15 proteins discriminating PG and SMG cells. C Heatmap showing the hierarchical clustering of PG and SMG cells based on their protein expression. Red color represents up-regulated and blue color represents down-regulated. The differentially expressed proteins are mentioned on the y-axis, and PG and SMG cells on the x-axis. MetaboAnalyst (https://www.metaboanalyst.ca/docs/About.xhtml) was used to generated PLS-DA plot, VIP score plot and heatmap.
Fig. 8
Fig. 8. Single-cell proteomics reveals floodgate oxidative signaling in salivary cells.
A Antioxidant enzyme counts per individual cell, illustrating predominantly glutathione-independent peroxiredoxin system in salivary cells. B Cellular metabolic activity in proliferative PG (P1, N = 3) and SMG (P1, N = 1) cells was assessed using the MTT assay, measuring absorbance changes to evaluate cell viability after treatment with varying concentrations of H2O2 over a 72 h duration. C illustration showing distribution of cell markers and keratins in the salivary glands (created using Biorender.com).

Similar articles

References

    1. Chibly, A. M., Aure, M. H., Patel, V. N. & Hoffman, M. P. Salivary gland function, development, and regeneration. Physiol. Rev.102, 1495–1552 (2022). - PMC - PubMed
    1. Pedersen, A. M. L., Sorensen, C. E., Proctor, G. B., Carpenter, G. H. & Ekstrom, J. Salivary secretion in health and disease. J. Oral. Rehabil.45, 730–746 (2018). - PubMed
    1. Mercadante, V., Al Hamad, A., Lodi, G., Porter, S. & Fedele, S. Interventions for the management of radiotherapy-induced xerostomia and hyposalivation: A systematic review and meta-analysis. Oral. Oncol.66, 64–74 (2017). - PubMed
    1. Taïeb, D. et al. PSMA-Targeted Radionuclide Therapy and Salivary Gland Toxicity: Why Does It Matter?. J. Nucl. Med.59, 747–748 (2018). - PubMed
    1. Emperumal, C. P. et al. Oral Toxicities of PSMA-Targeted Immunotherapies for The Management of Prostate Cancer. Clin. Genitourinary Cancer22, 380–384 (2023). - PubMed

LinkOut - more resources