. 2025 May 22;16(1):4745.
doi: 10.1038/s41467-025-59997-4.

Multiomic analysis of human kidney disease identifies a tractable inflammatory and pro-fibrotic tubular cell phenotype

Affiliations

Multiomic analysis of human kidney disease identifies a tractable inflammatory and pro-fibrotic tubular cell phenotype

Maximilian Reck et al. Nat Commun. .

Abstract

Maladaptive proximal tubular (PT) epithelial cells have been implicated in progression of chronic kidney disease (CKD), however the complexity of epithelial cell states within the fibrotic niche remains incompletely understood. Hence, we integrated snRNA and ATAC-seq with high-plex single-cell molecular imaging to generate a spatially-revolved multiomic atlas of human kidney disease. We demonstrate that in injured kidneys, a subset of HAVCR1+VCAM1+ PT cells acquired an inflammatory phenotype, upregulating genes encoding chemokines, pro-fibrotic and senescence-associated proteins and adhesion molecules including ICAM1. Spatial transcriptomic and multiplex-immunofluorescence determined that specifically these VCAM1+ICAM1+ inflammatory PT cells localised to the fibrotic niche. Ligand-receptor analysis highlighted paracrine signaling from inflammatory PT cells mediating leucocyte recruitment and myofibroblast activation. Loss of HNF4α and activation of NF-κβ and AP-1 transcription factors epigenetically imprinted the inflammatory phenotype. Targeting inflammatory tubular cells by administering an AP-1 inhibitor or senolytic agent ameliorated inflammation and fibrosis in murine models of kidney injury, hence these cells may be a tractable target in CKD.


Conflict of interest statement

Competing interests: A.N., W.Y., N.S., C.W. are current or previous employees and shareholders of NanoString Technologies, now Bruker Spatial Biology. The remaining authors declare no competing interests.

Figures

Fig. 1
Fig. 1. A multiomic single-nuclei atlas of kidney injury.
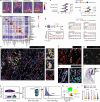
a Overview of the single nuclear multiome (paired Assay for Transposase Accessible Chromatin for sequencing (snATAC-seq) and snRNA-seq) as well as sub cellular-resolution spatial transcriptomics (CosMx SMI 6000 transcript panel) workflows. For the multiome assay nuclei were isolated from snap-frozen human nephrectomy specimens from control (n = 7) or unilateral ureteric obstructed (UUO, n = 5) kidneys and processed in pools of three to five samples per library using the 10x Genomics Multiome Assay. Adjacent FFPE tissue was used for spatial transcriptomics analysis for a subset of samples (UUO, n = 5; Control, n = 2). b Weighted-nearest neighbour UMAP projection of joint transcriptome and open chromatin state of 46,957 nuclei with detailed cluster annotations. PEC parietal epithelial cell, PT proximal tubule, DTL descending thin limb, ATL ascending thin limb, TAL thick ascending limb, DCT distal convoluted tubule, CNT connecting tubule, PC principal cell, IC intercalated cell, vSMC vascular smooth muscle cell, JG cell juxtaglomerular cell, pDC plasmacytoid dendritic cell, cDC classical dendritic cell, Th T helper cell, Tc cytotoxic T cell. c UMAP projection annotating cells to control or UUO kidneys. d Gene expression score of epithelial injury genes universally expressed in injured nephron segments (PROM1, DCDC2, SPP1, ITGB6, ITGB8). e Percentage of nuclei assigned to each cell type as a proportion of all epithelial cells (for epithelial clusters, left) and of total cells (for non-epithelial clusters, right) in control (n = 7) and obstructed (n = 5) kidneys. Plots show means ± standard error of the mean (SEM). Wilcoxon rank-sum test. *p < 0.05; **p < 0.01. f UMAP plots of the CosMx 6000-plex dataset showing cells coloured by their broad annotations. g Representative figures of cells from control and UUO kidneys plotted in 2D space. Cells are coloured according to the broad cell types (Fig. 1f). Source data are provided as a Source Data file.
Fig. 2
Fig. 2. Injured PT cells can adopt a pro-inflammatory, pro-fibrotic phenotype.
a UMAP of proximal tubule (PT) cells coloured by cell phenotype and projected RNA velocities (arrows). b Barplot showing mean (±SEM) percentage of injured and inflammatory PT cells in control (n = 7) and obstructed (UUO, n = 5) kidneys as a proportion of total PT cells. Wilcoxon rank-sum test. c Dot plot of selected differentially expressed genes in healthy, injured and inflammatory PT cells. Dot colours show the averaged gene expression values (log scale); size indicates proportion of cells expressing each gene. d Identification of inflammatory PT cells in the Kidney Precision Medicine Project (KPMP) snRNA-seq dataset. Top panel: original adaptive PT (aPT) annotations; bottom panel: KPMP cells adopting an inflammatory PT cell phenotype. e Density plot highlighting cells co-expressing injury (HAVCR1, VCAM1) and inflammatory (CCL2, CXCL1) cell specific transcripts. f Top panel: UMAP (as in Fig. 2a) with cells ordered in pseudotime on a trajectory from healthy PT segments to the inflammatory cell state. Bottom panel: percentage of cells in each subcluster as a proportion of total PT cells at that trajectory point. g Heatmap of scaled gene expression along the pseudotime trajectory. h Signature scores of GO terms enriched in healthy (PT S1-S3) or injured and inflammatory PT cells. i Proportion of total PT cells adopting a healthy, injured and inflammatory phenotype at different timepoints in single-cell/nuclei datasets in murine models of ischaemia-reperfusion injury (IRI, top) and reversible unilateral ureteric obstruction (R-UUO, bottom). j Genes differentially expressed in inflammatory PT cells in the CosMx (6000-plex panel) dataset. The dot colours show the averaged gene expression values (log scale) and size indicates proportion of cells expressing each gene. k Representative image of obstructed tissue section analysed by CosMx, with dots representing cells in their 2D coordinates. PT cells are coloured according to cell state, with selected other cell types highlighted. Plots on the right show high-resolution cell segmentation boundaries in areas enriched with inflammatory (top) or injured PT cells (bottom). Dots represent individual injury-associated (red) and inflammatory-associated (yellow) transcripts. Source data are provided as a Source Data file.
Fig. 3
Fig. 3. Inflammatory PT cell states are associated with the fibrotic niche in human kidney disease.
a Density maps of cell type abundance overlayed on the same tissue section as in Fig. 2k. b Cell neighbourhoods in UUO samples (n = 5). Heatmap shows the mean enrichment (log2 scale, mean weighted by cell type abundance) of each cell type within a 25 µm radius of the reference cell type. Values greater or less than zero indicate enrichment or depletion of the cell type. cDC, classical dendritic cell. c Bar plots showing the enrichment ratio of myofibroblasts and myeloid cell types in proximity to inflammatory cell states in UUO samples (n = 5). Plots show means ± SEM. Paired two-sample Student’s t test. d Mean enrichment ratio of indicated transcripts adjacent to healthy, injured and inflammatory PT cell states relative to randomly sampled cells. x-axis: distance from centroids of all cells of that group, with transcripts quantified in 1 µm intervals. e Representative image of 5-plex immunofluorescence of obstructed nephrectomy tissue (from n = 4 samples), with insets showing higher magnification images. Scale bars: large image, 100 µm; small images, 20 µm. f 3-plex immunofluorescence demonstrating VCAM1+/ICAM1+ (arrow) and VCAM1+/ICAM1- tubules (arrowhead) and the parietal epithelium of a glomerulus (*). Scale bar, 50 µm. g 5-plex immunofluorescence of healthy kidneys (from n = 2 samples), highlighting VCAM1+ tubular cell (arrow) and VCAM1+ parietal epithelial cells (arrowhead). Scale bar, 100 µm. h Immunofluorescence of obstructed kidney with CD68+ cells (arrows, left) in the lumen of ICAM1+ tubules. Arrowheads highlight CD68+ cells filopodia anchoring to ICAM1+ tubular cells (right). Scale bar, 20 µm. i Representative image of tubule (PanCK+), myofibroblast (FAP+) and macrophage (CD68+) segmentation. j Tubules were identified as FAP-/CD68-/PanCK+ and the proportion staining for VCAM1 and ICAM was determined. k UMAP of segmentation objects according to staining intensities of PanCK, VCAM1, ICAM1, FAP and CD68. l Enrichment of FAP and CD68 in proximity to VCAM1+/ICAM1- or VCAM1+/ICAM1+ tubules. Violin plots of the percentage of the area covered (log2 scale) by FAP+ or CD68+ segmentations objects within a 25 µm radius of 6,304 tubule boundaries. Wilcoxon rank-sum test. Source data are provided as a Source Data file.
Fig. 4
Fig. 4. Inflammatory cell states in the kidney across disease aetiologies.
a Workflow to spatially quantify 1,000 transcript species on the CosMx platform in nephrectomy samples from patients with chronic pyelonephritis (n = 4) and renal biopsies from patients with minimal change disease (n = 3) or IgA nephropathy (n = 6). b Left: UMAP visualisation of 246,055 cells across all samples coloured by cell annotations. PEC parietal epithelial cell, PT proximal tubular cell, LOH-DCT Loop of Henle and distal convoluted tubule, CD Collecting Duct, SMC Smooth muscle cell. Right: Representative images of nephrectomy and biopsy samples, showing cells coloured by annotation key in UMAP. c Representative spatial plot of pyelonephritic kidney. Dots represent individual cells coloured by their niche cluster. d Higher resolution of the rectangular inset in (c). highlighting inflammatory (arrows) and injured (arrowhead) tubular epithelia. Left: Cells coloured according to activation state and broad cell lineage. Right: Cells coloured according to granular annotation. e Higher resolution of areas indicated in (d) highlighting inflammatory (arrow) and injured (arrowhead) epithelia. Dots show the location of injury-associated (red) or inflammatory-associated (yellow) transcripts with cells coloured by activation state and broad lineage. f Dotplot of expression of injury and inflammatory markers identified by snRNA-seq (Fig. 2c) in the CosMx (1000-plex) dataset. Dot colours show the averaged gene expression (log scale) and size indicates proportion of cells expressing the gene. g Mean enrichment ratio of transcripts in healthy, injured and inflammatory PT cell states relative to randomly sampled cells. x-axis: distance from centroids of all cells of the respective group, with transcripts quantified in 1 µm intervals. h Bar plots showing enrichment of myofibroblasts and myeloid cell types in proximity to PT cell states. Plots show means ± SEM. Paired two-sample Student’s t test. i Correlation between percentage of inflammatory PT cells and the proportions of myofibroblasts, monocytes and classical dendritic cells (cDC) in biopsy samples. Graph shows linear regression slope with Pearson co-efficient. j Correlation between percentage of inflammatory PT cells and estimated glomerular filtration rate (eGFR) in biopsy samples. Linear regression slope with Pearson co-efficient.
Fig. 5
Fig. 5. Intercellular signalling mediating immune recruitment and fibroblast activation.
a Dot plots showing expression of ligands in PT clusters (left columns) and respective receptors in immune subclusters (right columns). Dot size is scaled by the fraction of cells expressing the gene and colour by the average (log-scale) scaled expression values. b Representative image of an obstructed nephrectomy sample analysed on the CosMx 6000-plex platform. Cells are coloured according to niche assignment. c Barplot showing the log2-fold enrichment ratio of observed cell type abundance compared to random tissue distribution within each niche, coloured as per legend in (b). d Density map indicating the inflammatory PT cell distribution in the same tissue section as (b). e Barplot showing the contribution of individual cell types to total cytokine transcripts in the fibrotic niche, presented as proportion of total detected transcripts. f High-resolution image of spatial localisation of cytokines (left), monocyte-associated (blue) and macrophage-associated (red) transcripts in the same frame (right). Cells are coloured by cell lineage and epithelial activation state. g Density maps showing the spatial distribution of CCL2 (top) and CCR2 (bottom) transcripts in the same tissue section as (b). h Dot plots showing ligands expressed by in PT clusters (left column) and respective receptors in (myo)fibroblasts (right columns). Dot size is scaled by the fraction of cells expressing the gene and colour by the average (log-scale) scaled expression values. i Density maps showing the spatial distributions of indicated myofibroblast transcripts in same section as (b). j High-resolution image of the spatial location of platelet-derived growth factor (PDGF) ligands (left) and receptors (right). Cells are coloured by cell lineage and epithelial activation state. k Dotplots showing the expression of ligands (left columns) and upregulated receptors in PT cell subsets (right columns). The dot size is scaled by the fraction of cells expressing the gene and the colour by the average (log-scale) expression.
Fig. 6
Fig. 6. Collapse of an HNF4A-driven gene-regulatory network enables loss of proximal tubule identity.
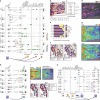
a Transcription factor (TF) to target gene linkage is inferred when there is high correlation between gene expression and chromatin accessibility in cis-regulatory elements (CREs) harbouring the relevant TF binding motif. b Histogram showing the number of CREs linked to each gene. c Top panel: genes down-regulated (L2FC < -0.1, adj. p-value < 0.05) in injured/inflammatory compared with healthy PT cells (rectangular box). Bottom panel: bar graph showing TFs ordered by the number of down-regulated target genes. Colour indicates the number of CREs linked to down-regulated genes harbouring respective TF motifs. d Heatmap showing the Jaccard similarity coefficient between pairs of TFs, with 1 indicating a full overlap and 0 no overlap of target genes. e Gene-regulatory network for a subset of module A TFs. CREs are shown as diamonds with darker blue colour indicating decreased accessibility. Target genes are shown as circles with darker red colour indicating stronger down-regulation. f Changes in module A (top) and module B (bottom) TF activity along the pseudotime trajectory from healthy to inflammatory PT cells (Fig. 2f). Left: expression of genes encoding TFs. Middle: accessibility score for TF-target CREs. Right: expression of TF target genes. g HNF4-α binding sites in CREs linked to TFs in module A and B. Edge width indicates the number of bound CREs and colour the mean accessibility change (negative values indicate reduced accessibility in injured/inflammatory compared with healthy PT cells). h HNF4-α motif footprint in PT cell states. i Violin plots of HNF4-α target gene expression in PT cells (dots coloured according to cell phenotypes) following ischaemia-reperfusion injury in mice (Fig. 2i). j Upper: chromatin accessibility in healthy, injured and inflammatory PT cells at the HNF4A locus with corresponding HNF4A mRNA expression (right, dot size scaled by the proportion of cells expressing the gene and coloured by the average (log-scale) expression). Middle: regions harbouring HNF4-α motifs. Lower: HNF4-α CUT&RUN signal in adult human kidney. k Sustained injury disrupts the HNF4A auto-regulatory loop, depleting HNF4A mRNA and protein leading to loss of PT identity.
Fig. 7
Fig. 7. Transcription factors associated with inflammatory programming of proximal tubule cells.
a TF gene expression plotted against the TF score (mean of target gene and target CRE signature scores) highlights TFs enriched in healthy and injured/inflammatory PT cells. b Chromatin accessibility dynamics along the trajectory from healthy to inflammatory PT cells (Fig. 2f). Left panel: CREs linked to upregulated genes (L2FC > 0.1, adj. p-value < 0.05) clustered into modules with increased accessibility early, intermediate and late in the trajectory. Right panel: Smoothed graphs summarizing the mean accessibility for CREs in each module, with the percentage of injured and inflammatory PT cells above. c Proportions of CREs with putative binding sites for the respective TF family, grouped by module. d UMAP (Fig. 2a) of the AP-1 and NF-κβ1 TF score in PT cells. e TF footprint of JUN:FOS and RELA motifs in healthy, injured and inflammatory PT cells. f Left panel: intersection of chromosomal regions binding JUN or NF-κβ1 by CUT&RUN assay in renal proximal tubular cells (RPTECs) following TNF administration with differentially accessible chromatin in inflammatory PT cells. Right panel: Motif enrichment ratio in regions of intersection. g Chromatin profile and CUT&RUN signal tracks at archetypal inflammatory PT genes with AP-1 or NF-κβ1 target CREs. Upper tracks: The ATAC signal in healthy and injured/inflammatory PT cells. Lower track: The JUN or NF-κβ1 CUT&RUN peaks indicating the physical presence of the TF at genomic loci in TNF-treated RPTECs. h Visualisation of the predicted regulatory links between AP-1 or NF-κβ1 and selected genes upregulated in inflammatory PT cells (Fig. 2c). CREs are shown as diamonds (darker blue colour indicating increased accessibility) and target genes as circles (darker red colour indicating greater up-regulation). TF to CRE edges are coloured by the TF bound to the CRE.
Fig. 8
Fig. 8. Targeting inflammatory PT cells ameliorates fibrosis in mouse models of AKI to CKD transition.
a Experimental schema: mice underwent IRI and were administered T5524 (n = 8) or vehicle (n = 6) or underwent sham surgery and administered T5524 or vehicle (n = 4 for both groups). Kidney weights (b) and percentage of renal cortex staining for picrosirius red (PSR) with representative images (c) or the macrophage marker IBA1 (d). e Expression of fibrosis and myeloid cell genes in renal cortex. f Left: immunofluorescence for KIM1/VCAM1. White arrows: KIM1+/VCAM1+ inflammatory tubules; green arrows: KIM+/VCAM1- injured tubules; blue arrows: healthy KIM1-/VCAM1- tubules. Middle: representative images from T5224 and vehicle-treated mice. Right: KIM1+/VCAM1- or KIM1+/VCAM1+ cells in proportion to total PT cells. g Expression of injured and inflammatory PT cell genes in renal cortex. h Top tracks: The chromatin accessibility at AP-1 target genes in human PT cell subsets with corresponding gene expression indicated by dot plots (right). Bottom tracks: JUN binding assessed by CUT&RUN in TNF-treated RPTECs (Fig. 6f). ATAC peaks that correlate with gene expression are linked to the TSS (yellow line). i Violin plot of BCL2 expression in human PT subsets (log scale). j Experimental schema: Mice underwent unilateral ureteral obstruction (UUO), which was reversed after 7 days followed by 14 daily gavages of BCL2 inhibitor ABT-263 or vehicle. k Heatmap of scaled gene expression in renal cortex from mice undergoing sham surgery, at 7 days post reversal of ureteric obstruction (R-UUO, d14) or after R-UUO and then treatment with ABT-263 or vehicle. l Inflammatory PT cells as a proportion of total PT cells derived from deconvolution of bulk RNA-seq of renal cortex from animals undergoing sham surgery (n = 4), 7 days after reversal of UUO (d14 R-UUO, n = 4), or 35 days after reversal of UUO with administration of ABT (n = 3) or vehicle (n = 5). For all data, values are means ± SEM, with analyses performed using Wilcoxon rank-sum test.

References

    1. Yu, S. M. & Bonventre, J. V. Acute kidney injury and maladaptive tubular repair leading to renal fibrosis. Curr. Opin. Nephrol. Hypertens.29, 310–318 (2020). - PMC - PubMed
    1. Tanaka, S., Portilla, D. & Okusa, M. D. Role of perivascular cells in kidney homeostasis, inflammation, repair and fibrosis. Nat. Rev. Nephrol.19, 721–732 (2023). - PubMed
    1. Kuppe, C. et al. Decoding myofibroblast origins in human kidney fibrosis. Nature589, 281–286 (2021). - PMC - PubMed
    1. Lake, B. B. et al. An atlas of healthy and injured cell states and niches in the human kidney. Nature619, 585–594 (2023). - PMC - PubMed
    1. Park, J. et al. Single-cell transcriptomics of the mouse kidney reveals potential cellular targets of kidney disease. Science360, 758–763 (2018). - PMC - PubMed

MeSH terms

Substances