. 2025 May 21;15(1):17583.
doi: 10.1038/s41598-025-02167-9.

Stress exposure affects amyotrophic lateral sclerosis pathogenesis via PI3K/Akt and focal adhesion pathways: evidence from three experimental models

Affiliations

Stress exposure affects amyotrophic lateral sclerosis pathogenesis via PI3K/Akt and focal adhesion pathways: evidence from three experimental models

Daniela Maria Rasà et al. Sci Rep. .

Abstract

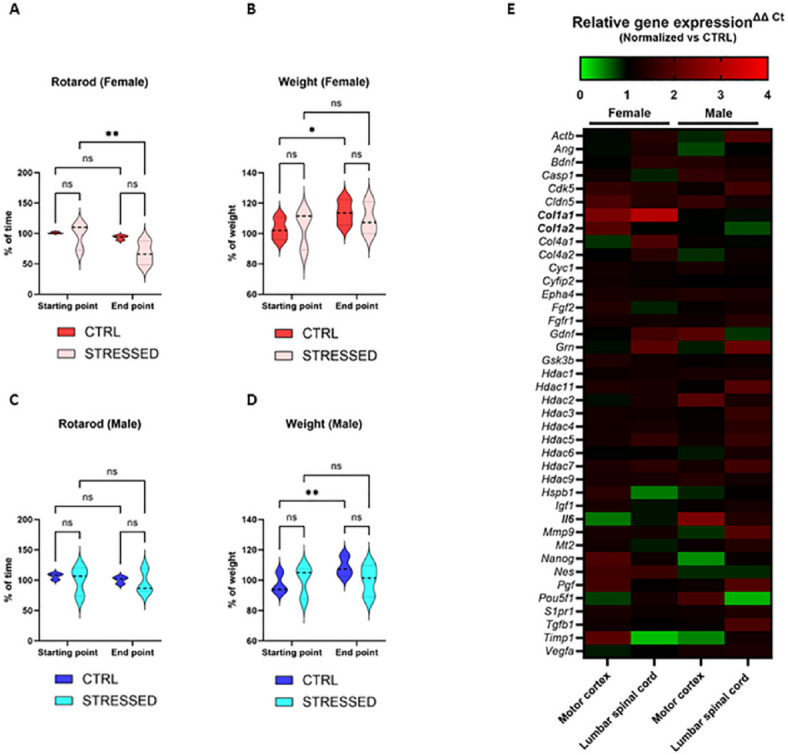
Amyotrophic lateral sclerosis (ALS) is a multifactorial motor neuron (MN) disease, characterized by several cellular dysfunctions, many of which are shared by different neurodegenerative diseases. Here, we investigated whether a stressful lifestyle might exacerbate the altered mechanisms and affect the disease progression in ALS-predisposed conditions. To model stress in vivo, SOD1G93A mice underwent a chronic unpredicted mild stress protocol. This resulted in a significant impairment in body weight gain and motor performance, in a gender-specific manner. Moreover, the gene expression of Col1a1, Col1a2 and Il6 was strongly dysregulated in motor cortex and/or spinal cord of stressed mice. To assess the direct impact of stress on MNs, NSC-34 hSOD1G93A cells underwent oxygen and glucose deprivation. Compared to NSC-34 hSOD1WT, mutated MNs exhibited a reduced capacity to cope with stress. By performing gene expression, protein-protein interaction, gene ontology and pathway enrichment analyses, we also revealed the pivotal role of the PI3K/Akt and focal adhesion pathways (triggered by Gsk3b, Il6, Igf1 and/or collagen) in mediating stress response. Similar results were observed in stressed human iPSCs-derived TARDBPG298S MNs. In conclusion, our results suggest that the PI3K/Akt and focal adhesion pathways play a crucial role in stress response across different ALS-predisposed models: the study paves the way for novel therapeutic targets and highlights the relevance of a healthy lifestyle.

Keywords: Bioinformatic analysis; Exposome; Molecular mechanisms; Neuromuscular disease; Stressor.


Conflict of interest statement

Declarations. Competing interests: The authors declare no competing interests.

Figures

Fig. 1
Fig. 1
Chronic unpredicted mild stress effects in female and male ALS-predisposed mice. A-B. Rotarod and weight results in female hSOD1G93A are showed at starting and end point in STRESSED and CTRL (not stressed) groups. Results are represented as median and quartile range of three mice per group, considering the average of three trials. Mixed-effects analysis followed by Uncorrected Fisher’s LDS analysis was used for statistical results. Rotarod of female hSOD1G93A STRESSED at end point vs. female hSOD1G93A STRESSED at starting point **p < 0.01; weight of female hSOD1G93A CTRL at end point vs. female hSOD1G93A CTRL at starting point *p < 0.05. C-D. Rotarod and weight results in male hSOD1G93A are described at starting and end point in STRESSED and CTRL (not stressed) groups. Results are represented as median and quartile range of three mice per groups, considering the average of three trials. Mixed-effects analysis followed by Uncorrected Fisher’s LDS analysis was used for statistical results. Weight of male hSOD1G93A CTRL at end point vs. male hSOD1G93A CTRL at starting point **p < 0.01. E. Heatmap graph (created using GraphPad Prism version 10.1.2 for Windows) shows the relative gene expression in motor cortex and lumbar spinal cord samples of STRESSED groups normalized to CTRL (distinguishing female and male groups). Results are showed as red-to-green scale, using data of three mice per groups and indicating 1 (black) as baseline reference point of female or male hSOD1G93A CTRL (not shown). Two-way ANOVA followed by Sidák’s multiple comparison test was used as statistical analysis and the significantly results were listed in Table 1.
Fig. 2
Fig. 2
Morphological analysis related to RA treatment (20 µM for 4 days). A, E, I. Representative images acquired using the built-in Basler Ace 1920 –155 μm camera of the Incucyte system. Scale bar = 200 μm. B-D, F-H, J-L. Cell-body cluster, neurite length and neurite branch point are significantly increased after RA treatment, w/wo doxycycline in NSC-34 naïve, hSOD1WT and hSOD1G93A. Results are represented as median and quartile range of three independent experiments. Two-way ANOVA followed by Sidák’s multiple comparisons test was used as statistical analysis. 1% serum + RA 20 µM vs. 1% serum *p < 0.05, **p < 0.01 and ***<0.001. M, O, Q. NSC-34 naïve, hSOD1WT hSOD1G93A treated with RA and immunolabeled by anti-ChAT antibody (red). Representative images acquired by Eclipse E600 (Microfire Camera 2-Megapixel Color Imaging, 1600 × 1200). Scale bar = 50 μm. N, P, R. CTCF is significantly increased in NSC-34 naïve, hSOD1WT hSOD1G93A, w/wo doxycycline. Results are represented as median and quartile range of three independent experiments (n ≥ 10 neurons for each experiment). Two-way ANOVA followed by Sidák’s multiple comparisons test was used as statistical analysis. 1% serum + RA 20 µM vs. 1% serum *p < 0.05, **p < 0.01 and ***<0.001.
Fig. 3
Fig. 3
OGD stress validation in NSC-34 hSOD1 cells. (A) The in vitro stress model was established using OGD conditions, by culturing NSC-34 cells in low glucose (LG) medium and CoCl2. All the tested concentrations of CoCl2 (50, 100, 200, 300 and 400 µM) are able to induce a reduction of cell viability, both in NSC-34 hSOD1WT and hSOD1G93A, compared to LG culture; ~50% of cell death is observed using 100 µM of CoCl2. Results are represented as mean ± SD of three independent experiments. Two-way ANOVA followed by Sidák’s multiple comparisons test was used for comparing different LG and CoCl2 concentrations in each cell line and different cell lines in each experimental condition. LG + CoCl2 50 µM/ 100 µM/ 200 µM/ 300 µM/ 400 µM vs. LG *p < 0.05, **p < 0.01 and ****p < 0.0001. NSC-34 hSOD1G93A vs. NSC-34 hSOD1WT ##p < 0.01. (B) NSC-34 hSOD1WT and hSOD1G93A, CTRL or STRESSED, were treated with MitoTracker Red CMXRos. Representative images acquired in live imaging by built-in Basler Ace 1920 –155 μm camera of the Incucyte system. (C) Quantifications of orange signal (visible in red), related to mitochondria membrane potential, performed using automated fluorescent analysis of the Incucyte system. Total orange object integrated intensity results is normalized to phase object count. Results are represented as median and quartile range of six independent experiments. Two-way ANOVA followed by Tukey’s multiple comparison test was used as statistical analysis. NSC-34 hSOD1G93A CTRL vs. NSC-34 hSOD1WT STRESSED and NSC-34 hSOD1G93A STRESSED vs. NSC-34 hSOD1G93A CTRL *p < 0.05. (D) Representative images showing HIF1α and cleaved caspase 3 protein levels of NSC-34 hSOD1WT and hSOD1G93A, in both experimental conditions (CTRL and STRESSED). NG stands for Normal Glucose. E-F. Protein expression levels quantified by normalizing all experimental conditions vs. NSC-34 hSOD1WT CTRL. Full-length blots are shown in Fig. S5. Results are represented as median and quartile range of three independent experiments. Two-way ANOVA followed by Tukey’s multiple comparison test was used as statistical analysis. NSC-34 hSOD1WT STRESSED vs. NSC-34 hSOD1WT CTRL *p < 0.05 and **p < 0.01; hSOD1G93A STRESSED vs. NSC-34 hSOD1WT STRESSED *p < 0.05; hSOD1G93A CTRL vs. NSC-34 hSOD1WT CTRL*p < 0.05.
Fig. 4
Fig. 4
Gene expression and relative PPI in CTRL and STRESSED cells. (A) Heatmap graph (created using GraphPad Prism version 10.1.2 for Windows) shows relative gene expression of NSC-34 hSOD1WT STRESSED, NSC-34 hSOD1G93A CTRL and STRESSED, normalized to NSC-34 hSOD1WT CTRL. Results are showed as red-to-green scale of nine independent experiments, indicating 1 (black) as baseline of NSC-34 hSOD1WT CTRL (not shown). Two-way ANOVA followed by Tukey’s multiple comparisons test was used as statistical analysis and the details were listed in Table 2. (B) Heatmap graph (created using GraphPad Prism version 10.1.2 for Windows) shows the relative expression of genes of interest, in both CTRL and STRESSED experimental conditions. Results are showed as red-to-green scale of nine independent experiments, indicating 1 (black) as baseline of NSC-34 hSOD1WT (not shown). Unpaired t-test statistical analysis for each gene was used: NSC-34 hSOD1G93A CTRL vs. NSC-34 hSOD1WT CTRL, NSC-34 hSOD1G93A STRESSED vs. NSC-34 hSOD1WT STRESSED. C-D. Bar plot graphs show the genes significantly up-regulated and/or down-regulated, based on the unpaired t-test statistical analysis previously described in CTRL and STRESSED conditions. E-F. PPI, performed by STRING analysis, shows interactions among predicted proteins in CTRL and STRESSED conditions.
Fig. 5
Fig. 5
GO and pathway enrichment analysis in CTRL and STRESSED NSC-34 cells. A-B. Log2FC of gene expression related to NSC-34 hSOD1G93A and NSC-34 hSOD1WT for CTRL condition, was used to performed GO (including BP, CC and MF in GO three ontology plots) and pathway enrichment analysis by SRplot (free online platform: http://www.bioinformatics.com.cn/SRplot, accessed on 8 May 2024).C-D Log2fc of interesting gene expression related to NSC-34 hSOD1G93A and NSC-34 hSOD1WT for STRESSED condition, was used to performed GO (including BP, CC and MF in GO three ontology plots) and pathway enrichment analysis by SRplot (free online platform: http://www.bioinformatics.com.cn/SRplot, accessed on 15 March 2024).
Fig. 6
Fig. 6
OGD stress effects in human MNs (healthy and TDP-34). A. Representative images acquired using the built-in Basler Ace 1920 –155 μm camera of the Incucyte system. Scale bar = 100 μm. B-C. Neurite length and branch points are significantly changed upon stress exposure in healthy MNs (MN_healthy). TDP-43 MNs (MN_TDP-43) show relevant morphological alterations both in not stressed (CTRL) and STRESSED experimental conditions, as compared to healthy cells. Results are represented as median and quartile range of three independent experiments. Two-way ANOVA followed by Uncorrected Fisher’s LSD analysis was used for statistical results. MN_healthy STRESSED, MN-TDP-43 CRTL and STRESSED vs. MN_healthy CTRL ****p < 0.0001. D-M. Violin plots show relative gene expression of MN_healthy STRESSED and MN_TDP-43 CTRL and STRESSED normalized to MN_healthy CTRL. Results are represented as median and quartile range of three independent experiments. Two-way ANOVA followed by Tukey’s multiple comparison test was used as statistical analysis for each gene was studied: *p < 0.05, **p < 0.01, ***<0.001 and ****p < 0.0001.

References

    1. Chia, R., Chiò, A. & Traynor, B. J. Novel genes associated with amyotrophic lateral sclerosis: diagnostic and clinical implications. Lancet Neurol.17, 94–102 (2018). - PMC - PubMed
    1. Mead, R. J., Shan, N., Reiser, H. J., Marshall, F. & Shaw, P. J. Amyotrophic lateral sclerosis: a neurodegenerative disorder poised for successful therapeutic translation. Nat. Rev. Drug Discov. 22, 185–212 (2023). - PMC - PubMed
    1. Akçimen, F. et al. Amyotrophic lateral sclerosis: translating genetic discoveries into therapies. Nat. Rev. Genet.24, 642–658 (2023). - PMC - PubMed
    1. Vasta, R., Chia, R., Traynor, B. J. & Chiò, A. Unraveling the complex interplay between genes, environment, and climate in ALS. eBioMedicine75, 103795 (2022). - PMC - PubMed
    1. Mejzini, R. et al. ALS genetics, mechanisms, and therapeutics: Where are we now? Front. Neurosci. 13 (2019). - PMC - PubMed

MeSH terms

Substances

LinkOut - more resources