

Identification of CLEC10A as a human lectin for pancreatic ductal adenocarcinoma
- PMID: 40399501
- PMCID: PMC12095740
- DOI: 10.1038/s41598-025-02404-1
Identification of CLEC10A as a human lectin for pancreatic ductal adenocarcinoma
Abstract
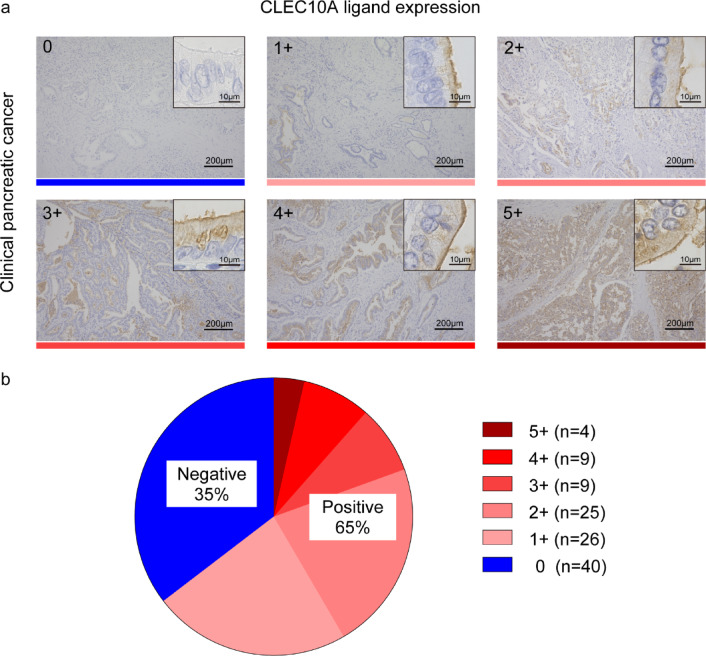
The mechanism by which glycans in pancreatic ductal adenocarcinoma (PDAC) interact with human endogenous lectins in the tumor microenvironment remains largely unknown. This study aimed to identify endogenous lectins that recognize and bind to pancreatic ductal adenocarcinomas. The reactivity of 43 human endogenous lectins belonging to the Galectin, Siglec, and C-type lectin families in PDAC cell lines and clinical PDAC samples was analyzed using flow cytometry and immunostaining of tissues. C-type lectin domain family 10 member A (CLEC10A), a C-type lectin, was a candidate endogenous lectin with high reactivity in some pancreatic cancer cells. CLEC10A lectin bound in approximately 60% of 113 clinical pancreatic cancer tissue sections. Immunohistochemistry with anti-CLEC10A antibody showed that CLEC10A was mainly expressed in CD163-positive monocytic cells. Of the 57 patients (out of 113) who achieved R0 surgical resection at stage II/III, those with high CLEC10A expression on macrophages and CLEC10A ligand expression on PDAC cells had significantly shorter overall survival. CLEC10A is a human lectin receptor for pancreatic ductal adenocarcinoma. The coexistence of CLEC10A-expressing cells in pancreatic cancer tissues and CLEC10A ligands on pancreatic cancer cells indicates poor prognosis.
Keywords: CLEC10A protein; Endogenous lectin; Pancreatic cancer; Tumor microenvironment.
© 2025. The Author(s).
Conflict of interest statement
Declarations. Competing interests: The Department of Gastrointestinal and Hepato-Biliary-Pancreatic Surgery, Faculty of Medicine, University of Tsukuba received a scholarship endowment (incentive endowment) from Mito Chuo Hospital, Moriya Daiichi General Hospital, Koyama Memorial Hospital, Tsukuba Central Hospital, Tsukuba Gastrointestinal Hospital, and Mito Saiseikai General Hospital with an annual total of 1 million yen or more. Other authors do not have any competing interests to declare. Ethics approval: The research protocol and all procedures were approved by the Institutional Review Board of the University of Tsukuba Hospital (IRB code: H28-90), Tsukuba, Japan. This study was performed in line with the principles of the Declaration of Helsinki. Consent to participate: Pancreatic cancer tissue samples were obtained from patients who provided written informed consent.
Figures


Similar articles
-
Carcinoembryonic antigen as a specific glycoprotein ligand of rBC2LCN lectin on pancreatic ductal adenocarcinoma cells.Cancer Sci. 2021 Sep;112(9):3722-3731. doi: 10.1111/cas.15023. Epub 2021 Jun 29. Cancer Sci. 2021. PMID: 34115906 Free PMC article.
-
The role of S100A9 in the interaction between pancreatic ductal adenocarcinoma cells and stromal cells.Cancer Immunol Immunother. 2022 Mar;71(3):705-718. doi: 10.1007/s00262-021-03026-y. Epub 2021 Aug 10. Cancer Immunol Immunother. 2022. PMID: 34374812 Free PMC article.
-
Sineoculis homeobox homolog 1 protein overexpression as an independent biomarker for pancreatic ductal adenocarcinoma.Exp Mol Pathol. 2014 Feb;96(1):54-60. doi: 10.1016/j.yexmp.2013.11.003. Epub 2013 Nov 18. Exp Mol Pathol. 2014. PMID: 24263054
-
Ezrin protein overexpression predicts the poor prognosis of pancreatic ductal adenocarcinomas.Exp Mol Pathol. 2015 Feb;98(1):1-6. doi: 10.1016/j.yexmp.2014.11.003. Epub 2014 Nov 5. Exp Mol Pathol. 2015. PMID: 25445504
-
The pleiotropic CLEC10A: implications for harnessing this receptor in the tumor microenvironment.Expert Opin Ther Targets. 2024 Jul;28(7):601-612. doi: 10.1080/14728222.2024.2374743. Epub 2024 Jul 3. Expert Opin Ther Targets. 2024. PMID: 38946482 Review.
References
-
- Varki, A. et al. Historical background and overview. In Essentials of Glycobiology 4th edn (eds Varki, A. et al.) (Cold Spring Harbor Lab., 2022). https://www.ncbi.nlm.nih.gov/books/NBK579927/. 10.1101/glycobiology.4e.1.
-
- Pinho, S. S. & Reis, C. A. Glycosylation in cancer: Mechanisms and clinical implications. Nat. Rev. Cancer15, 540–555 (2015). - PubMed
MeSH terms
Substances
Grants and funding
LinkOut - more resources
Full Text Sources
Medical
Research Materials
