. 2025 Jun;57(6):1493-1503.
doi: 10.1038/s41588-025-02196-0. Epub 2025 May 21.

Genomic landscape of multiple myeloma and its precursor conditions

Affiliations

Genomic landscape of multiple myeloma and its precursor conditions

Jean-Baptiste Alberge et al. Nat Genet. 2025 Jun.

Abstract

Reliable strategies to capture patients at risk of progression from precursor stages of multiple myeloma (MM) to overt disease are still missing. We assembled a comprehensive collection of MM genomic data comprising 1,030 patients (218 with precursor conditions) that we used to identify recurrent coding and non-coding candidate drivers as well as significant hotspots of structural variation. We used those drivers to define and validate a simple 'MM-like' score, which we could use to place patients' tumors on a gradual axis of progression toward active disease. Our MM precursor genomic map provides insights into the time of initiation and cell-of-origin of the disease, order of acquisition of genomic alterations and mutational processes found across the stages of transformation. Taken together, we highlight here the potential of genome sequencing to better inform risk assessment and monitoring of MM precursor conditions.


Conflict of interest statement

Competing interests: J.-B.A., A.K.D., G.G. and I.M.G. are inventors on patent applications for MinimuMM-seq and for the MM-like score. A.K.D. and E.D.L. have consulted for and received honoraria from Menarini Silicon Biosystems. G.G. receives research funds from IBM, Pharmacyclics/Abbvie, Bayer, Genentech, Calico, Ultima Genomics, Inocras, Google, Kite and Novartis, and is also an inventor on patent applications filed by the Broad Institute related to MSMuTect, MSMutSig, POLYSOLVER, SignatureAnalyzer-GPU, MSEye, MinimuMM-seq, and DLBclass. He is a founder, consultant and holds private equity in Scorpion Therapeutics; he is also a founder of and holds privately held equity in Predicta Biosciences. He was also a consultant to Merck. I.M.G. has consulted for Bristol-Myers Squibb, AstraZeneca, Amgen, Curio Science, Sanofi, Janssen, Pfizer, Menarini Silicone Biosystems, Aptitude Health, GlaxoSmithKline, AbbVie, Adaptive Biotechnologies, Window Therapeutics and Regeneron. She has received honoraria or speaker fees from Vor Biopharma, Janssen, MJH Life Sciences, Novartis, Takeda, Amgen, Regeneron, Curio Science, Standard Biotools and Physicians’ Education Resource. She is a founder and executive board member of and holds private equity in Predicta Biosciences. Her spouse is the chief medical officer of and holds private equity in Disc Medicine. R.S.P. is a founder, consultant and holds equity in Predicta Biosciences. E.Z. has received honoraria and served in advisory roles for Janssen, Bristol-Myers Squibb, Sanofi, Amgen, GlaxoSmithKline, Pfizer, Oncopeptides and Menarini–Stemline. The other authors declare no competing interests.

Figures

Fig. 1
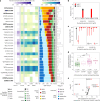
Fig. 1. The MM-like score, derived from the somatic landscape of MM, places precancer stages on a gradual axis of progression toward overt disease.
a, Waterfall plot illustrating the genomic architecture of MM and its precursors MGUS and SMM across mutation classes (SNVs, small indels, copy-number alterations, SVs and translocations) from a comprehensive collection and harmonization of tumor data (n = 1,030 patients). Samples are grouped by genetic subtypes from the International Myeloma Working Group (IMWG) classification: MAF (translocations of the MAF family of oncogenes), MMSET (translocations of the NSD2 gene), CCND (translocations of the cyclin D family of genes), hyperdiploid (trisomies of odd-numbered chromosomes) and unclassified (other genetic subtypes). Common drivers significantly enriched in MGUS/SMM are colored in green, and those significantly enriched in MM are colored in pink in the rightmost panel. The ‘MM-like’ score of a tumor is then defined as the sum of MM-like drivers minus the sum of MGUS/SMM drivers. FDR, false discovery rate; IgH/κ/λ, immunoglobulin heavy/kappa/lambda chain; n.s., not significant. b, Boxplot depicting a gradual increase in the MM-like score from MGUS (n = 37; median, 1) and SMM (n = 181; median, 2) to MM (n = 812; median, 3). c, In patients with SMM for whom IMWG classification 2/20/20 was evaluable, boxplot showing an increasing MM-like score from low-risk to high-risk categories (low, n = 54; median, 1; intermediate, n = 32; median, 2; high, n = 64; median, 3). Kruskal–Wallis test, d.f. = 2, P = 1.99 × 10−5. Two-sided Dunn’s test for post-hoc comparisons: low versus intermediate risk: statistic = −1.48, q = 0.139; intermediate versus high: statistic = −2.41, q = 0.03; high versus low: statistic = −4.61, q = 1.24 × 10−5. d,e, Kaplan–Meier curve illustrating the probability of progression of untreated SMM to MM based on the MM-like score in WGS from this study (d) (n = 63, log-rank test statistic = 5.59, d.f. = 1, P = 0.02, Wald test for MM-like score strictly above median of 1, hazard ratio (HR), 5.3; 95% CI, 1.1–25; P = 0.03) and validated in an orthogonal dataset (e) (n = 87, log-rank test statistic 21.07, d.f. = 1, P = 4 × 10−6, Wald test for M-like score > 1, HR, 3.3; 95% CI, 1.8–6.2, P = 5 × 10−5). In boxplots, the center line represents the median, the box limits represent the upper and lower quartiles and the whiskers indicate 1.5 times the interquartile range. Values exceeding whiskers appear individually as plain circles.
Fig. 2
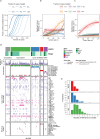
Fig. 2. The MM-like score increases with progression to cancer and can be linked with clonal outgrowth.
a, Swimmer plot showing the clinical efficacy of applying the MM-like score in a longitudinal sample setting, up to 54 months from initial biopsy. Patients characterized by either stable disease trajectory (n = 13, black symbols) or evolving genome (n = 7, red symbols) were identified, with increasing MM-like score driven by the acquisition of MM-driver mutations (KRAS, NRAS, deletion of 1p (del(1p)), hyperdiploidy (HRD)). b,c, Two examples of clinical relevance demonstrating the longitudinal impact of clinical WGS in detecting a MM-like score increase, with association with a subclonal outgrowth obtained from phylogenetic reconstruction of the disease history, and was correlated with an increase in tumor burden. The number of mutations found in each cluster is written to the right of the cluster name. MGUS monitoring over 3 years (b), with phylogenetic tree reconstruction to estimate clone driving growth and novel detection of hyperdiploidy within a bi-allelic TP53 mutant context. High-risk SMM monitoring over 2 years (c): phylogenetic analyses revealed newly acquired recurrent MM event of deletion of 1p and SP140 was identified and assigned to an emerging clone (cluster five (C5)). Concurrently, clinical M-spike levels show stable overall tumor burden. Clonal fractions from before the first WGS are kept equal to the first WGS timepoint for visual representation.
Fig. 3
Fig. 3. Precancer stages of MM have younger tumors at diagnosis, which evolve with late acquisition of MM-like features.
a, Maximum likelihood expectation and 95% CIs obtained from binomial mixture models for patients’ age at the initiation of the disease (black circles, patient age at sampling; colored circles, estimated age at the disease initiation) including MGUS (n = 14; median, 41 years old), SMM (n = 46; median, 38 years old) and MM (n = 31; median, 31 years old). b, Boxplot with point estimates and CIs for the molecular tumor age in MGUS (median, 16 years old), SMM (median, 21 years old) and MM (median, 33 years old). c, Boxplot showing that the tumor age estimated from early mutations was higher in patients with MGUS/SMM who progressed during the study versus those who remained stable (progressors: median, 30 years old; non-progressors: median, 15 years old). d, Using mutations across the genome, cell-of-origin analysis shows that the mutation profile of MM and MGUS/SMM origins correlates with germinal center, memory B cells and plasma cells. HSC, hematopoietic stem cell. Statistical significance was determined between each top hit and the subsequent models using a two-tailed corrected t-test on the values from the tenfold cross-validation, taking into account the interdependence of tests in a cross-validation setting. Panel created in part using BioRender.com. e, Bradley–Terry scores estimate (bootstrap mean and standard deviation of the log abilities) from the clonality league competition in MGUS/SMM (n = 218; green) and MM (n = 812; black). Green dots on the right represent events more likely to be subclonal in MGUS/SMM than in MM and, therefore, are acquired late in the evolution of the disease (that is, a higher Bradley–Terry score). Events +8q (MYC), −12p and −12q are significantly more clonal in the MM Bradley–Terry model than in the MGUS/SMM one, with an absolute difference in Bradley–Terry score of >1 (Supplementary Note 6). In boxplots, the center line represents the median, the box limits represent the upper and lower quartiles and the whiskers indicate 1.5 times the interquartile range. Values exceeding whiskers appear individually as plain circles.
Fig. 4
Fig. 4. The somatic landscape of MM and its precursors is shaped by physiological and cancer-like processes, which evolve after the initiation of the disease.
a, Proportion of mutational signatures for whole genomes (top row), restricted to clustered mutations only (within 1,000 bases of another; second row), which are typical of AID activity during SHM in the germinal center, and more specifically within immunoglobulin loci (third row; annotation from COSMIC reference v.3.3). The bottom row represents the proportion of mutational signatures for whole genomes using only early mutations in patients with hyperdiploidy; that is, mutations found at clonal levels on amplified chromosomes. SBS, single-base substitution; ROS, reactive oxygen species. b, Fraction of clonal mutations (median cancer cell fraction > 0.85) that are predicted to be caused by known mutational processes (clock-like signatures SBS5/40 and SBS1, AID/SHM signatures SBS9, SBS84 and SBS85, and APOBEC signatures SBS2 and SBS13) in all patients across the MM disease spectrum. Only deep WGS were used; samples from the CoMMpass study were excluded. Total of clonal mutations: clock-like, n = 14,996 out of 24,780, median, 69% per participant; AID/SHM, n = 11,415 out of 15,636, median, 71% per participant; APOBEC, n = 49,566 out of 101,922, median, 30% per participant. The center line represents the median, the box limits represent the upper and lower quartiles and the whiskers indicate 1.5 times the interquartile range. Values exceeding whiskers appear individually as plain circles. *P < 0.05, ****P < 0.0001. P values are from Dunn’s test for pairwise, two-sided comparisons and were adjusted with the Holm–Bonferroni procedure: clock-like versus AID: P = 1.15 × 10−2; clock-like versus APOBEC: P = 2.6 × 10−7; AID versus APOBEC: P = 7.75 × 10−13.
Fig. 5
Fig. 5. The neighborhood of initiating and secondary translocations of MM and its precursors is marked by AID and APOBEC activities.
a, Relative frequency of mutational signatures in whole genomes (top row), close to SV breakpoints (<10,000 base pairs; middle row) and in significant SV drivers (bottom row). The number of mutations used for each row is indicated on the right side of the colored bars. b, For each SV driver and known canonical myeloma translocations (MMSET, CCND1, WWOX/MAF, MYC), frequency of mutational signatures close to SV breakpoints (<10,000 base pairs). CCND1, IGLL5 and MYC were added to the list of SV drivers because of their known importance in MM. c, Circos plot depicting partners of MYC (chromosome 8) in MGUS/SMM, with recurrent partners (≥3 patients) shown in pink. d, Fraction of patients with deep WGS performed and a MYC translocation detected (immunoglobulin or non-immunoglobulin) across disease stages. Error bars represent binomial proportion 95% CIs for the following counts: MGUS: n = 1 out of 37; SMM: n = 8 out of 120; MM: n = 151 out of 812; bar height represents the frequency itself.
Fig. 6
Fig. 6. Non-coding mutation hotspots across MM stages reflect the history of the disease and candidate driver genes.
a, Filtered heatmap representing significantly hypermutated non-coding genes and regulatory elements detected with the DIG algorithm on MGUS, SMM and MM participants with deep WGS (overall, n = 177) and molecular subgroup in yellow-green-blue shades (CCND, n = 50; HRD, n = 68; MAF, n = 33; MMSET, n = 13; unclassified, n = 13). Left panel, fraction of normal B cell expansions with mutations in the same elements (naive B cells, n = 85 samples; memory B cells, n = 74 samples; data from Machado et al.). Middle-right panel, mutational signature weights in each element. Right panel, q-score for each element hypermutation in MGUS, SMM and MM. Bold represents non-coding elements associated with known drivers of myeloma; asterisks indicate non-coding elements that are hypermutated in normal B cells. b, For the ILF2 promoter element, genomic coordinates, counts and tumor alleles found using deep WGS in this study (n = 12 mutations from nine participants: MGUS, n = 2; SMM, n = 6; MM, n = 1). c, Cancer cell fraction point estimates (maximum likelihood) and 95% CIs from ABSOLUTE for each mutant allele with deep WGS of this study (n = 12, median, 99%; range, 23–99%). d, ILF2 gene expression levels are grouped by status of the ILF2 promoter mutation and of gain of 1q from the CoMMpass study (n = 589 covered at the ILF2 promoter hotspots). Gene expression levels are given after variance-stabilizing transformation (DESeq2 (ref. ); arbitrary gene expression units). ILF2 promoter wild-type (ILF2 WT): n = 330, median, 12.3; ILF2 promoter mutant (ILF2 MUT): n = 12, median, 12.5; ILF2 WT and gain of 1q: n = 238, median, 12.9; ILF2 MUT and gain of 1q: n = 9, median, 13.2. The center line represents the median, the box limits represent the upper and lower quartiles and the whiskers indicate 1.5 times the interquartile range. Values exceeding whiskers appear individually as plain circles. e, Volcano plot showing the increased expression levels of genes within the topologically associated domain surrounding ILF2 in patients from the CoMMpass study with an ILF2 promoter mutation versus wild-type (P value from the lm function in R; genes represented in red are statistically significant with q < 0.1, where q is the P value adjusted for false discovery rate).
Extended Data Fig. 1
Extended Data Fig. 1. Sensitivity, saturation analysis for driver discovery and distribution of drivers across MM stages.
a) Binomial power analysis showing sensitivity to detect candidate point mutation drivers according to the number of independent tumors-normal (TN) pairs sequenced (50 to 5,000) for diverse ranges of mutation frequencies ( > 1%, >2%, >3%, >4%, >5%, >10%), and following the procedure in Lawrence et al.. Dashed line represents the 90% detection power. b) Number of candidate point mutations drivers found by MutSig2CV analysis across different frequencies of mutation (each color represents a frequency range for a driver to be mutated in the population as indicated on the graph legend). Each dot represents a random sampling of N participants of the full cohort from N = 10 to 1,030. Saturation curves are modeled by logistic regression. c) Saturation analysis for candidate driver discovery based on focal copy-number abnormalities by the GISTIC2 algorithm with axes and modeling similar to panel B. d) Copy-number and structural variants in patients without MM-driver point mutation detected (N = 209; MGUS: 21, SMM: 83, MM: 105). Two participants (MMRF_2153 and SMM_102_Tumor) had driver copy-number detected below the cutoff used in this study (MMRF_2153: del(13q, 13%), SMM_102_Tumor: del(16q), 10%, compared with 14% or 0.1 units of log2ratio). e) Distribution of the number of MM drivers found mutated per disease stage and medians 0, 1, 2 for MGUS, SMM, and MM, respectively. Total number of patients: MGUS: 37; SMM: 181; MM: 812.
Extended Data Fig. 2
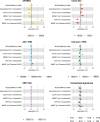
Extended Data Fig. 2. Clinical significance of the MM-like score and time to progression from SMM to MM.
a) Kaplan-Meier curves from progression-free survival in SMM from an external validation cohort (N = 77; ref. ) with deep target sequencing panels (copy number abnormalities excluded, HR = 1.8, CI95% = [1.1-3.0], P = 0.03). b) Hazard ratios and 95% confidence intervals for a Cox regression to model time to progression with MM-like score > 1 and 2/20/20 risk system stratified by study of origin (n = 225). c-e) Hazard ratios and 95% confidence intervals from the Cox proportional hazard models for progression to MM with MM-like score ( > 1 versus ≤1) and 2/20/20 clinical risk stratification (reference: low) as predictors, for this study (c), Bustoros et al. (ref. ) (d), and Boyle et al. (ref. , minus two patients without 2/20/20 risk available) (e). In panels c to e, the central point and error bars represent the Hazard ratio and its 95% confidence interval from the model described. Significance levels *: P < 0.05; **: P < 0.01; ***: P < 0.001; ****: P < 0.0001.
Extended Data Fig. 3
Extended Data Fig. 3. Molecular clocks that estimate the tumor age of MGUS and SMM in hyperdiploidy patients.
a) Number of SNVs used in clonally amplified odd chromosomes among 3, 5, 7, 9, 11, 15, 19, 21 to estimate the molecular age of the tumors (minimum: 10, mean: 283, 75% have more than 283). b) Maximum likelihood estimates and 95% confidence intervals obtained from a binomial mixture model, using mutations found on amplified chromosomes from patients with hyperdiploidy, grouped by disease stage. Darker colors represent participants who later progressed to MM (see Methods). Estimates were obtained with a binomial mixture model. MGUS (n = 14, median: 16 years old), SMM (n = 46, median: 21 years old), and MM (n = 31, median: 33 years old). c) Logistic regression for progression to MM with molecular tumor age (hyperdiploid clone age) and 2/20/20 risk classification as dependent variables in SMM patients with risk classification available (n = 39; 2/20/20 risk categories: low, n = 10, intermediate, n = 13, high, n = 16). Estimates and 95% confidence intervals were obtained from the “lm” function in R v4.4.1 with default parameters.
Extended Data Fig. 4
Extended Data Fig. 4. Cell-of-origin analysis for the development of MGUS and SMM.
a) Coefficients of determination obtained from 10-fold cross validation between N = 11,677 early mutations found clonal and duplicated on amplified chromosomes from hyperdiploidy patients and B cell type epigenetic tracks from IHEC and ENCODE consortia. b) Cell-of-origin analysis repeated as described for panel A, within each of the CCND, MMSET, MAF, HRD subgroups. c) Cell-of-origin analysis repeated as described for panel A for Non-Hodgkin’s Lymphoma (n = 993,324 mutations) and Chronic Lymphocytic Leukemia (n = 172,791 mutations) from the ICGC consortium deep WGS. Bars represent the mean value obtained from 10-fold cross-validation (9 degrees of freedom), statistical significance was determined between each top hit and the subsequent models using a two-tailed corrected t-test on the values.
Extended Data Fig. 5
Extended Data Fig. 5. Correlation between the frequency and the clonality of copy-number abnormalities used in the Bradley-Terry models (Clonality League Comparison).
a) Overall frequency of events in the MGUS/SMM league (dark grey) versus MM league (light grey). An event is considered positive with at least a 0.1 difference in the log2 copy number space after purity adjustment. b) Difference of the timing of events estimated with the Bradley-Terry model (Bradley-Terry estimates; average MM minus average MGUS/SMM), in absolute values (towards left: early MM, late MGUS; towards right: early MGUS, late MM). c) Comparison of Bradley-Terry estimates and 95% confidence intervals obtained with bootstrapping (n = 20) across MM (empty circles) and MGUS/SMM (filled circles) leagues. Error bars represent the mean and 95% confidence interval. Events on the left are predicted to happen late in the MGUS/SMM history but early in MM (absolute difference > 1 and q < 0.05).
Extended Data Fig. 6
Extended Data Fig. 6. Predictors of mutational signatures weights based on MGUS/SMM versus MM comparison and adjusted for molecular class, and WGS technique.
In each panel, beta estimates and associated 95% confidence intervals for the predictor in a linear regression (SBS ~ Disease Stage + Molecular Class + WGS protocol). Mutational signatures are grouped by known or shared etiology from COSMIC catalogue v3.3. MMRF: shallow genomes from the MMRF CoMMpass database downloaded from the NCI Genomics Data Commons website. Empty dots represent associations below significance levels (q < 0.05). Central estimates and 95% confidence intervals were obtained from the “lm” function in R v4.4.1 with default parameters.
Extended Data Fig. 7
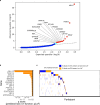
Extended Data Fig. 7. List of significant SV drivers with predicted loss-of-function.
a) Q-Q plot for SV driver discovery validating the absence of p value inflation for this statistical method SVelfie (red: significant hits q < 0.1, cyan: potentially additional hits q < 0.25). b) List of significant SV drivers before merging close neighbors (TRAF3/AMN, SP140/SP140L/SP100, PRSS2/MTRNR2L6), with matching q value from binomial test (See Methods). c) Detailed CoMut plot of predicted loss-of-function hits in candidate SV drivers for each patient (blue: loss-of-function; orange: not loss-of-function).
Extended Data Fig. 8
Extended Data Fig. 8. CTCF and H3K27Ac chromatin immunoprecipitation sequencing (ChIP-seq) tracks from the ENCODE Project around ILF2 promoter region.
Data (bigwig and BED narrow Peak files) were obtained from the encodeproject.org website, after searching for hg38 tracks for CTCF and H3K27Ac ChIP-seqs. CTCF ChIP-seq tracks are in black, while H3K27Ac are in green. ILF2 mutation hotspot is depicted with the red line (hg38: chr1:153,671,247 and chr1:153,671,254). ILF2 promoter region from the PCAWG dataset is depicted with the pink rectangle (hg38: chr1:153,670,032-153,671,248). Significant peaks are indicated with the colored segments below the signal tracks. ENCODE experiments numbers: GM12878: CTCF:ENCSR000DZN, H3K27Ac: ENCSR000AKC. NCI-H929: CTCF: ENCSR634OAQ, H3K27Ac: ENCSR368CYW. MM.1S: CTCF: ENCSR402IDP, H3K27Ac: ENCSR758OEC. KMS-11: CTCF: ENCSR430YRJ, H3K27Ac: ENCSR955IXZ.
Extended Data Fig. 9
Extended Data Fig. 9. Gene expression in the vicinity of the ILF2 promoter increases within the topologically associated domain (TAD) of the GM12878 cell line and in the CoMMpass study.
a) TAD boundaries and local contact-map of the GM12878 from Rao et al. 2014 (image obtained on the http://3dgenome.fsm.northwestern.edu/ website). b) Positive correlation between gene expression of ILF2 and of its neighbor genes from the linear regression of dependent variable Gene expression (VST normalized with DESeq2) with predictor variables ILF2 promoter status and gain of chromosome 1q status (multivariable linear regression). Data were obtained from the CoMMpass database with ILF2 covered ( ≥ 2 reads; See Methods). Vertical axis reflects significance levels, similar to a Manhattan plot, while the color of the dots reflects the estimate itself (red: positive correlation, blue: negative correlation).

References

    1. Kyle, R. A. et al. Prevalence of monoclonal gammopathy of undetermined significance. N. Engl. J. Med.354, 1362–1369 (2006). - PubMed
    1. Kyle, R. A. et al. Clinical course and prognosis of smoldering (asymptomatic) multiple myeloma. N. Engl. J. Med.356, 2582–2590 (2007). - PubMed
    1. Kyle, R. A. et al. Long-term follow-up of monoclonal gammopathy of undetermined significance. N. Engl. J. Med.378, 241–249 (2018). - PMC - PubMed
    1. Lakshman, A. et al. Risk stratification of smoldering multiple myeloma incorporating revised IMWG diagnostic criteria. Blood Cancer J.8, 59 (2018). - PMC - PubMed
    1. Mateos, M.-V. et al. International Myeloma Working Group risk stratification model for smoldering multiple myeloma (SMM). Blood Cancer J.10, 102 (2020). - PMC - PubMed

LinkOut - more resources