. 2025 Jun;26(6):934-946.
doi: 10.1038/s41590-025-02155-1. Epub 2025 May 21.

Bat organoids reveal antiviral responses at epithelial surfaces

Affiliations

Bat organoids reveal antiviral responses at epithelial surfaces

Max J Kellner et al. Nat Immunol. 2025 Jun.

Abstract

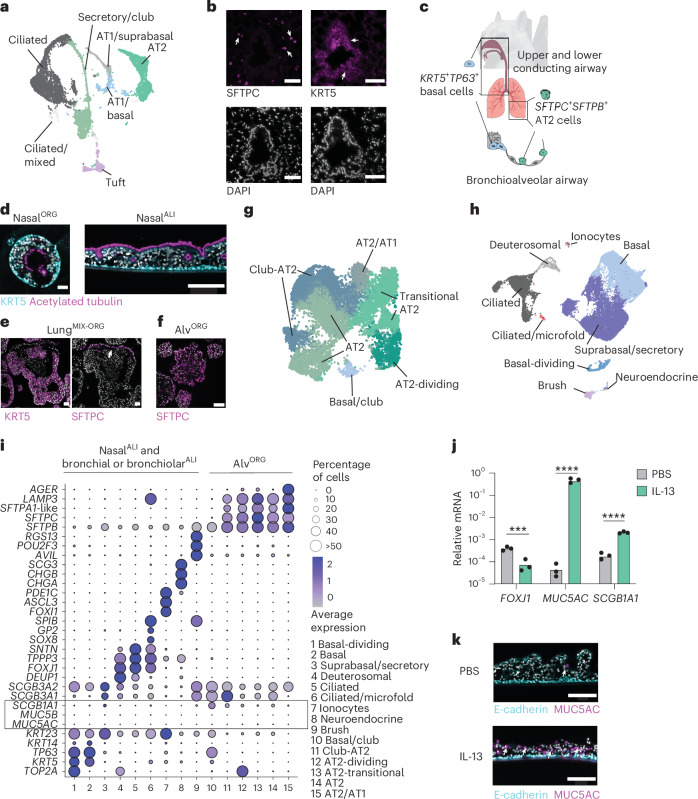
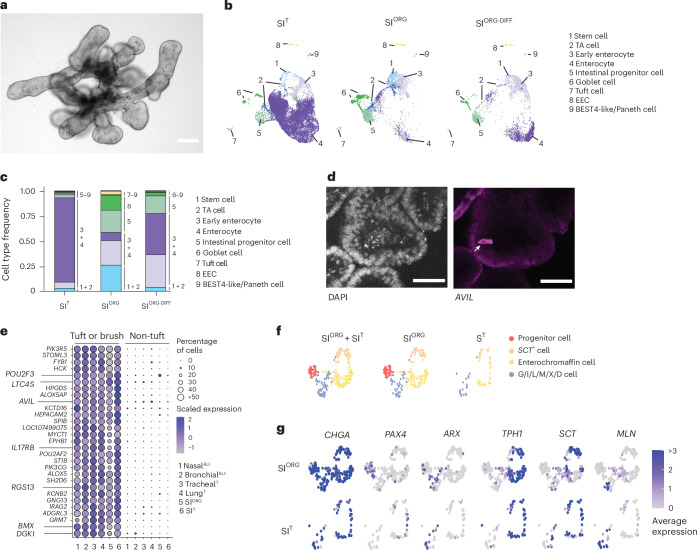
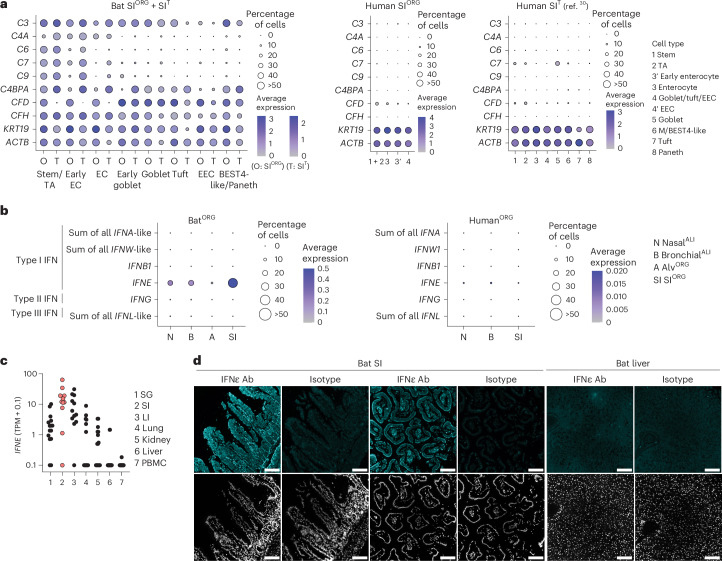
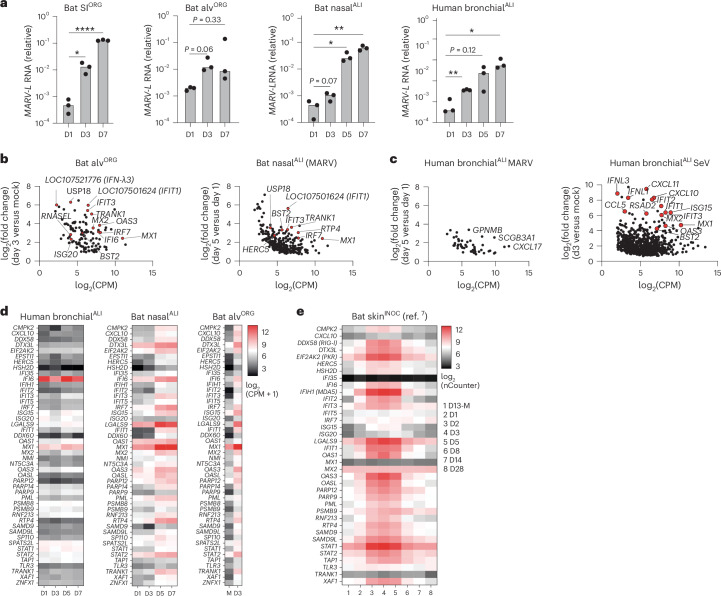
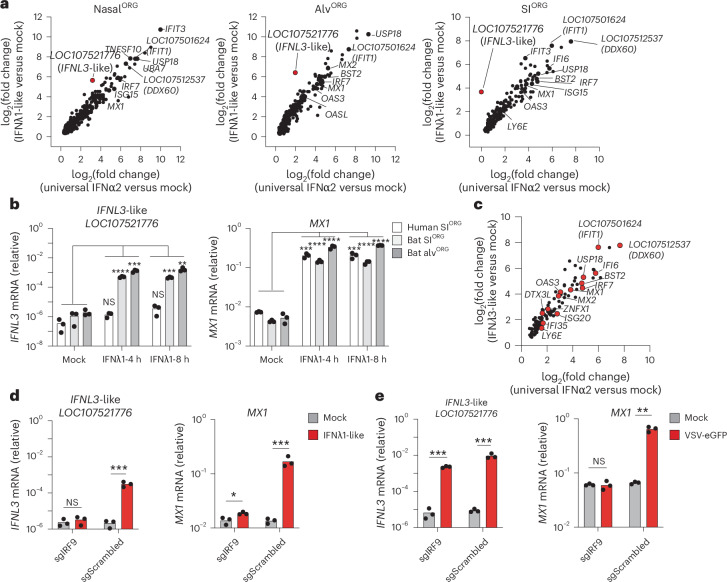
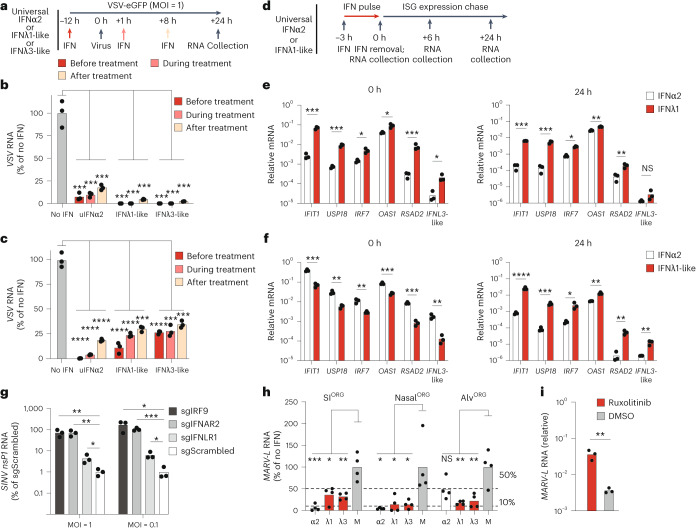
Bats can host viruses of pandemic concern without developing disease. The mechanisms underlying their exceptional resilience to viral infections are largely unresolved, necessitating the development of physiologically relevant and genetically tractable research models. Here, we developed respiratory and intestinal organoids that recapitulated the cellular diversity of the in vivo epithelium present in Rousettus aegyptiacus, the natural reservoir for the highly pathogenic Marburg virus (MARV). In contrast to human counterparts, bat organoids and mucosal tissue exhibited elevated constitutive expression of innate immune effectors, including type I interferon-ε (IFNε) and IFN-stimulated genes (ISGs). Upon infection with diverse zoonotic viruses, including MARV, bat organoids strongly induced type I and III IFN responses, which conferred robust antiviral protection. Type III IFNλ3 additionally displayed virus-independent self-amplification, acting as an ISG to enhance antiviral immunity. Our organoid platform reveals key features of bat epithelial antiviral immunity that may inform therapeutic strategies for viral disease resilience.


Conflict of interest statement

Competing interests: The authors declare no competing interests.

Figures

Fig. 1
Fig. 1. R. aegyptiacus nasal, bronchial and alveolar airway organoids contain diverse cell types.
a, Uniform manifold approximation and projection (UMAP) of EC types of lung and tracheal tissue, identified using scRNA-seq from a captive-bred R. aegyptiacus. Clusters labeled with ‘/’ indicate mixed identities: AT1/basal (AT1 lung or basal cells from the lung or trachea); AT1/suprabasal (AT1 lung or suprabasal trachea); secretory/club (goblet or club cells); ciliated/mixed (cells with ambiguous identity expressing a ciliated marker). b, Representative KRT5 or SFTPC immunofluorescence staining (top) and 4′,6-diamidino-2-phenylindole (DAPI) nucleus counterstaining (bottom) in R. aegyptiacus lung sections (n = 3). Arrowheads indicate KRT5+ basal or SFTPC+ AT2 cells. Scale bars, 50 µm. c, Schematic of the main adult respiratory epithelial stem cell types: KRT5+TP63+ basal cells in the upper and lower conducting airways and SFTPC+SFTPB+ AT2 cells in the alveolar epithelium. d, Representative KRT5 and acetylated tubulin immunofluorescence staining in differentiated nasalORG (left) and nasalALI (right) cultures derived from R. aegyptiacus. Scale bars, 50 µm (left) or 150 µm (right). e, Representative KRT5 (left) or SFTPC (right) immunofluorescence staining in lungMIX-ORG derived from R. aegyptiacus and grown in complete alveolar medium (Methods). The arrowhead highlights SFTPC+ cells. Scale bars, 50 µm. f, Representative SFTPC immunofluorescence staining in alvORG derived from R. aegyptiacus. Scale bar, 100 µm. g, UMAP of the R. aegyptiacus-derived alvORG scRNA-seq dataset showing the cell-type clusters. h, UMAP of the integrated R. aegyptiacus-derived nasalALI and bronchialALI scRNA-seq dataset showing the cell-type clusters. i, Seurat DotPlot showing the average expression of the markers for each cell cluster in a merged dataset of R. aegyptiacus-derived nasalALI + bronchialALI and alvORG. The dot size represents the percentage of a cell type expressing a given marker. Color intensity represents the average expression value. Dot size was set to a maximum percentage of 50%. (Genes expressed by more than 50% of cells have the same dot size.) The box highlights the low-to-absent expression of the club and goblet cell markers MUC5AC and MUC5B. j, RT–qPCR analysis of FOXJ1, MUC5AC or SCGB1A1 expression (n = 3 each; normalized to EEF1A1, 2ΔCt) in R. aegyptiacus-derived nasalALI treated with 10 ng ml−1 recombinant human IL-13 or PBS from days 10 to 25 of the ALI culture. k, Representative immunofluorescence staining of MUC5AC and E-cadherin in sections from R. aegyptiacus-derived nasalALI treated with IL-13 or PBS as in i. Scale bars, 150 µm. Representative images in df,k were derived from n = 3. DAPI was used as a nuclear counterstain in immunofluorescence imaging.
Fig. 2
Fig. 2. Microfold cells endogenously arise in bat bronchial organoid-derived ALI cultures.
a, UMAP of the integrated R. aegyptiacus-derived nasalALI and bronchialALI scRNA-seq dataset showing the ciliated, and mixed ciliated and microfold, cell clusters. b, Seurat VlnPlot analysis of the microfold cell markers SOX8, SPIB, GP2, TNFAPI2, TNFRSF11A, CCL20, TNFAPI2 and AIF1, and the ciliated cell marker FOXJ1 in ciliated cell, mixed ciliated and microfold cells, and GP2+ microfold cells of R. aegyptiacus-derived bronchialALI. The expression distribution was derived from individual cells. c, Seurat DotPlot showing the average expression of receptor–ligand pair markers for the RANK–RANKL signaling axis (TNFSF11, TNFRSF11A and TNFRSF11B) for clusters 1–10 in the R. aegyptiacus-derived bronchialALI scRNA-seq dataset. The dot size represents the percentage of an individual cell type expressing a given marker. Color intensity represents the average expression value. Dot size was set to a maximum percentage of 50%. (Genes expressed by more than 50% of cells have the same dot size.)
Fig. 3
Fig. 3. R. aegyptiacus SI organoids recapitulate the cellular diversity of the native bat intestinal epithelium.
a, Representative bright-field image of R. aegyptiacus-derived SIORG (n = 3). b, UMAP of the integrated R. aegyptiacus-derived SIT, SIORG and differentiated SIORG-DIFF showing the individual cell types. c, Stacked bar plot showing the relative cell-type proportions of cell types in R. aegyptiacus-derived SIT, SIORG and differentiated SIORG-DIFF. d, Immunofluoresence of DAPI nucleus counterstaining (left) and AVIL antibody staining (right) in SIORG from R. aegyptiacus. The arrow points to an individual AVIL+ tuft cell. e, Seurat DotPlot showing the scaled average expression of markers enriched in tuft and brush cells for tuft/brush, and non-tuft/brush, ECs in the R. aegyptiacus-derived nasalALI, bronchialALI, trachealT, lungT, SIORG and SIT scRNA-seq dataset. The dot size represents the percentage of an individual cell type expressing a given marker. Color intensity represents the average expression value. Dot size was set to a maximum percentage of 50%. (Genes expressed by more than 50% of cells have the same dot size.) f, UMAP of EEC subtypes from the integrated R. aegyptiacus SIT + SIORG (left), SIORG (middle) or SIT (right). Cells with an EEC sublineage are color-coded. g, Seurat FeaturePlot showing the average expression of EEC (CHGA) and EEC sublineage marker genes in individual cells of SIORG (top) or SIT (bottom). ARX, differentiated G/I/L/M/X/D EECs; TPH1, enterochromaffin cells; MLN, M cells; PAX4, EEC progenitor cells; SCT, SCT+ S-like cells. The maximum color cutoff for the average expression was set to 3. Cells with an average expression of 3 or greater for a given marker have the same color. Scale bars, 50 µm.
Fig. 4
Fig. 4. Bat organoids show heightened expression of innate immune genes, including complement system genes, IFNε and ISGs in comparison to human organoids.
a, Seurat DotPlot showing the average expression of genes associated with the complement system and β-actin (ACTB) in cell types in the R. aegyptiacus (bat) SIORG (O) or SIT (T) scRNA-seq dataset (left), human SIORG (middle) or from a published human SIT scRNA-seq dataset. The dot size represents the percentage of an individual cell type expressing a given marker. Color intensity represents the average expression value. Dot size was set to a maximum percentage of 50%. (Genes expressed by more than 50% of cells have the same dot size.) b, Seurat DotPlot showing the average expression of type I IFNα (sum of all annotated IFNA-like genes), IFNω (sum of all annotated IFNW-like genes), IFNβ (IFNB1), IFNε (IFNE), type II IFNγ (IFNG) and type III IFNλ (sum of all annotated IFNL-like genes) in the R. aegyptiacus (left) and human (right) nasalALI (N), bronchialALI (B), alvORG (A) or SIORG (SI) scRNA-seq dataset. Dot size represents the percentage of an individual cell type expressing a given marker. Color intensity represents the average expression value. Dot size was set to a maximum percentage of 50%. c, IFNE mRNA expression (in transcripts per million (TPM) + 0.1, pseudocount) in published bulk RNA data of R. aegyptiacus salivary gland (SG), SI, large intestine (LI), lung, kidney, liver and PBMCs. Each dot represents an individual bat (n = 11–17). Samples from the SI are highlighted in red. d, Representative immunofluorescence of IFNε or isotype control staining (top) and DAPI nucleus counterstaining (bottom) in R. aegyptiacus SI or liver sections (n = 3). Scale bars, 100 µm.
Fig. 5
Fig. 5. MARV infection in bat organoids triggers an IFN response.
a, RT–qPCR analysis of intracellular MARV-L expression (normalized to EEF1A1, 2-ΔCt) in bat SIORG(n = 3), alvORG(n = 3), nasalALI (n = 3) or human bronchialALI (n = 3) infected with MARV (Musoke strain) at an estimated multiplicity of infection (MOI) of 0.5–1 (50,000 plaque forming units (PFU) for bat SIORG and alvORG; 100,000 PFU for bat nasalALI or human bronchialALI) from day 1 to day 7 (D1–D7) after infection. A two-sided Student’s t-test was used to compare the average intracellular MARV-L mRNA level at each time point to the first analyzed time point (D1) for each condition. P > 0.05, no significant difference, *P < 0.05, **P < 0.01,, ****P < 0.0001. b, EdgeR differential gene expression analysis of bat alvORG (n = 3) infected with MARV for 72 h compared to mock-infected (left) or bat nasalALI (n = 3) at day 5 after infection compared to day 1 after infection with MARV (right). Each dot represents the expression (in log2-transformed counts per million (CPM)) and log2-transformed fold change of a differentially expressed gene (DEG) between two comparisons. Selected ISGs are highlighted in red and labeled. c, Human bronchialALI (n = 3) at day 5 after infection compared to day 1 after infection with MARV (left) or 72 h after infection with SeV compared to mock infection (right). Each dot represents the expression (in log2(CPM)) and log2(fold change) of a DEG between two comparisons. Selected genes are labeled and highlighted in red for ISGs. d, Heatmap showing normalized gene expression (log2(CPM + 1)) from bulk RNA-seq for ISGs in human bronchialALI (left), bat nasalALI (middle) or bat alvORG (right) from day 1 to day 7 (D1–D7) after infection with MARV or day 3 in mock infection (M). Each mRNA value represents the average of three biological replicates. e, Heatmap displaying log2-normalized gene expression of ISGs from reanalyzed public nCounter NanoString data of skin samples (inoculation site) from R. aegyptiacus (bat skinINOC, n = 4–6) from day 1 to day 28 (D1–D28) after infection with MARV or day 13 in mock infection (D13-M). Each mRNA value represents the average of 4–6 bats in the published dataset.
Fig. 6
Fig. 6. Type III IFNs are predominantly induced in bat organoids upon zoonotic virus infection.
a, RT–qPCR analysis of type I IFNB1, type III IFNL1-like (LOC107521777), IFNL3-like (LOC107521776), IFIT1 (LOC107501624) and CCL5 (normalized to EEF1A1, 2-ΔCt) in virus-infected (SeV, H1N1, VSV-eGFP or MERS-CoV), poly(I:C)-transfected or mock-treated bat nasalORG, SIORG or alvORG. Each mRNA value represents the average of three biological replicates. SeV (S), H1N1 (I) and VSV (V) infections were performed at an MOI of 0.5 for 16 h; poly(I:C) (R) was transfected at 1 µg ml−1 for 16 h and MERS-CoV infections were conducted for 24 (C1), 48 (C2) or 72 h (C3) or mock (MC). b, Heatmap showing normalized gene expression (log2(CPM + 1)) from bulk RNA-seq in SeV-infected bat SIORG (left), SeV-infected bat alvORG (middle) or MERS-CoV-infected bat alvORG (right) for IFNA-like (sum of all IFNA-like genes), IFNW-like (sum of all IFNW-like genes), IFNK, IFNB1, IFNG, IFNL-like (sum of all IFNL-like genes) (top) and ISGs or the epithelial marker EPCAM (bottom) at D1–D3 after infection. Each mRNA value represents the average of three biological replicates. The single asterisk indicates IFN or ISGs expressed in at least two of three biological replicates. c, Normalized gene expression (CPM + 1) from bulk RNA-seq for IFNE and the ISGs IRF7, MX2 or RTP4 in SeV-infected or mock-infected bat SIORG (n = 3) or bat alvORG (n = 3). Biological replicates are represented by the dots, with the bar height indicating the average expression. A two-sided Student’s t-test was used to compare the average mRNA expression levels of each gene in SeV-infected organoids versus uninfected organoids at day 3 after infection. NS, not significant; ***P < 0.001, ****P < 0.0001.
Fig. 7
Fig. 7. Bat type III IFNλ drive self-amplified antiviral responses in bat organoids.
a, Scatter plots showing the log2-transformed fold changes in gene expression from bulk RNA-seq comparing nasalORG (left), alvORG (middle) or SIORG (right) treated with universal IFNα2 (x axis) or IFNλ1-like (y axis) to mock-treated controls after 8 h. Individual ISGs are highlighted. IFNL3-like (LOC107521776) is highlighted in red. b, RT–qPCR analysis of IFNL3-like (LOC107521776) in bat SIORG or alvORG; IFNL3 in human SIORG) normalized to EEF1A1 (2−ΔCt) after treatment with bat IFNλ1-like (bat organoids) or human IFNλ1 (human SIORG) for 4 and 8 h. A two-sided Student’s t-test was used to compare IFNL3-like mRNA levels at 4 or 8 h after treatment to mock-treated controls. c, Scatter plot showing the log2-transformed fold changes in gene expression from bulk RNA-seq comparing SIORG treated with universal IFNα2 (x axis) or IFNλ3-like (derived from LOC107521776) (y axis) to mock-treated controls after 8 h. Individual ISGs are highlighted in red. d, RT–qPCR analysis of IFNL3-like (LOC107521776) or MX1 (normalized to EEF1A1, 2ΔCt) in bat SIORG engineered with Cas9 and IRF9 targeting (sgIRF9) or control (sgScrambled) RNA, treated with or without bat IFNλ1-like for 8 h. A two-sided Student’s t-test was used to compare IFNL3-like mRNA levels between sgIRF9 and sgScrambled SIORG at 8 h after treatment. e, As in d but comparing sgIRF9 and sgScrambled SIORG after infection with VSV-eGFP at an MOI of 0.05 for 72 h. *P < 0.05, **P < 0.01, ***P < 0.001, ****P < 0.0001.
Fig. 8
Fig. 8. Type I and type III IFNs protect bat organoids from zoonotic virus infection.
a, Experimental workflow showing the administration of universal IFNα2, IFNλ1-like or IFNλ3-like 12 h before, during or 8 h after treatment with VSV infection of bat nasalORG or SIORG. Intracellular VSV viral RNA was measured 24 h after infection. b,c, RT–qPCR analysis of intracellular VSV-NP viral RNA in bat SIORG (n = 3) (b) or nasalORG (n = 3) (c), normalized to EEF1A1 (2−ΔCt) and expressed as a percentage relative to no IFN control. A two-sided Student’s t-test was used to compare VSV viral RNA levels across before, during and after treatment, and no IFN conditions, comparing each IFN treatment to no IFN control. d, Experimental workflow showing bat nasalORG or SIORG treated with universal IFNα2 or bat IFNλ1-like for 3 h, followed by washout and incubation in IFN-free medium for 24 h and RNA collection at 0, 3 and 24 h after IFN washout. e,f, RT–qPCR analysis of ISGs (normalized to EEF1A1) in bat SIORG (n = 3) (e) or nasalORG (n = 3) (f) treated with universal IFNα2 or bat IFNλ1-like at 3 h (left) or 24 h (right) after IFN removal. A two-sided Student’s t-test was used to compare ISG mRNA levels between treatments. g, RT–qPCR analysis of intracellular SINV-eGFPnsP2-P726G nsP1 RNA (normalized to EEF1A1 (2−ΔCt) and expressed as fold change relative to the mean of the sgScrambled control) in bat SIORG engineered with Cas9 and targeted guide RNA (sgIRF9, sgIFNAR2, sgIFNLR1) or control (sgScrambled), infected with SINV-eGFPnsP2-P726G. A two-sided Student’s t-test was used to compare SINV nsP1 viral RNA levels between treatment groups. nsP1, nonstructural protein 1. h, RT–qPCR analysis of intracellular MARV-L viral RNA (normalized to EEF1A1) in bat SIORG, nasalORG or alvORG (n = 4) treated with or without IFNs during a 3-day MARV infection. A two-sided Student’s t-test was used to compare MARV viral RNA levels between IFN-treated and untreated controls. i, RT–qPCR analysis of MARV-L viral RNA in bat alvORG treated with or without 5 µM ruxolitinib during a 3-day infection. A two-sided Student’s t-test was used to compare MARV viral RNA levels between ruxolitinib and dimethylsulfoxide (DMSO) mock-treated alvORG and MARV-infected alvORG. *P < 0.05, **P < 0.01, ***P < 0.001, ****P < 0.0001.
Extended Data Fig. 1
Extended Data Fig. 1. Establishment and characterization of R. aegyptiacus airway organoids.
a, UMAP of R. aegyptiacus airway cell types resolved by scRNA-seq of lung and trachea tissue from a captive-bred bat. Immune, stromal, and epithelial cell lineages are labeled and color-coded. EC, Endothelial cells, LC, Lymphatic cells, DC, Dendritic cells. b, Seurat DotPlot showing scaled average expression of marker genes for cell clusters in (a), grouped by major tissue-resident lineages. Dot sizes were set to a maximum percentage of 50% (genes expressed by more than 50% of cells have the same dot size). Color intensity represents expression level. c, Seurat DotPlot showing marker expression across epithelial cell types. Dot sizes were set to a maximum percentage of 50%. d, Heatmap showing RT-qPCR analysis of KRT5, SCGB1A1, SFTPC, or SFTPB in mixed lung progenitor organoids (LungMIX-ORG) cultured with indicated factors. Expression normalized to EEF1A1 and shown as % of maximum. Each value represents the average relative expression (n = 3). e, Representative immunofluorescence of KRT5 in bat nasalORG grown in basal cell organoid medium (EGF, FGF10, Rspondin1, Noggin) (n = 3). Composite image with DAPI nuclei counter stain. Scale, 50 µm. f, Representative brightfield images of nasalORG, tracheaORG, or bronchialORG at day four following single-cell passage (n = 3). Scale, 100 µm. g, Representative brightfield (left) and fluorescence image (right) of bat lungMIX-ORG grown in complete alveolar medium (-Noggin) stained with LysoTracker-Red for 2 hours (n = 3 each). Scale, 100 µm. h, Mean Fluorescence Intensity (MFI) of LysoTracker Red staining in mixed lungMIX-ORG (n = 3) cultured with indicated factors. Dots, image intensity per single organoid analyzed in Fiji. Two-sided unpaired Mann-Whitney tests were performed to compare MFI distribution of lungMIX-ORG cultured in different media (**** P < 0.0001). i, Schematic showing alvORG derivation from LysoTracker Red+ AT2 FACS-sorted cells from lungMIX-ORG. j, FACS plots showing LysoTracker Red intensity in single gated cells from nasalORG or lungMIX-ORG cultured in complete alveolar medium. Percentages of LysoTracker+ cells are shown. k, Representative brightfield image of bat alvORG established from FACS-sorted AT2 cells. Scale, 100 µm.
Extended Data Fig. 2
Extended Data Fig. 2. Single-cell RNA sequencing of bat and human airway organoids.
a, UMAP of alvORG cell types resolved by scRNA-seq, colored by bat donor (n = 3). b, UMAP of bat nasalALI and bronchialALI cell types by sample group (left, nasalALI or bronchialALI) or donor (right, n = 3). c, Seurat VlnPlots showing IRX2 (top) and SIX3 (bottom) expression in bat nasalALI, bronchialALI, or alvORG. Wilcoxon Rank Sum Test used (**** P < 0.0001). d, Seurat DotPlot showing marker expression in alvORG clusters. Dot sizes were set to a maximum percentage of 50% (genes expressed by more than 50% of cells have the same dot size). Dot color intensity represents scaled expression level. e, Same as (d) for bat nasalALI and bronchialALI. f, Seurat VlnPlot showing KNIIFE-cell markers in KRT13+ vs. KRT13 cells in the NasalALI scRNA-seq dataset. g, UMAP of human nasalALI (top) or bronchialALI (bottom) airway cell types resolved by scRNA-seq. Cell types are labeled and color-coded. h, Seurat DotPlot marker gene expression human nasalALI (left) or bronchialALI (right). Dot sizes were set to a maximum percentage of 50%. Dot color intensity represents scaled expression level. i, Bar plots showing the percentages of rare cell types relative to all cells in the bat nasalALI (top) or bronchialALI (bottom) scRNA-seq dataset.
Extended Data Fig. 3
Extended Data Fig. 3. Single-cell RNA sequencing of R. aegypticus SIT and SIORG.
a, UMAP of R. aegyptiacus single cell transcriptomes resolved by scRNA-seq of whole SI tissue from a captive-bred bat. Immune, stromal, and epithelial cell lineages are labeled and color-coded. b, UMAP of R. aegyptiacus SIT cell types in the scRNA-seq dataset. Individual cell types are color-coded and epithelial cell types (hereafter designated as SIT) are additionally highlighted by text labels. c, Seurat DotPlot showing scaled average expression of marker genes for cell clusters in R. aegyptiacus whole SI tissue scRNA-seq dataset. Dot sizes were set to a maximum percentage of 50% (genes expressed by more than 50% of cells have the same dot size). Dot color intensity represents scaled expression. d, Seurat DotPlot showing the scaled average expression of marker genes for cell clusters in the integrated scRNA-seq data of R. aegyptiacus SIT epithelial cells (left) and SIORG (middle) or differentiated SIORG (SIORG-DIFF) (right). Dot sizes were set to a maximum percentage of 50% (genes expressed by more than 50% of cells have the same dot size). Dot color intensity represents scaled expression. e, Seurat FeaturePlot showing the average expression of Enteroendocrine cells (EECs expressing CHGA) and EEC sublineage marker genes in individual EECs of SIORG (top) or SIT (bottom). PAX4, EEC progenitor; ARX, differentiated G/I/L/M/X/D EEC; TPH1, Enterochromaffin cells; SCT, SCT+, S-like cells; SST, D cells; CCK, I cells; GAST, G cells; GHRL, X cells; MLN, M cells. The maximum expression color cutoff set to 3 (cells with an average expression ≥ 3 of a given marker have the same color).
Extended Data Fig. 4
Extended Data Fig. 4. R. aegyptiacus SIORG and SIT express heightened levels of complement system genes compared to human SIORG or human SIT.
a, Seurat FindMarker differential gene expression analysis comparing bat to human SIORG (left), bat to human nasalALI (middle) or bat to human bronchialALI, cultured side-by-side and analyzed by scRNA-seq. Each dot represents the log2 transformed sum of Seurat SCT normalized expression gene counts (bat + human) of differentially regulated genes (x axis) and the log2 fold changes (logFC) from the analysis between the two species (y axis). Positive logFC values indicate upregulated in bat organoids compared to human organoids. Selected complement system genes or interferon stimulated genes (ISGs) are labeled and colored in red. Upregulated markers in human compared to bat organoids are labeled and colored in blue. b, Seurat DotPlot showing the average expression of complement system genes in cell types in the R. aegypticus SIORG (O) or SIT (T) scRNA-seq dataset. Dot size, the percentage of an individual cell type expressing a given marker. Color intensity, the average expression value. Dot sizes were set to a maximum percentage of 50% (genes expressed by more than 50% of cells have the same dot size). c, same as in (b) but in the human SIORG scRNA-seq (left) or in a published human SIT scRNA-seq datasets (ref. ).
Extended Data Fig. 5
Extended Data Fig. 5. Comparison of IFNE or ISG expression in R. aegyptiacus and human organoids, and genetic perturbation of IFNE in bat SIORG.
a, Seurat DotPlot showing the average expression of IFNE and cell type-specific marker genes in the integrated bat nasalALI + bronchialALI (left), or bat SIORG scRNA-seq dataset. Dot size, the percentage of an individual cell type expressing a given marker. Color intensity, the average expression value. Dot sizes were set to a maximum percentage of 50% (genes expressed by more than 50% of cells have the same dot size). b, Seurat DotPlot showing the average expression of ISGs in the bat nasalALI, bronchialALI, alvORG or SIORG scRNA-seq dataset (left), or human nasalALI, bronchialALI or SIORG scRNA-seq dataset (right). Dot size, the percentage of an individual cell type expressing a given marker. Color intensity, the average expression value. c, Violin plots showing the ISG module enrichment score distribution for conserved ISGs (ref. 33) in scRNA-seq of bat or human nasalALI, bronchialALI or SIORG. The distribution was derived from the enrichment scores of individual cells. Median shown as solid line. A positive score indicates enrichment of ISGs in a culture model. Two-sided Mann-Whitney tests were performed to compare human to bat nasalALI, bronchialALI or SIORG (****: P-value < 0.0001). d, Sanger sequencing trace of PCR amplicons spanning the bat IFNE gene in bat SIORG expressing Cas9 and a guide RNA targeting IFNE (sgIFNE) or a non-targeting control guide RNA (sgScrambled). The guide RNA spacer sequence and expected cut site is shown above. e, RT-qPCR analysis of ISGs, normalized to EEF1A1 (2–ΔCT), in Cas9-sgRNA expressing bat SIORG (n = 3). Two-sided unpaired Student’s t-tests were performed to compare ISG expression between sgIFNE-SIORG and sgScrambled-SIORG (**** P < 0.0001). f, VSV titer measured from the culture supernatant of infected sgIFNE (n = 3) or sgScrambled bat SIORG (n = 3) after 8 or 24 hours post infection (hpi). The titer was derived from TCID50 assays performed in VeroE6 cells with five replicates per sample supernatant.
Extended Data Fig. 6
Extended Data Fig. 6. Characterization of virus entry factor expression and antiviral responses to MARV infection in R. aegyptiacus organoids and animals.
a, Seurat DotPlot analysis showing the average expression of virus entry factors of cell types in the bat nasalALI, bronchialALI, alvORG or SIORG scRNA-seq dataset. Dot size, the percentage of an individual cell type expressing a given marker. Color intensity, the scaled average expression value. Dot sizes were set to a maximum percentage of 50% (top) or 25% (bottom). Genes expressed by more than 50% or 25% of cells have the same dot size. b, MARV (Musoke) titer (in focus forming units per ml (FFU/ml)) measured from combined solutions of apical washes and basal chamber medium of infected human BronchialALI (n = 3) or bat NasalALI (n = 3) after one-, three- or seven-days post infection. c, Gene ontology (GO) enrichment analysis, performed using clusterProfiler, revealed biological processes significantly enriched among genes upregulated in MARV-infected vs. mock-infected bat alvORG, or in bat nasalALI at day 5 vs. day 1 post-infection. The top 10 enriched biological processes are shown. The x axis indicates the ratio of enriched to total genes within each GO term. Dot size reflects the number of enriched genes per pathway. d, Heatmap showing normalized gene expression (log2-counts per million + 1) from bulk RNA-seq for IFN subtypes in MARV-infected or mock-infected bat alvORG. Each mRNA value represents the average of three biological replicates. Days post-infection are indicated (D3: day 3 post infection, M: day 3 mock-infected). e, Heatmap displaying log₂-normalized gene expression of MARV NP from reanalyzed public nCounter NanoString data of skin, liver, and colon samples from MARV-infected R. aegyptiacus (n = 4–6). Each mRNA value represents the average of four to six animals present in the dataset. Days post-infection are indicated (D1–D28, D13-M: day 13 mock-infected). f, Heatmap displaying log₂-normalized gene expression of ISGs from reanalyzed public nCounter NanoString data of liver and colon samples from MARV-infected R. aegyptiacus (n = 4–6). Each mRNA value represents the average of four to six animals present in the dataset. Days post-infection are indicated (D1–D28, D13-M: day 13 mock-infected).
Extended Data Fig. 7
Extended Data Fig. 7. Type I/III IFNs drive antiviral gene responses in bat and human organoids.
a, Venn diagrams (generated using eulerr.co) showing the number of significantly upregulated genes determined by bulk RNA-seq in bat nasalORG, alvORG, or SIORG (n = 3 each) following treatment with universal IFNα2 (uIFNα2) or IFNλ1-like compared to mock-treated. The total number of upregulated genes per treatment are indicated. Overlapping regions represent genes commonly induced by both IFNs. b, RT-qPCR analysis of IFIT3 and ISG15 expression, normalized to EEF1A1 (2–ΔCT), in bat nasalORG (n = 3) treated with uIFNα2 or IFNλ1-like for 8 h, with or without ruxolitinib (n = 3). Two-sided unpaired Student’s t-tests were used to compare mRNA levels between ruxolitinib-treated and mock-treated, interferon-stimulated nasalORG. (ns: not significant; *** P < 0.001, **** P < 0.0001). c, Gene ontology (GO) enrichment analysis of bulk RNA-seq data, performed with clusterProfiler, revealed biological processes significantly enriched among genes upregulated in uIFNα2 vs. mock-infected bat nasalORG, alvORG, or SIORG after 8 h (n = 3 each). The top 10 enriched biological processes are shown. The x axis indicates the ratio of enriched to total genes within each GO term. Dot size reflects the number of enriched genes per pathway. d, Same as in (c) but for IFNλ1-like vs. mock-treated bat nasalORG, alvORG, or SIORG. e, Scatter plot showing log2-fold changes in gene expression from bulk RNA-seq comparing human SIORG treated with uIFNα2 (x axis) or IFNλ1-like (y axis) to mock-treated controls after 8 h (n = 3). Individual ISGs and selected pro-inflammatory cytokines (red) are highlighted and labeled. f, same as in (c) but for uIFNα2 (left) or IFNλ1 (right) vs. mock-treated human SIORG. g, Same as in (e) but for human bronchialALI (n = 3). h, Same as in (f) but for GO enrichment analysis of uIFNα2 (left) or IFNλ1 (right) vs. mock-treated human bronchialALI.
Extended Data Fig. 8
Extended Data Fig. 8. Pro-inflammatory genes are not broadly induced in bat organoids treated with IFN or infected with RNA viruses.
a, Heatmap showing gene expression log2-fold changes (from EdgeR bulk RNA-seq differential gene expression analysis) of selected pro-inflammatory genes and selected ISGs in universal IFNα2 (uIFNα2) or IFNλ1 vs. mock-treated human SIORG or human BronchialALI (n = 3 each). b, Same as for (a) but for IFN-treated bat SIORG (n = 3), bat alvORG (n = 3), or bat nasalORG (n = 3). c, Same as for (a) but for MARV-, MERS-CoV- or SeV-infected bat alvORG (n = 3 each), SeV-infected bat SIORG (n = 3), or MARV-infected bat nasalALI (n = 3). Comparisons used for calculation of edgeR log2-fold change are indicated in the legend.
Extended Data Fig. 9
Extended Data Fig. 9. Bat type III IFNλ3-like drive self-regulated antiviral responses in bat SIORG.
a, EdgeR differential gene expression analysis of bat SIORG (n = 3) treated with IFNλ3-like (LOC107521776) (dose equivalent to 1000 U/ml universal IFNα2) for 8 h compared to mock-treated (n = 3). Each dot represents the average expression (in log2-count per million, x axis) and log2-fold change (y axis) of a differentially expressed gene between IFNλ3-like vs. mock-treated SIORG. Selected ISGs are highlighted in red and labeled. b, Gene ontology (GO) enrichment analysis of bulk RNA-seq data, performed with clusterProfiler, revealed biological processes significantly enriched among genes upregulated in IFNλ3-like vs. mock-infected bat SIORG after 8 h (n = 3 each). The top 10 enriched biological processes are shown. The x-axis indicates the ratio of enriched to total genes within each GO term. Dot size reflects the number of enriched genes per pathway. c, Same as in (a) but for IFNλ3-like (LOC107520938) vs. mock-treated SIORG (n = 3). d, Same as in (b) but for IFNλ3-like (LOC107520938) vs. mock-treated SIORG. e, RT–qPCR analysis of IFNL3-like (LOC107521776) mRNA, normalized to EEF1A1 (2–ΔCT) in bat SIORG or alvORG treated with or without recombinant bat IFNλ3-like (equivalent to 1000 U/ml universal IFNα2) for 8 h. A two-sided Student’s t-test was used to compare IFNL3-like mRNA levels 8 h after treatment to mock-treated controls. ***P<0.001, ****P<0.0001.
Extended Data Fig. 10
Extended Data Fig. 10. 10: Bat type I/III IFN drive antiviral responses with different kinetic profiles in bat SIORG or NasalORG.
a, Experimental workflow to assess the temporal induction and maintenance of ISG expression. Bat NasalORG or SIORG are treated with universal IFNα2 (uIFNα2) or bat IFNλ1-like for 3 hours, followed by washout and incubation in IFN-free medium for 24 hours. b, Heatmaps showing RT-qPCR analysis of selected ISGs in bat SIORG (n = 3), with expression values calculated using the 2 -ΔΔCT method: first normalized to EEF1A1 (2–ΔCT), then to baseline levels at −3 h (before treatment). Timepoints shown include before IFN treatment (−3 h), immediately after treatment (0 h), and various hours post-interferon removal (+6h, +24h). Each heatmap value represents the average normalized ISG expression across three biological replicates. Left, uIFNα2. Right, IFNλ1-like treatment. c, same as in (b) but for bat nasalORG. d, RT-qPCR analysis of IFIT1 (normalized to EEF1A1(2–ΔCT), then expressed as a percentage relative to the average sgScrambled control in bat nasalORG engineered with Cas9 and a targeted guide RNA (sgIRF9, sgIFNAR2 or sgIFNLR1) or control guide RNA (sgScrambled) (n = 3 each), treated or not for 8 h with uIFNα2 or bat IFNλ1-like.

References

    1. Irving, A. T., Ahn, M., Goh, G., Anderson, D. E. & Wang, L.-F. Lessons from the host defences of bats, a unique viral reservoir. Nature589, 363–370 (2021). - PubMed
    1. Jebb, D. et al. Six reference-quality genomes reveal evolution of bat adaptations. Nature583, 578–584 (2020). - PMC - PubMed
    1. Zhang, G. et al. Comparative analysis of bat genomes provides insight into the evolution of flight and immunity. Science339, 456–460 (2013). - PMC - PubMed
    1. Pavlovich, S. S. et al. The Egyptian rousette genome reveals unexpected features of bat antiviral immunity. Cell173, 1098–1110 (2018). - PMC - PubMed
    1. Morales, A. E. et al. Bat genomes illuminate adaptations to viral tolerance and disease resistance. Nature638, 449–458 (2025). - PMC - PubMed

LinkOut - more resources