Randomized Controlled Trial
. 2025 Jul;643(8073):1030-1036.
doi: 10.1038/s41586-025-09028-5. Epub 2025 May 21.

Closed-loop vagus nerve stimulation aids recovery from spinal cord injury

Affiliations
Randomized Controlled Trial

Closed-loop vagus nerve stimulation aids recovery from spinal cord injury

Michael P Kilgard et al. Nature. 2025 Jul.

Abstract

Decades of research have demonstrated that recovery from serious neurological injury will require synergistic therapeutic approaches. Rewiring spared neural circuits after injury is a long-standing goal of neurorehabilitation1,2. We hypothesized that combining intensive, progressive, task-focused training with real-time closed-loop vagus nerve stimulation (CLV) to enhance synaptic plasticity3 could increase strength, expand range of motion and improve hand function in people with chronic, incomplete cervical spinal cord injury. Here we report the results from a prospective, double-blinded, sham-controlled, randomized study combining gamified physical therapy using force and motion sensors to deliver sham or active CLV (ClinicalTrials.gov identifier NCT04288245). After 12 weeks of therapy composed of a miniaturized implant selectively activating the vagus nerve on successful movements, 19 people exhibited a significant beneficial effect on arm and hand strength and the ability to perform activities of daily living. CLV represents a promising therapeutic avenue for people with chronic, incomplete cervical spinal cord injury.


Conflict of interest statement

Competing interests: M.P.K. has a financial interest in MicroTransponder Inc., which markets VNS therapy for stroke. R.L.R. is the founder and CEO of XNerve, which developed the VNS device used in this study. The other authors declare no competing interests.

Figures

Fig. 1
Fig. 1. Closed-loop VNS for SCI.
a, CLV combines intensive, task-oriented rehabilitation and concurrent VNS delivered with a miniaturized implanted stimulator to promote adaptive changes in the central nervous system and facilitate recovery of function. b, CLV integrates external and implanted hardware to deliver high-intensity arm and hand therapy enhanced by real-time neuromodulation. The miniaturized implant is powered and controlled by an external device placed on the neck during rehabilitation sessions. A suite of sensors enables the rehabilitation software to provide continuous visual feedback of hand position and force production during individualized rehabilitative exercises and facilitate real-time delivery of VNS during above average movements. c, In this study, we observed that CLV (red) produced accumulating improvements in upper limb recovery exceeding those with intensive rehabilitation with sham stimulation (blue). d, CONSORT diagram summarizing the enrolment stages and the per protocol completion rate (detailed in Extended Data Fig. 1). A description of reasons participants did not meet criteria can be found in Extended Data Table 2. All participants that met enrolment criteria were implanted and completed the study per protocol, which involved 42 visits total, including 36 physical therapy sessions. Participants were block randomized to receive 18 sessions of rehabilitation with either active CLV (1× CLV) or sham stimulation (1× rehab) during the RCT phase, followed by an additional 18 sessions of rehabilitation with active CLV regardless of previous group assignment. Participants that received 36 sessions of rehabilitation with active CLV are labelled as 2× CLV. This design allows comparison with sham stimulation and of two dosing regimens of CLV. e, The proportion of injury type, ethnicity and age of individuals in this study are comparable with averages reported by the National Spinal Cord Injury Statistical Center.
Fig. 2
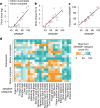
Fig. 2. Hand and wrist dysfunction after SCI represent targets for improved functional recovery.
a,b, Clinical impairment as measured by GRASSP is well correlated with pinch force (a) and wrist torque (b). c, Both metrics make statistically significant contributions to a linear model that accounts for most of the variance in clinical impairment. The strong correlation between clinical impairment and distal strength supports the selection of rehabilitative exercises designed to target these muscles. d, Each participant displayed a unique set of impairments as measured by the GRASSP score. The Pearson correlation coefficient between individuals was 0.34 ± 0.35 (mean ± s.d.). The colour represents the degree of function on each of the 25 components of the GRASSP assessment. This diversity in function motivated the creation of individualized rehabilitative regimens.
Fig. 3
Fig. 3. CLV therapy was intensive and individualized.
a, Each CLV session was individualized and emphasized a variety of exercises. The rehabilitative regimen used a range of sensors, including a wireless accelerometer, strain gauge, rotary encoder, keyboard, video camera and touchscreen. An algorithm utilized the sensor data to select above-threshold movements during exercises and deliver real-time VNS. Panel a adapted from ref. , Sage (traffic racer and breakout); ref. , under a CC BY 4.0 license (finger module, and isotonic wrist pronation and supination ROM device); and from VectorStock (hand holding tablet). Colours correspond to the key in panel bb, Over 36 days of therapy, participants completed approximately 4,800 activities, individualized to their level of impairment and residual hand and arm function. Participants performed 6–9 different activities per session, with each activity lasting an average of 3.3 min (IDR: 0.7–5.5 min) and typically repeated twice per session. The colour of the circle indicates the category of rehabilitative exercise performed during the activity, and the area of each circle reflects the number of minutes actively engaged in each task. We observed a 100% compliance rate, with all participants completing 36 sessions of therapy. A supplementary interactive HTML version of this figure provides comprehensive information on each session for each participant, including the number of VNS events, the number of repetitions, the assistance factor, the difficulty level, motor performance, and whether active or sham VNS was delivered. c, A therapist guiding exercises increased the linear assistance factor (gain), which was multiplied by the force or range of motion for each exercise for each person until they could succeed in gameplay. The average value was highly correlated with baseline GRASSP scores, which confirms that exercises were individualized and challenging. d, In addition, the overseeing therapist increased game level to ensure that tasks were challenging at every stage of therapy. Higher game levels required greater speed and precision. The average game level increased steadily over the 36 days of therapy for all participants (Pearson correlation, P < 0.001).
Fig. 4
Fig. 4. CLV improves hand and wrist strength, speed and range of motion.
a,b, Pinch force (a) and knob torque (b), exercises performed by all participants, steadily increased over the course of therapy in the substantial majority of individuals. ci, Similarly, strength, speed and range of motion (ROM) increased across a wide range of isometric and dynamic exercises. A linear mixed model was fitted to the data for each task, which was collected from daily rehabilitative training sessions. There was a significant fixed effect of therapy day for each task, as noted by the P value on each of the figure’s panels. n denotes the number of participants that performed the task as part of their individualized therapy. The thick lines indicate participants who made statistically significant increases in task performance as a function of therapy day. The y axis maximum represents the median of unimpaired controls. Note that because exercise regimens were individualized, not all participants performed all exercises.
Fig. 5
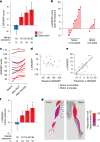
Fig. 5. CLV improves clinical metrics of upper limb function.
a, In the double-blinded, sham-controlled phase of the study, GRASSP score was significantly improved compared with baseline in all participants after 18 sessions of CLV and in the subset of participants that received 36 sessions of CLV. No gains were observed in the group that received intensive rehabilitation with sham stimulation (stim). CLV produces a medium effect in improvement in upper limb function (Cohen’s d effect size > 0.5). b, After the completion of 36 sessions of therapy (after therapy), 8 individuals made meaningful increases in the GRASSP score. This effect appears to be larger in individuals with motor incomplete injuries (AIS C and D). Dashed line indicates the cut-off for a meaningful increase, as defined by a 6-point or greater increase in GRASSP score. c, Meaningful improvements (denoted with bold lines) were observed across participants with severe, moderate and mild impairments in hand and arm function. d, Single characteristics, including the baseline GRASSP score, were not correlated with treatment response. Dashed line denotes no change in GRASSP score. e, However, a multiple linear regression model (detailed in Extended Data Table 3) with the AIS grade, GRASSP strength subscore, and GRASSP palmar and dorsal sensory subscores as inputs was highly correlated with the change in the GRASSP score from baseline to completion of 18 sessions of CLV. f, The strength subscore of GRASSP was significantly improved compared with baseline with CLV and unchanged with equivalent rehabilitation with sham stimulation. g, A range of the ten muscle groups evaluated during the GRASSP assessment improved with therapy. Muscles are colour coded to illustrate the percent of responders who exhibited measurable improvements in each muscle. Deltoid, pollicis longus, elbow extensors and wrist extensors were among the most commonly improved muscles. Panel g adapted using Sketchfab under a CC BY 4.0 license. Panels a,c,f used two-way paired Student’s t-test versus baseline for CLV, and Wilcoxon signed-rank versus baseline for sham stimulation; *P < 0.05 and **P < 0.01. Group data are presented as mean ± s.e.m.
Extended Data Fig. 1
Extended Data Fig. 1. CLV Study design.
(a) The study was designed to establish safety and feasibility as well as to estimate the effect of closed-loop delivery of VNS during high-intensity physical therapy compared to high-intensity physical therapy alone. After enrollment, all subjects were implanted with the VNS device. Participants were block randomized to receive 18 sessions of rehabilitation with either active CLV (1x CLV; n = 10 participants) or sham stimulation (1x Rehab; n = 9 participants) during the RCT phase, followed by an additional 18 sessions of rehabilitation with active CLV regardless of prior group assignment. Participants that received 36 sessions of rehabilitation with active CLV are labelled as 2x CLV. This design allows comparison with sham stimulation and of two dosing regimens of CLV. Assessments were completed before and after surgery, after eighteen therapy sessions, and after thirty-six therapy sessions. The final assessment was conducted 9.7 ± 2.1 days after the last day of VNS. (b) Depiction of change in GRASSP scores from baseline, the main functional outcome of the study, at each assessment during the RCT. Gray markers indicate individual participants. Paired Student’s t-test v. baseline; * indicates p < 0.05; data presented as mean ± SEM.
Extended Data Fig. 2
Extended Data Fig. 2. The number of stimulations delivered during therapy is stable across a range of impairments and over therapy sessions.
The number of VNS events delivered during a rehabilitation sessions was not correlated with either baseline GRASSP score (a) or change in GRASSP score (b), indicating that the therapy was scaled by the level of impairment to ensure a consistent number of stimulations. Symbols denote individual participants. (c) Additionally, stimulation rate was stable across the duration of rehabilitative sessions, indicating that the algorithm was robust against effects of fatigue or other sources of variability in performance. Data are presented as mean ± SD number of VNS events per 10-minute bin over the course of each rehabilitation session for each participant.
Extended Data Fig. 3
Extended Data Fig. 3. CLV improves hand and wrist strength, speed, and range of motion.
a) Pinch force and b) knob torque, exercises performed by all participants, steadily increased over the course of therapy in the substantial majority of individuals. c-i) Similarly, strength, speed, and range of motion increased across a wide range of isometric and dynamic exercises. A linear mixed model was fitted to the data for each task. There was a significant fixed effect of therapy day for each task, as noted by the p-value on each of the figure’s panels. n denotes the number of participants that performed the task as part of their individualized therapy. Performance metrics for each day are shown as dots. Thick lines indicate participants who made statistically significant increases in task performance as a function of therapy day. The y-axis maximum represents the median of unimpaired controls. (j-r) Same as above, but plotted on a linear scale.
Extended Data Fig. 4
Extended Data Fig. 4. CLV produces modest gains in GRASSP score in the untrained arm and on functional measures.
(a) GRASSP score in the untrained arm was significantly improved compared to baseline in all participants after 18 sessions of CLV and in the subset of participants that received 36 sessions of CLV. No gains were observed in the group that received intensive rehabilitation with sham stimulation. Gains in the untrained arm were more modest than those observed in the trained arm. Improvement in the untrained arm was not expected because VNS-induced plasticity is specific to the paired training. However, these improvements may be explained by some amount of bilateral involvement in training, generalization, or VNS-dependent pruning of synaptic connectivity in hyperconnected networks, each of which could reduce spasticity or otherwise produce benefits to the untrained arm. Future physiological studies are needed to understand why small, but statistically significant, improvement was observed in the untrained arm. (b) Additionally, participants that receive 36 sessions of CLV exhibit improved Jebsen-Taylor Hand Function scores in the trained arm compared to baseline. (c) Though not significant in the whole population, an exploratory analysis of only motor incomplete participants demonstrates a significant correlation between change in GRASSP score and JTHF score at the end of therapy (R = 0.59; p = 0.034), potentially indicative of clinical and functional gains. Symbols (and n) indicate individual participants. For panels a and b: Paired Student’s t-test v. baseline, * indicates p < 0.05. Group data are presented as mean +/− SEM.
Extended Data Fig. 5
Extended Data Fig. 5. VNS was delivered on above average movements for each participant.
Closed-loop triggering produces bursts of VNS that coincide with the largest movements that occurred during therapy. Both therapist and an automated algorithm were able to outperform open-loop (e.g. periodic) triggering. Automated closed-loop triggering using real-time sensor data was able to outperform therapists using visual inspection to determine stimulation timing. Symbols denote individual exercises for participants that received both manual and automated triggering, and boxes show median and interquartile range. Unpaired Student’s t-test across conditions, *** indicates p < 1 × 10⁻¹⁷.
Extended Data Fig. 6
Extended Data Fig. 6. CLV does not affect cardiovascular function in individuals with SCI.
To determine whether CLV would impact measures of cardiovascular function, we measured vital signs prior to the initiation of therapy (baseline) and after the completion of the first 18 sessions of CLV (n = 19 participants). Heart rate (a), systolic blood pressure (b), and respiratory rate (c) were not influenced by CLV. Data are presented as mean ± STD. Symbols denote individual participants.

References

    1. Raineteau, O. & Schwab, M. E. Plasticity of motor systems after incomplete spinal cord injury. Nat. Rev. Neurosci.2, 263–273 (2001). - PubMed
    1. Murphy, T. H. & Corbett, D. Plasticity during stroke recovery: from synapse to behaviour. Nat. Rev. Neurosci.10, 861–872 (2009). - PubMed
    1. Ganzer, P. D. et al. Closed-loop neuromodulation restores network connectivity and motor control after spinal cord injury. eLife7, e32058 (2018). - PMC - PubMed
    1. Krucoff, M. O., Rahimpour, S., Slutzky, M. W., Edgerton, V. R. & Turner, D. A. Enhancing nervous system recovery through neurobiologics, neural interface training, and neurorehabilitation. Front. Neurosci.10, 197364 (2016). - PMC - PubMed
    1. Lorach, H. et al. Walking naturally after spinal cord injury using a brain–spine interface. Nature618, 126–133 (2023). - PMC - PubMed

Publication types

Associated data