. 2025 Jul;643(8071):478-487.
doi: 10.1038/s41586-025-09041-8. Epub 2025 May 21.

Clonal tracing with somatic epimutations reveals dynamics of blood ageing

Affiliations

Clonal tracing with somatic epimutations reveals dynamics of blood ageing

Michael Scherer et al. Nature. 2025 Jul.

Abstract

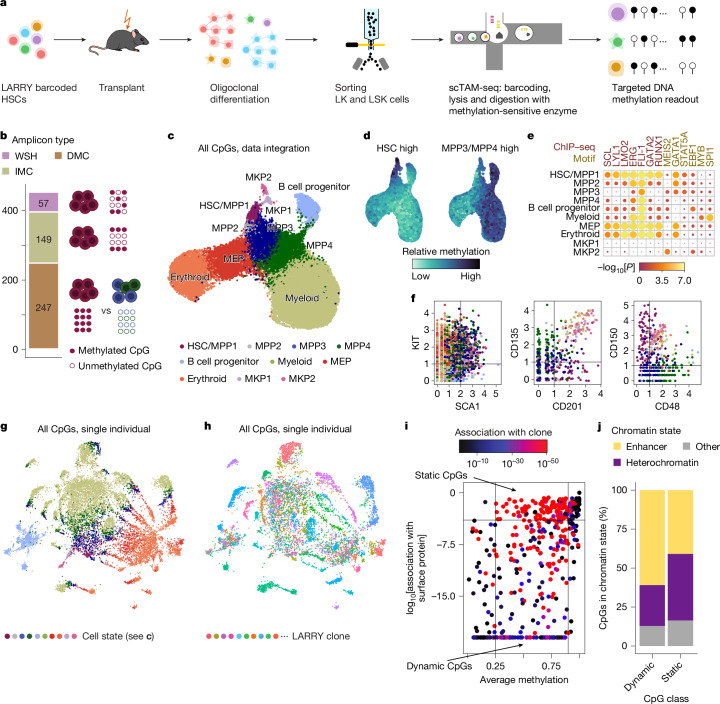
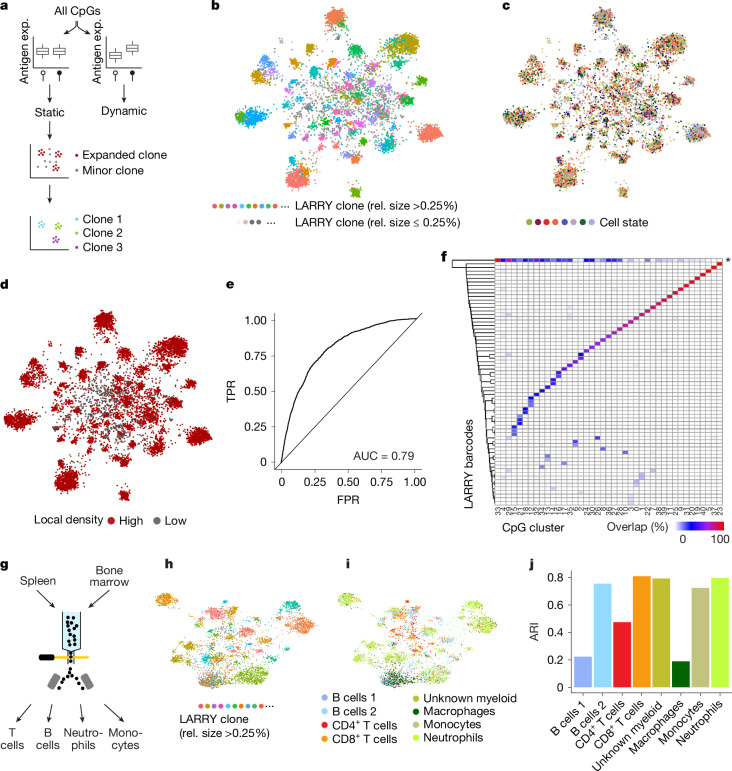
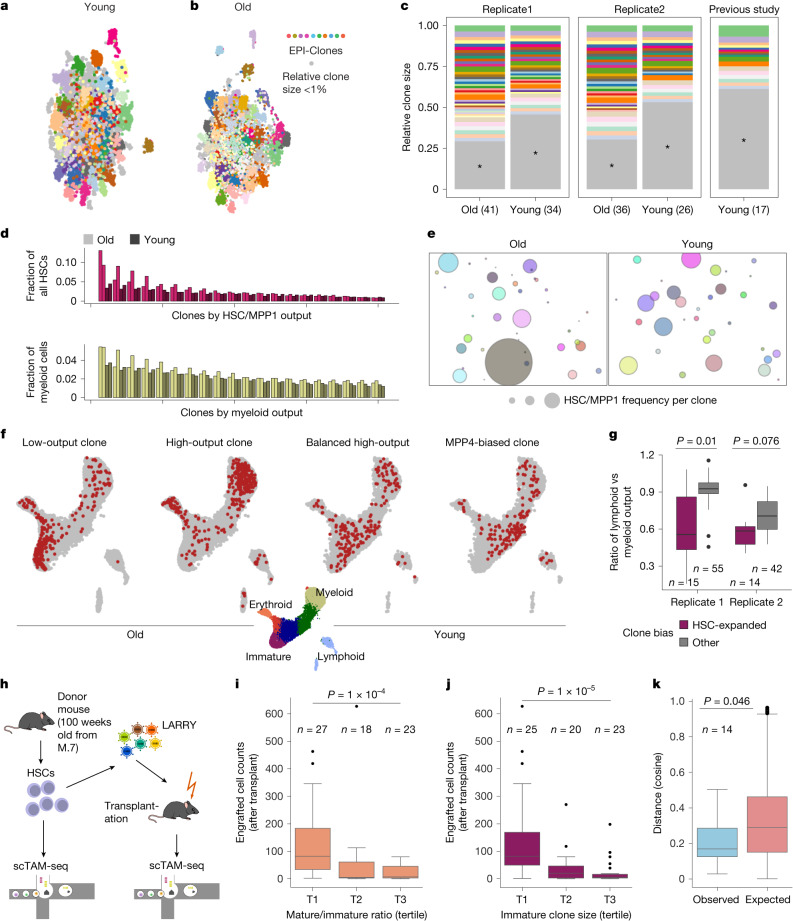
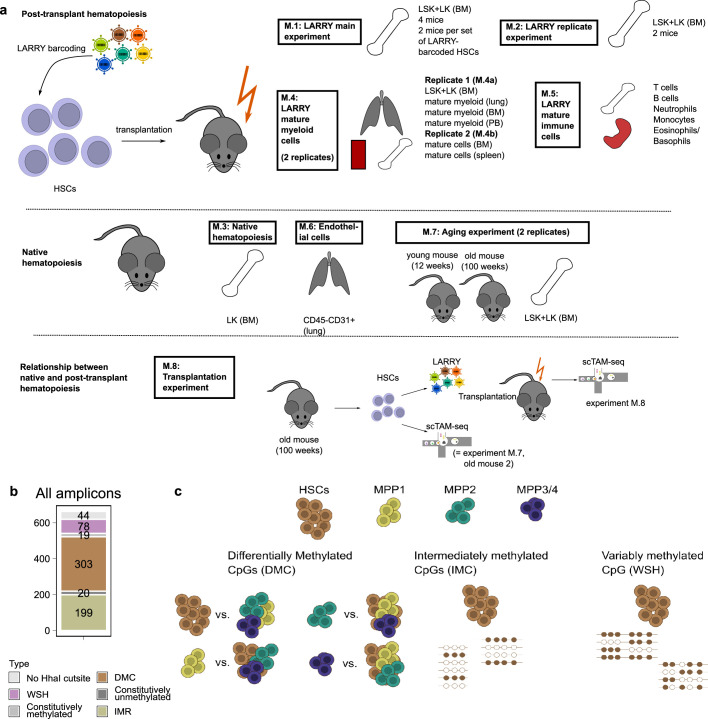
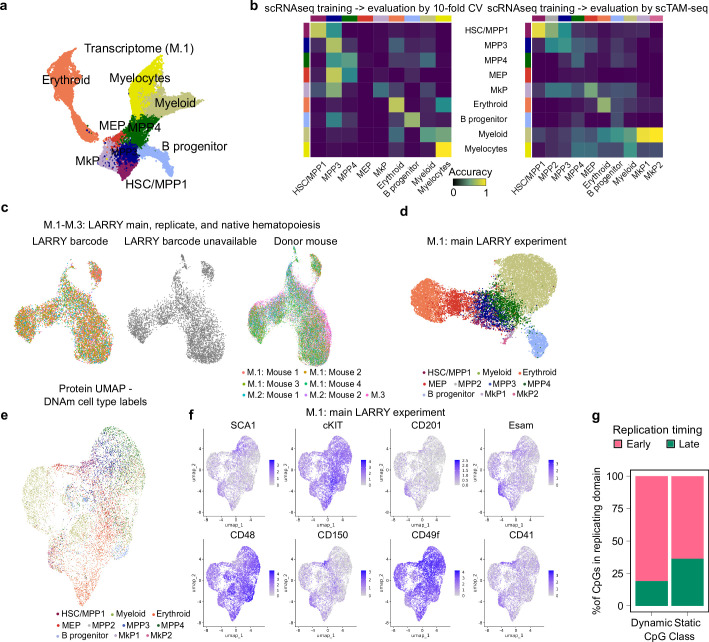
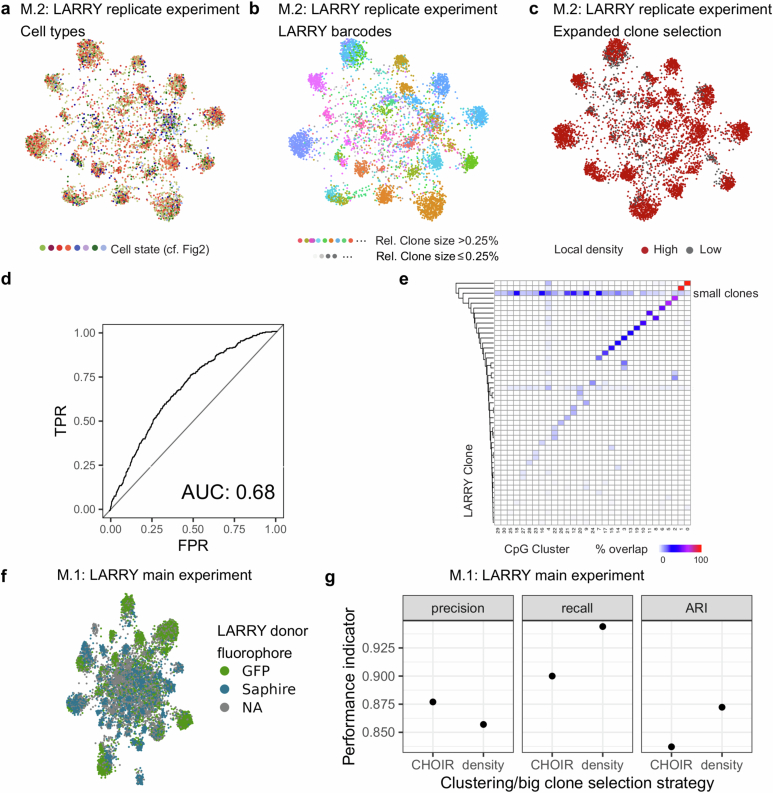
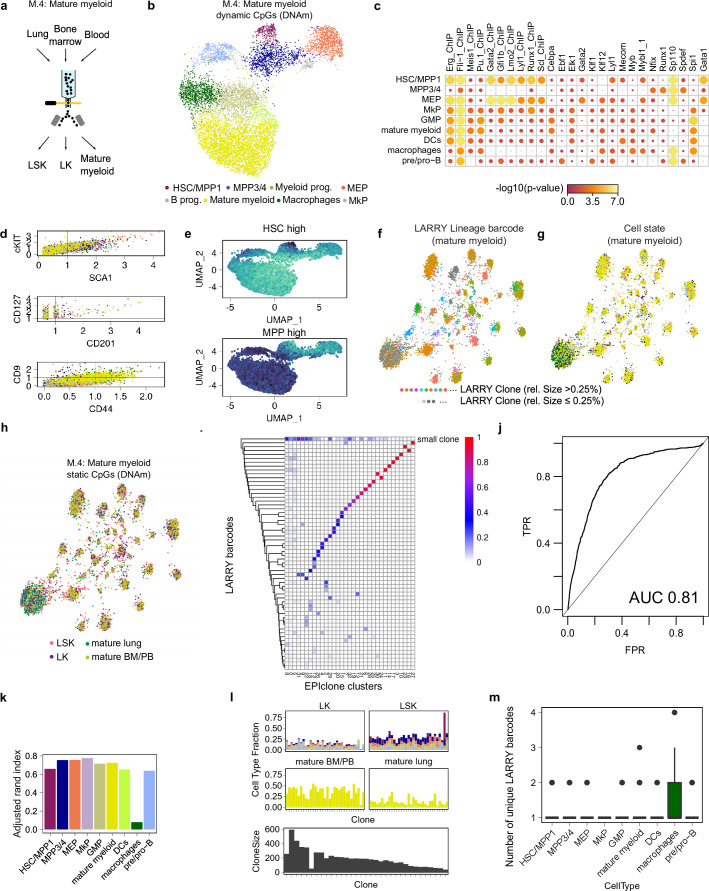
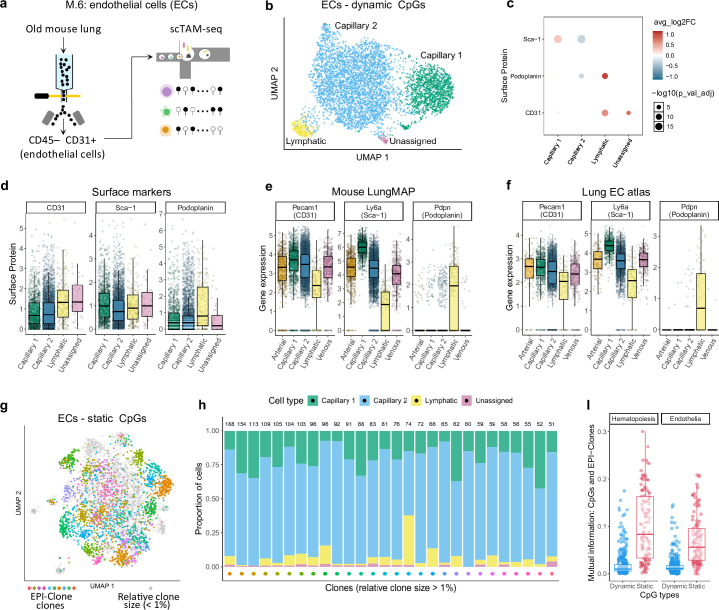
Current approaches used to track stem cell clones through differentiation require genetic engineering1,2 or rely on sparse somatic DNA variants3,4, which limits their wide application. Here we discover that DNA methylation of a subset of CpG sites reflects cellular differentiation, whereas another subset undergoes stochastic epimutations and can serve as digital barcodes of clonal identity. We demonstrate that targeted single-cell profiling of DNA methylation5 at single-CpG resolution can accurately extract both layers of information. To that end, we develop EPI-Clone, a method for transgene-free lineage tracing at scale. Applied to mouse and human haematopoiesis, we capture hundreds of clonal differentiation trajectories across tens of individuals and 230,358 single cells. In mouse ageing, we demonstrate that myeloid bias and low output of old haematopoietic stem cells6 are restricted to a small number of expanded clones, whereas many functionally young-like clones persist in old age. In human ageing, clones with and without known driver mutations of clonal haematopoieis7 are part of a spectrum of age-related clonal expansions that display similar lineage biases. EPI-Clone enables accurate and transgene-free single-cell lineage tracing on hematopoietic cell state landscapes at scale.


Conflict of interest statement

Competing interests: A.R.-F. serves as an advisor for Retro Bio. Parts of this study have been supported with reagents donated by Mission Bio. The other authors declare no competing interests.

Figures

Fig. 1
Fig. 1. DNA methylation jointly encodes cellular differentiation and clonal identity.
a, Schematic of experiments M.1 (LARRY main experiment) and M.2 (replicate LARRY experiment). b, Overview of the 453 CpGs covered by our scTAM-seq panel in mice. Variably methylated CpGs were selected from bulk whole-genome bisulfite sequencing data. DMC, differentially methylated CpG; IMC, intermediately methylated CpG; WSH, within-sample heterogeneity (see Extended Data Fig. 1c for definition). c, UMAP of DNA methylation data for HSPCs from experiments M.1–M.3. Batch correction was applied before UMAP. Colours highlight groups identified from unsupervised clustering. Annotations are based on df. d, DNA methylation UMAP as in c, highlighting the average, relative methylation state of cells across all CpGs that are methylated in HSCs or MPP3/MPP4 cells in bulk-sequencing data. e, Enrichment analysis of TFBSs near CpGs specifically unmethylated in a cell-type cluster. See the section ‘Data integration and annotation of cell states’ in the Methods. f, Normalized surface-protein expression of SCA1, KIT, CD135, CD201, CD48 and CD150. The CD135–CD201 and CD48–CD150 plots only show LSK cells. Colour indicates cell states per c. g, UMAP of DNA methylation data from HSPCs from experiment M.1. Colour indicates cell states per c. h, Same UMAP as in g, highlighting clones as defined from LARRY barcodes. LARRY barcodes were read out from DNA as part of scTAM-seq. i, Scatter plot depicting, for n = 453 CpGs, the average methylation rate, the statistical association with surface-protein expression and the statistical association with the LARRY clonal barcode (P value from a two-sided chi-squared test). The CpGs in the upper and lower central rectangle were defined as static or dynamic CpGs, respectively. j, Bar chart depicting the percentage of static and dynamic CpGs annotated as enhancer or heterochromatin. DMC, differentially methylated cytosine; IMC, intermediately methylated cytosine; MEP, megakaryocyte–erythroid progenitor cells; WSH, within-sample heterogeneity. The scTAM-seq schematic in a was adapted from ref. under a Creative Commons licence CC BY 4.0. Source data
Fig. 2
Fig. 2. EPI-Clone reliably identifies clones from DNA methylation data only.
a, Schematic overview of EPI-Clone. See the main text for details. Exp, expression. b, UMAP of DNA methylation computed on static CpGs only for experiment M.1, which highlights clonal identity as defined by LARRY barcodes. Only cells carrying a LARRY barcode are shown and cells with a relative clone size (rel. size; defined using LARRY) less than 0.25% are shown in grey. c, Same UMAP as in b, but highlighting the cell states as defined in Fig. 1c. d, UMAP highlighting cells that were selected as part of expanded clones based on local density in PCA space. e, Receiver-operating characteristics curve visualizing the performance of classifying cells into expanded and non-expanded clones based on local density in PCA space spanned by the static CpGs. LARRY clone size was used as the ground truth, whereby clone sizes larger than 0.25% were considered expanded. TPR, true positive rate; FPR, false positive rate. f, Heatmap depicting the overlap between LARRY barcode and methylation-based clonal clusters identified by EPI-Clone. The row labelled with an asterisk contains all LARRY clones with a clone size less than 0.25%. g, Schematic of experiment M.5: LARRY mature immune cell experiment. h, UMAP of DNA methylation for cells from expanded clones in experiment M.5. Cells are coloured by LARRY barcode. The static CpGs identified from experiment M.1 were used. i, Same UMAP representation as in h, but highlighting the cell-state annotation as defined in Supplementary Fig. 4. Of note, most of the clones identified using EPI-Clone were specific for T cells, B cells or myeloid cells, in line with the result from LARRY (Supplementary Fig. 4d). j, ARI values between the ground-truth clonal label (LARRY) and the clones identified by EPI-Clone stratified by cell type. Source data
Fig. 3
Fig. 3. HSC-expanded clones emerge during mouse ageing.
a, DNA methylation UMAP based on the static CpGs for a native, young (12 weeks old) mouse from experiment M.7. b, DNA methylation UMAP based on the static CpGs for an old mouse (100 weeks old). In a and b, three outlier clusters with size <1% were removed to improve visualization. c, Comparison of clone sizes for old and young mice (two biological replicates), and a young mouse from a previous study. Clones with a relative size less than 1% are shown in grey. d, Comparison of HSC/MPP1 output and myeloid output for the 20 clones with the highest HSC/myeloid output between young and old mice (2 replicates). e, Bubble plot visualizing the frequency of HSC/MPP1 cells per clone for old and young mice. f, Differentiation UMAP defined on the basis of dynamic CpGs, highlighting example clones with different behaviour for old and young mice. For a, b, e and f, data from replicate 1 is shown, see Supplementary Fig. 7 for replicate 2. g, Comparison of the ratio between lymphoid and myeloid output per clone identified using EPI-Clone. P values calculated using two-sided Wilcoxon tests. h, Experimental design for the transplantation experiment (M.8). i,j, Boxplots of post-transplant clone sizes, comparing clones with different pre-transplant differentiation bias calculated as the ratio of mature versus immature cells per clone (i) and different pre-transplant immature clone sizes (j). Tertile T1 has the lowest mature output (i) and smallest clone size (j). k, Boxplot showing the distribution of pairwise cosine observed (Obs.) versus expected (Exp.) distances (before and after transplant) computed using the cell-type distribution of each clone. Observed data are compared with a null model created by randomly shuffling the clonal identities of post-transplant clones (1,000 times). P values of ik are from two-sided Wilcoxon tests. For d,e,g and ik, see the section ‘Data visualization’ in the Methods for a definition of boxplot elements and further detail. The scTAM-seq schematic in h was adapted from ref. under a Creative Commons licence CC BY 4.0. Source data
Fig. 4
Fig. 4. EPI-Clone identifies expanded clones with and without CH mutations in human samples.
a, Summary of donor characteristics (Supplementary Table 1). Dots connected by dashed lines denote samples that were analysed as part of the TBM and the CD34+ dataset. b, Integrated UMAP of dynamic CpG and surface-protein data for all donors from the TBM and CD34+ datasets. Cell states were annotated based on the expression of surface proteins (Extended Data Fig. 7c–e). c, UMAPs computed per donor on a consensus set of static CpGs, highlighting cells containing the specified CH mutations. See Extended Data Fig. 7f–h and Methods for how consensus static CpGs were identified. The donors are sorted by increasing age. d, UMAPs as in c, highlighting clones identified using EPI-Clone. e, Scatter plot displaying the percentage of cells from each identified clone displaying CH mutations. The identified clones (x axis) are sorted by size. Dots in colours correspond to the clones dominated by a CH mutation, see c for colour scheme. f,g, Scatter plot relating donor age (f) and the presence of GMPs (g) to the number of clones identified by EPI-Clone in the TBM cohort and CD34+ cohort, respectively. P value calculated with a two-sided t-test computed from a generalized linear model of the Poisson family, using the number of cells observed as a weight. Dot size denotes the number of cells analysed (see b for a scale). h, Boxplot depicting clone sizes stratified into clones carrying CH mutations and clones for which no CH mutation was identified. See the section ‘Data visualization’ in the Methods for a definition of boxplot elements. Source data
Fig. 5
Fig. 5. CH clones are part of a spectrum of age-related clonal expansions.
a, Scatter plot depicting the fraction of immature B cells per clone relative to the fraction of immature B cells in non-expanded clones from the same patient. Grey dots are clones with no known driver mutation, dots in colour are clones with a CH mutation (see Fig. 4c for the colour scheme). b, Dot plot depicting P values for enrichments and depletion of cell types in expanded versus non-expanded and CH versus non-CH clones. For this analysis, cell-type composition of clones (for example, the percentage of clone CD34+) were transformed using a logit transform and P values were computed using a mixed-effect model, using donor as a random effect and clone type (expanded or non-expanded or CH or non-CH) as a fixed effect (Extended Data Fig. 8f,g). c, Schematic of the scTAMARA-seq protocol (for the X.1 experiment; Extended Data Fig. 9). d, Clones discovered using EPI-Clone were identified on CD34+ cells from donor X.1 using DNA methylation data. Subsequently, genes with differential expression between clones and correlation with the percentage of HSC/MPPs in the clone were identified. Adjusted P values were calculated using two-sided tests for Pearson correlation, adjusted for multiple testing. e, Schematic of experiment X.2 (scTAMito-seq; Extended Data Fig. 10). f, Scatter plot depicting the presence of six mitochondrial variants in the different clones identified using EPI-Clone from X.2. Cells were scored as positive for the variant if at least 5% of reads supported the variant. The enrichment of variants in the identified clones was determined by a two-sided binomial test. The identified clones were classified as B cell, T cell or NK cell clones if at least 80% of cells were from a single lineage or as multilineage clones otherwise. g, Like f, but for the mt:7076A>G variant. Source data
Extended Data Fig. 1
Extended Data Fig. 1. Overview of experimental design and CpG panel.
a. Experimental design of the mouse experiments M.1-M.8. See also Supplementary Table 1. LSK: LINSCA1+KIT+, LK: LINKIT+. b. Distribution of the CpGs covered by all 663 amplicons in our panel. From this set of amplicons, 453 WSH/DMC/IMR CpGs were selected based on a low dropout in a control experiment, see methods. c. Schematic overview of the CpG selection for scTAM-seq. Bulk DNA methylation data was collected from Cabezas-Wallscheid et al.. We identified three classes of CpGs, which we included in the final panel design shown in Fig. 1b: DMCs, IMCs, and WSH. DMCs are defined by comparisons between cell types, IMCs are regions with intermediate methylation in HSCs, and WSHs are regions with intermediate methylation in HSCs and a high degree of intra-molecule variability. The lines represent sequencing reads, where filled circles stand for methylated and unfilled circles for unmethylated CpGs, respectively.
Extended Data Fig. 2
Extended Data Fig. 2. Comparison of different data modalities for the identification of cell state (experiment M.1-M.3).
a. UMAP of transcriptomic data from the same cell pool as for DNAm for experiment M.1. b. Confusion matrices between scRNA-seq celltypes and scTAM-seq celltypes (Fig. 1c vs. panel A). To compute the confusion matrix, a random forest classifier was trained to predict cell type from surface antigen expression data, using the scRNA-seq modality. The confusion matrix for that classifier during 10-fold cross validation is shown in the plot on the left. The same classifier was then applied to predict cell type in the scTAM-seq experiment, where the same surface antigens were measured using the same TotalSeq-B cocktail. Label transfer accuracy is shown. c. Integrated UMAP of the LARRY main experiment, replicate, and native haematopoiesis (experiments M.1-M.3) as in Fig. 1c, highlighting the LARRY barcodes and donor mouse. d. UMAP defined only on the dynamic CpGs. The plot shows all 13,885 cells from the experiment M.1 (LARRY main experiment). Indicated in colors are the cell types defined in Fig. 1c. e. Surface protein UMAP of experiment M.1 (13,885 cells) with the cell type labels obtained from the DNA methylation UMAP as shown in Fig. 1c. Protein data was normalized using SCTransform prior to generating a low-dimensional representation with PCA and UMAP. f. Expression of selected surface proteins in the protein UMAP. g. Bar chart depicting the percentage of static and dynamic CpGs within early/late replicating domains, respectively. Source data
Extended Data Fig. 3
Extended Data Fig. 3. Validation of EPI-clone’s capability on a biological replicate (experiment M.2).
a,b,c. Clonal UMAP based on static CpGs as in Fig. 2b, computed for experiment M.2: LARRY replicate experiment. Indicated are the cell state (A) and the LARRY barcode (B). C highlights cells that were selected as part of expanded clones, based on local density in PCA space. d. Receiver-Operating Characteristics Curve characterizing the performance of the local density criterion in selecting expanded clones for the biological replicate. e. Overlap between clones defined using EPI-clone and ground truth labels for the biological replicate. The remark ‘small clones’ indicates all LARRY clones with a relative size less than 0.25%. f. Same UMAP as in Fig. 2b highlighting the LARRY donor labeled by two unique fluorophore sequences. For experiment M.1, two donor mice were sacrificed and HSCs were labeled with LARRY constructs containing a GFP label in one case, and LARRY constructs containing a Sapphire label in the other case. Subsequently, labeled cells from each donor were transplanted into two recipient mice each. Accordingly, the data set contains cells from four mice that contain two sets of clones, labeled with GFP and Sapphire, respectively, see also methods. g. Comparison between the performance of the density-based clustering of EPI-Clone with the performance of CHOIR, a parameter-free clustering method. Precision and recall were calculated for the identification of cells from expanded (>0.25%) clones. ARI: Adjusted rand index. The results are shown for experiment M.1: LARRY main experiment. Source data
Extended Data Fig. 4
Extended Data Fig. 4. EPI-Clone’s performance in mature myeloid cells (experiment M.4).
a. Overview of the sorting scheme for experiment M.4: Mature myeloid cells. b. UMAP based on dynamic CpGs (defined from experiment M.1) showing the differentiation state of mature myeloid cells and their progenitors. c. Enrichment of CpGs specifically unmethylated in a cell-type cluster according to the vicinity to the annotated TFBS, see also main Fig. 1e. d. Expression of surface proteins in the different cell type clusters for stem-cell-specific markers (KIT, SCA1, CD201) and markers of mature myeloid cells (CD9, CD44). e. UMAP as in B, highlighting relative methylation state of cells across all CpGs that are methylated in HSCs or MPP3/4 in bulk data. See also main Fig. 1d. f. UMAP computed on static CpGs (defined from experiment M.1) with the LARRY barcodes indicated. g. Same UMAP as in F, with the cell states as defined in B indicated. h. UMAP representation as in F visualizing the different cellular compartments including progenitors (LSK, LK) and mature cells from lung and BM/PB. i. Overlap between clones defined using EPI-clone and ground truth clonal labels for the mature myeloid experiment. j. Receiver-Operating Characteristics Curve characterizing the performance of the local density criterion in selecting expanded clones for the mature myeloid experiment. k. Adjusted rand indices quantifying the overlap between EPI-clone clusters and LARRY barcodes stratified by the different cell types identified in B. l. Cell type distribution and clone sizes in different clones identified by EPI-Clone and stratified by cellular compartment m. Number of unique LARRY barcodes per cell type cluster. The elevated number of LARRY barcodes per cell in the macrophage cluster suggests the presence of contaminant DNA from doublets or phagocytosis in this cluster. Source data
Extended Data Fig. 5
Extended Data Fig. 5. Cell type mapping and clonality of lung endothelial cells by scTAM-seq and EPI-clone (experiment M.6).
a. Lung cells were isolated from an old mouse, then purified and sorted to filter out CD45+ cells and enrich for CD31 + , before profiling with scTAM-seq. b. UMAP embedding and low-resolution clustering of endothelial cells using the dynamic CpGs identified in experiment M.1. c. Differential expression analysis of surface markers in the different clusters from panel B. d. CLR-normalized expression values of surface markers across the different clusters. e. Normalized expression of the corresponding genes (scRNA-seq) for endothelial cells from the Mouse LungMAP, only for adult samples. f. Normalized expression of the corresponding genes (scRNA-seq) for endothelial cells from the lung EC atlas. g. UMAP computed on static CpGs (identified in experiment M.1). Colors highlight clones identified by EPI-Clone with a relative clone size greater than 1%. h. Barplot of endothelial cell types contributions across clones; again, only EPI-clones with a relative clone size greater than 1% are visualized; numbers in the top of the bars represent the absolute clone size, i.e. number of cells. i. Mutual information between methylation status of all CpGs and the EPI-clones for endothelial and haematopoietic cells.
Extended Data Fig. 6
Extended Data Fig. 6. Transplantation experiment profiling EPI-clones before and after transplantation (experiment M.8).
a. Overview of the experimental design for experiment M.8: transplantation experiment. HSCs from an old donor mouse (100 weeks) were either LARRY-barcoded and transplanted into a recipient mouse or directly used for processing with scTAM-seq/EPI-clone. In the negative control, we performed EPI-clone analysis on a set of unrelated HSCs from an old mouse (100 weeks) and the transplanted mouse. b. Joint EPI-clone clustering of the donor and the transplanted mouse. Highlighted in red are HSCs from the donor mouse. c,d. Same EPI-clone UMAP as in B highlighting the sample origin (C) and the LARRY barcode (D). e. Quantification of the fraction of EPI-clone clones that have at least one HSC from the donor mouse. This would indicate that a progenitor cell of this HSC gave rise to this clone. If a HSC successfully engrafts, it should keep its clonal DNA methylation pattern (i.e., EPI-clone identity) and pass it to all of its progeny. Since all blood progeny in the transplantation setting comes from the transplanted HSCs, the donor HSC giving rise to the blood cells should also be part of the same EPI-clone cluster. We observe that this is the case for the transplantation experiment, but not for clustering together the transplanted mouse with an unrelated, aged mouse (negative control). f. Correlation between the clone sizes observed in the Donor and in the transplanted mouse for the shared EPI-clones. The values indicate the Pearson correlation coefficient and corresponding p-values from a Correlation test. g. Spearman correlation between the clonal output of each clone towards the three main blood lineages compared between the donor mouse and the transplanted mouse. The asterisk indicated p-values below 0.1 from a correlation test. Source data
Extended Data Fig. 7
Extended Data Fig. 7. Application of EPI-Clone to human bone marrow samples.
a. Scheme illustrating selection of target CpGs from bulk whole genome bisulfite sequencing data, see also Methods. DMCs are differentially methylated between cell types, IMCs display intermediate methylation levels in HSCs and IIH are variably methylated across individuals in HSCs. b. Bar chart illustrating the composition of the panel. c. Cell state clustering for the TBM cohort using antibodies, DNA methylation or both modalities. Colors correspond to clustering on the DNA methylation (DNAm)+AB data, see main Fig. 4b for color scheme. UMAPs were computed using data integration by scanorama across donors from the TBM cohort, using the indicated modality. d. Average protein expression levels in the different clusters, for the TBM cohort. e. UMAPs of the CD34+ cohort highlighting the surface expression of various antigens. f. Selection of static and dynamic CpGs for donor A.6, see also main Fig. 1i. g. Scatter plot depicting for all CpGs the average methylation across myeloid cells per donor, as well as the classification of the CpG as static or dynamic. h. CpGs that were classified as static in at least five donors were selected as consensus static CpG and used for the EPI-clone analysis. Source data
Extended Data Fig. 8
Extended Data Fig. 8. Characterization of human EPI-Clones.
a. Static CpG UMAPs and EPI-clone clustering result for donor B.5. Left panel highlights a CH mutation identified in this donor, right panel highlights EPI-clone clusters. b. Scatter plot displaying the percentage of cells from each EPI-Clone displaying CH mutations, for the CD34+ cohort. Dots in colors correspond to EPI-clones dominated by a CH mutation, see Fig. 4c for a color scheme. All donors from the CD34+ cohort with a detected CH mutation are shown. c. Scatter plot displaying the percentage of cells from each EPI-Clone displaying CH mutations, for NK and immature B cells. EPI-Clone was run on all cells except T and mature B cells, but the overlap was computed on NK and immature B cells only. See main Fig. 4c for color scheme. d. Static CpG UMAPs as in main Fig. 4c,d, highlighting NK and immature B cells classified according to CH status. e. Static CpG UMAP computed for all cells (including mature B and T cells) for patient A.4, highlighting T cells classified according to CH status. Mature and immature B cells are also highlighted to demonstrate that mature B and T cells mostly cluster in lymphoid clusters. Barchart depicts precision and recall for the task of classifying T cells as CH or non-CH based on EPI-Clone labels. f. Scatter plot depicting the fraction of the different cell types observed per clone, relative to the fraction of the same cell type observed in non-expanded clones from the same patient. Grey dots correspond to EPI-clones with no known driver mutation. Dots in colors correspond to EPI-clones dominated by a CH mutation, see Fig. 4c for a color scheme. g. Same as F, for cell states within the CD34+ compartment. Source data
Extended Data Fig. 9
Extended Data Fig. 9. scTAMARA-seq enables multiplexed readout out RNA, DNA methylation and genotyping amplicons from the same single cell.
a. Scheme of the method, adapted from. b. Composition of the panel used, see Supplementary Table 6. RNA-seq amplicons were selected using a scRNA-seq reference to identify the set of 120 genes with highest information on cell states in the CD34+ compartment by LASSO regression. c. Scatter plot depicting the number of RNA, DNA methylation (DNAm) and genotyping amplicons observed per cell. d. Boxplot comparing the number of features (RNA species) observed per cell in scTAMARA-seq to the number of features observed in whole transcriptome analysis (WTA) on CD34+ cells for the same 120 genes. See methods, section Data visualization for a definition of boxplot elements. e. Heatmap depicting correlation in DNA methylation profiles between sample X.1 and the other CD34+ BM donors. f. UMAPs computed on the RNA information from scTAMARA-seq highlighting cell state annotation based on RNA (left) and based on DNAm (right). g. Heatmap depicting scaled expression of marker genes for the different RNA-based cell states. Source data
Extended Data Fig. 10
Extended Data Fig. 10. Comparison of EPI-Clone and mitochondrial lineage tracing by scTAMito-seq.
a. Static CpG UMAP computed on all cells from the patient, highlighting cell types identified using surface antigen expression levels. b. Average coverage in reads per cell for the mitochondrial variants previously described for donor X.2. c. Scatter plot comparing average heteroplasmies for these mutations, as determined by mt-scATAC-seq (reference) or scTAMito-seq (this study). d. Scatter plot depicting, for all mitochondrial variants, the average heteroplasmy and the statistical association with EPI-Clone. Specifically, a linear model was trained on EPI-Clone clusters to predict heteroplasmy at the single cell level, and the p value from an F-test is shown. e. Heatmap relating the single-cell heteroplasmies of mitochondrial variants to EPI-Clones, for T cells only. The columns correspond to different T cells and the rows comprise mitochondrial mutations measured by scTAMito-seq. Source data

Update of

Similar articles

Cited by

References

    1. Sankaran, V. G., Weissman, J. S. & Zon, L. I. Cellular barcoding to decipher clonal dynamics in disease. Science378, eabm5874 (2022). - PMC - PubMed
    1. Wagner, D. E. & Klein, A. M. Lineage tracing meets single-cell omics: opportunities and challenges. Nat. Rev. Genet.21, 410–427 (2020). - PMC - PubMed
    1. Mitchell, E. et al. Clonal dynamics of haematopoiesis across the human lifespan. Nature606, 343–350 (2022). - PMC - PubMed
    1. Ludwig, L. S. et al. Lineage tracing in humans enabled by mitochondrial mutations and single-cell genomics. Cell176, 1325–1339 (2019). - PMC - PubMed
    1. Bianchi, A. et al. scTAM-seq enables targeted high-confidence analysis of DNA methylation in single cells. Genome Biol.23, 229 (2022). - PMC - PubMed

MeSH terms

LinkOut - more resources