. 2025 Jul;643(8072):855-864.
doi: 10.1038/s41586-025-09069-w. Epub 2025 May 21.

Stepwise ATP translocation into the endoplasmic reticulum by human SLC35B1

Affiliations

Stepwise ATP translocation into the endoplasmic reticulum by human SLC35B1

Ashutosh Gulati et al. Nature. 2025 Jul.

Abstract

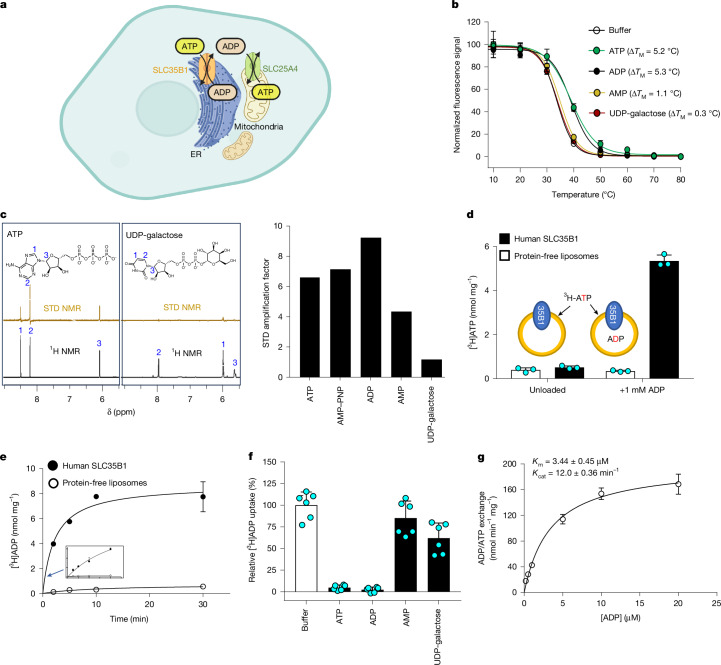
ATP generated in the mitochondria is exported by an ADP/ATP carrier of the SLC25 family1. The endoplasmic reticulum (ER) cannot synthesize ATP but must import cytoplasmic ATP to energize protein folding, quality control and trafficking2,3. It was recently proposed that a member of the nucleotide sugar transporter family, termed SLC35B1 (also known as AXER), is not a nucleotide sugar transporter but a long-sought-after ER importer of ATP4. Here we report that human SLC35B1 does not bind nucleotide sugars but indeed executes strict ATP/ADP exchange with uptake kinetics consistent with the import of ATP into crude ER microsomes. A CRISPR-Cas9 cell-line knockout demonstrated that SLC35B1 clusters with the most essential SLC transporters for cell growth, consistent with its proposed physiological function. We have further determined seven cryogenic electron microscopy structures of human SLC35B1 in complex with an Fv fragment and either bound to an ATP analogue or ADP in all major conformations of the transport cycle. We observed that nucleotides were vertically repositioned up to approximately 6.5 Å during translocation while retaining key interactions with a flexible substrate-binding site. We conclude that SLC35B1 operates by a stepwise ATP translocation mechanism, which is a previously undescribed model for substrate translocation by an SLC transporter.


Conflict of interest statement

Competing interests: G.S.-F. is co-founder and owns shares of Solgate GmbH, an SLC-focused company. The other authors declare no competing interests.

Figures

Fig. 1
Fig. 1. Biochemical characterization of human SLC35B1.
a, Schematic highlighting the proposed uptake of cytoplasmic ATP into the ER in exchange for luminal ADP by SLC35B1 and ATP exported from the mitochondria in exchange for cytoplasmic ADP by SLC25A4. b, Thermal stabilization of the purified SLC35B1–GFP in the presence of 1 mM ATP (green), ADP (black), AMP (yellow), UDP-galactose (red) or buffer (black; empty circle). Error bars represent the mean ± s.d. of three independent titrations. c, Left, comparison of ATP and UDP-galactose interactions by STD NMR (light brown) to SLC35B1 proteoliposomes and off-resonance 1H NMR spectra (black). Right, total STD amplification factor for either ATP, AMP–PNP, ADP, AMP or UDP-galactose interaction with SLC35B1. d, One-minute uptake of [3H]ATP by SLC35B1 proteoliposomes (black bars) preloaded with either a buffer or 1 mM cold ADP and compared to empty protein-free liposomes (white bars). The schematic above highlights the transport set-up. Error bars represent the mean ± s.e.m. of three independent experiments. e, Time-course uptake of [3H]ADP by SLC35B1 proteoliposomes (black circles) or empty liposomes (non-filled circles) both preloaded with 1 mM ATP. Inset: enlarged image of the uptake from 0 to 4 min to highlight the initial near-linear rates. Error bars represent the mean ± s.e.m. of three independent experiments. f, Normalized SLC35B1-mediated uptake of [3H]ADP in competition with either a buffer (white bar) or cold ATP, ADP, AMP or UDP-galactose (black bars) into proteoliposomes preloaded with cold 1 mM ATP. Error bars represent the mean ± s.e.m. of six independent experiments from two separate reconstitutions. g, [3H]ADP/ATP exchange kinetics by SLC35B1. Error bars represent the mean ± s.e.m. of three independent experiments. The Km and kcat parameters from these fits are shown. Graphic in a was created using BioRender (https://biorender.com). Source data
Fig. 2
Fig. 2. Cytoplasmic-facing cryo-EM structure of the human SLC35B1–Fv–MBP complex.
a, Left, normalized STD effect measured for ATP interaction with either wild-type (WT) SLC35B1 or SLC35B1–Fv–MBP in proteoliposomes. Right, 1-min uptake of [3H]ADP into SLC35B1, SLC35B1–Fv–MBP or empty liposomes preloaded with 1 mM ATP. b, Cartoon representation of SLC35B1 harbouring the expected DMT-fold. The overlapping V-type helices TM1–TM2 and TM8–TM9 make up one bundle (light orange) and TM3–TM4 and TM6–TM7 make up the other (teal). TM5 and TM10 (grey) are positioned peripheral to the V-type helices, which in some DMT-fold members mediate homodimerization with TM5 and TM10 of the neighbouring protomer. Access to the ER lumen is closed (obstructing helices boxed) but open to the cytoplasm. c, Top, cryo-EM maps of SLC35B1–Fv complex. Bottom, Fv forms multiple polar interactions (sticks; labelled) with the cytoplasmic loops located between TM6 and TM7 and between TM2 and TM3. d, Cartoon representation of the ER lumen cavity-closing contacts (sticks; labelled). e, Thermal stabilization of purified wild-type SLC35B1–GFP or variants of cavity-closing residues in the presence of 1 mM ATP. For comparison, the thermal shift of SLC35B1–GFP with 1 mM AMP is shown (red bar). Error bars represent the mean ± s.d. of three independent titrations. f, Total STD amplification factor after ATP addition to wild-type SLC35B1 proteoliposomes and Q113F mutant. For comparison, the STD signal of SLC35B1–GFP with 1 mM AMP is shown (red bar). Source data
Fig. 3
Fig. 3. Structure and analysis of AMP–PNP and ADP coordination.
a, Electrostatic surface representation of the cytoplasmic-facing SLC35B1(Q113F) structure in complex with AMP–PNP (sticks) highlighting the hydrophobic patch and positively charged surfaces that interact with nucleotide phosphates (red/orange sticks) and adenosine (cyan). b, Cartoon representation of SLC35B1, highlighting helices and residues (sticks) interacting with AMP–PNP. The dashed box shows an enlarged view with labelled interacting residues (dashed lines). c, Electrostatic surface representation of the cytoplasmic-facing SLC35B1 structure in complex with ADP (sticks) highlighting the hydrophobic patch and positively charged surfaces that interact with nucleotide phosphates (red/orange) and adenosine (grey). d, Comparison of SLC35B1 helices harbouring residues interacting with ADP (grey) and AMP–PNP (teal, orange and cyan) in the cytoplasmic-facing states. The dashed box shows an enlarged view, with labelled residues interacting with ADP (dashed lines). e, Mutational analysis of single time point [3H]ADP/ATP uptake into SLC35B1 proteoliposomes. Data were normalized to the absolute signal of wild-type SLC35B1. Error bars represent the mean ± s.e.m. of six independent experiments carried out from two separate reconstitutions. f, Comparison of the cytoplasmic-facing wild-type protein (bundles in orange and teal) and luminal-facing E33A variant (pink). Left, view from the cytosolic side with TM4b, TM6, TM8 and TM9 moving particularly inwards for gate closure. Right, view from the ER luminal side with TM1, TM3, TM4a and TM9 moving particularly outwards for gate opening. Source data
Fig. 4
Fig. 4. ER luminal-facing SLC35B1 ADP and AMP–PNP-bound structures and vertical substrate translocation.
a, Cartoon representation of the cytoplasmic cavity-closing contacts (sticks; labelled) for the luminal-facing SLC35B1(E33A) structure with ADP. b, Left, electrostatic surface representations of the luminal-facing SLC35B1(E33A) in complex with ADP (grey sticks). Right, as in the left panel, but with AMP–PNP (cyan sticks). Notably, the outward-facing cavity with ADP was less open than with AMP–PNP. c, Left, comparison between the cytoplasmic facing AMP-PNP bound (cyan; sticks) structure (orange and teal) with the ER luminal-facing AMP–PNP-bound (grey) structure (pink). Upon TM8–TM9 gate closure, the nucleotide was vertically displaced by approximately 6.5 Å (dark-blue arrow). Middle: cartoon highlighting helices and interacting residues (sticks; dashed lines) coordinating AMP–PNP in the luminal-facing SLC35B1(E33A). Right, as in the middle panel for ADP. d, Thermal stabilization of the SLC35B1 variants in the presence of 1 mM ATP, or 1 mM GTP (red bar). Error bars represent the mean ± s.d. of three independent titrations. e, Cartoon highlighting the gating helix TM9 pivoting around the central R276 during nucleotide translocation by comparing the cytoplasmic-facing AMP–PNP-bound (cyan; sticks) structure (orange and teal) with the ER luminal-facing AMP–PNP-bound (grey; sticks) structure (pink). TM4a–TM4b, TM5, TM6 and TM10 were omitted for clarity. f, Structural superposition of the two 5-TM structural inverted repeats in SLC35B1 (teal, orange, grey) with functionally important residues highlighted (sticks). Source data
Fig. 5
Fig. 5. Stepwise mechanism of ATP/ADP exchange by human SLC35B1 uses a rocker-switch mechanism with vertical repositioning of substrate.
a, Cartoon representation of the transport cycle depicting the rearrangements of SLC35B1 bundles (teal and orange) to import ATP into the ER in exchange for ADP. A homology model for the occluded (OC) state was constructed using the AlphaFold 2 model of the SLC35B1 homologue from Wuchereria bancrofti (AF-A0A3P7E1A7-F1-v4). AMP–PNP and ADP in the occluded state were positioned as in the experimental outward-facing (OF) states. The peripheral TM5 and TM10 helices were omitted for clarity. The insert (asterisk) illustrates that we postulated that ADP initially interacted with phosphate first from the ER luminal side but was then flipped in the binding pocket to the coordination observed by cryo-EM. IF, inward-facing. b, Hydrophobic surface representation of the AMP–PNP-bound (cyan) luminal-facing structure (above) and cytoplasmic-facing structure (below), highlighting that adenine in AMP–PNP was accommodated by a hydrophobic patch of residues in an otherwise positively charged substrate-binding site. c, Top, surface representation of cytoplasmic- and luminal-facing structures. Pink surfaces highlight that the position of the hydrophobic residues interacting with the adenine moiety was relatively closer to the cytoplasm in the inward-facing state than it was to the ER lumen in the outward-facing state, that is, the substrate-binding site was asymmetric. Bottom, as in the top panel with AMP–PNP (sticks; cyan). d, Top, in the canonical rocker-switch mechanism, the protein moves around the centrally positioned substrate (S). Bottom, in the rocker-switch mechanism seen here for SLC35B1, the substrate-binding site was asymmetric, and, as such, the substrate was vertically repositioned during substrate translocation. Graphic in a was created using BioRender (https://biorender.com).
Extended Data Fig. 1
Extended Data Fig. 1. SLC35B1 belongs to the Nucleotide-Sugar Transporter (NST) family, but transports nucleotides.
a, Phylogenetic tree depicting evolutionary relationship across all human SLC35 members. The SLC35B clade (cyan) clusters with the SLC35A clade (orange), which includes the CMP-sialic acid transporter SLC35A1. The sequences were aligned using Clustal Omega and the tree was generated using Jalview. SLC35B1 is highlighted (asterisk, boxed). b, Thermal stabilization of purified SLC35B1-GFP WT in the presence of either 1 mM ATP (white bar) or other nucleotides, UDP-galactose (black bars). Error bars are the mean ± s.d. of n = 3 independent titrations. c, FSEC traces of SLC35B1-GFP in detergent solubilised membranes (grey) and after purification (bright green). d, Saturation-transfer difference (STD) NMR spectra (red) in response to the addition of various nucleotides to SLC35B1 proteoliposomes as labelled, as well as their respective off resonance 1H spectra (black). e, Single time point (1 min) uptake of [3H]-ADP by SLC35B1 in proteoliposomes (black bars) preloaded with either 1 mM ATP or 1 mM AMP-PNP compared to protein-free liposomes (white bars). Error bars are the mean ± s.e.m of n = 3 independent experiments. f, IC50 curves for the competitive inhibition of [3H]-ADP uptake by external cold ADP (black), ATP (green), AMP (ochre), UTP (red), CTP (cyan), GTP (purple) and AMP-PNP (pink) nucleotides in SLC35B1 proteoliposomes that were preloaded with 1 mM of the respective nucleotide. Activity was normalized after subtraction of the non-specific uptake as estimated from protein-free liposomes. Error bars are the mean ± s.e.m of n = 3 or 6 (AMP-PNP) independent experiments. Source data
Extended Data Fig. 2
Extended Data Fig. 2. Phenotypic profiling of human SLC35B1 and generation of antibody fragment for structural investigation by cryo-EM.
a, Pooled transporter-focused CRISPR/Cas9 proliferation assay in HCT 116 cells. Log2-fold changes of sgRNA frequencies are plotted against the robust ranking aggregation (RRA) score as determined by MAGeCK. KO essential globular control genes (red), non-essential olfactory receptor genes (blue) and SLC transporter genes (grey). SLC35B1 is labelled (cyan). b, Structure of the cryo-EM fiducial marker Fv-MBP used for cryo-EM structural studies of human SLC35B1. c, Size exclusion chromatograph (SEC) of purified SLC35B1 mixed with Fv-MBP fusion protein at a molar ratio of 1:1.2, respectively. inset: SDS-PAGE of the first peak at 16 mL (1) and second 17 mL (2); uncropped gel is shown in Supplementary Fig. 1b. First peak corresponds to SLC35B1 in complex with Fv-MBP fusion protein and second peak is uncomplexed Fv-MBP. d, Saturation-transfer difference (STD) NMR spectrum (red) of ATP addition to the SLC35B-Fv-MBP fusion protein complex and its off-resonance 1H spectra (black) in proteoliposomes. Source data
Extended Data Fig. 3
Extended Data Fig. 3. Cryo-EM processing workflow of SLC35B1.
a, Cryo-EM datasets of SLC35B1 in GDN detergent were processed using CryoSPARC. Movie frames were aligned using the “Patch motion correction” and contrast transfer function was estimated using the “patch CTF” algorithms. Datasets were pruned using multiple rounds of 2D classifications, initial maps were generated using multiclass ab initio reconstruction and cleaned using heterogenous refinement. Final apo SLC35B1 cryo-EM maps were reconstructed from 180, 530 particles after local refinement with MBP masking, with an overall resolution of 3.37 Å resolution according to the FSC at 0.143. Volumes were rendered using ChimeraX. b, As in a, for SLC35B1 with AMP-PNP. The Fv-MBP fusion protein was masked during local refinement. The final reconstruction was obtained from 114,510 particles with an overall resolution of 3.41 Å according to the FSC at 0.143.
Extended Data Fig. 4
Extended Data Fig. 4. Cryo-EM maps and model-to-map fit of apo and AMP-PNP bound human SLC35B1 structures.
a, Modelled structure with corresponding cryo-EM maps for all transmembrane helices in SLC35B1 apo (brown). The images were rendered with a map contour level of 0.12 using ChimeraX. b, Modelled structure with corresponding cryo-EM maps for all transmembrane helices in SLC35B1 with AMP-PNP (teal). The images were rendered with a map contour level of 0.13 in ChimeraX. c, Model and corresponding density for Fv fragment as observed in the apo SLC35B1 WT structure. The figure was rendered with a map contour level of 0.12 using ChimeraX. d, left: Side-view of cartoon representation of apo (brown) and AMP-PNP bound (orange, teal and gray) SLC35B1 structures after superimposition. AMP-PNP is shown as sticks (cyan). Structures were aligned using PyMol with a Cα r.m.s.d of 1.0 Å. Both structures are in the cytoplasmic-facing conformation. right: as viewed from the cytoplasmic side. e, Cryo-EM maps for the AMP-PNP nucleotide (sticks) in WT SLC35B1 at a map contour level of 0.12 using ChimeraX, which could be built in potentially two different conformations (orange, grey) due to the circular nature of the map density.
Extended Data Fig. 5
Extended Data Fig. 5. Structural comparison of SLC35B1 apo and AMP-PNP bound states for WT and the Q113F variant.
a, STD NMR spectrum (red) in response to the addition of ATP to SLC35B1 Q113F proteoliposomes and the off resonance 1H spectrum (black). b, IC50 curves for external ATP competition of [3H]-ADP/ATP normalized transport activity by Q113F proteoliposomes. Error bars are the mean ± s.e.m of n = 6 independent experiments carried out from two separate reconstitutions. c, Mutant analysis by single time point uptake of [3H]-ADP/ATP exchange in proteoliposomes. SLC35B1 WT (white bar), empty liposomes (red bar) and mutants (black bars). Data was normalized to the absolute signal of SLC35B1 WT. Error bars are the mean ± s.e.m of n = 6 independent experiments carried out from two separate reconstitutions. d, Side view of the structural superimposition of WT SLC35B1 (orange, teal, grey) and Q113F (magenta) bound to AMP-PNP (sticks and cyan for WT, magenta for Q113F); structures were aligned using PyMol with a Cα r.m.s.d of 1.1 Å. e, Cartoon representation of the ER lumen cavity-closing contacts (sticks and labelled) for SLC35B1 WT (orange, teal, grey) and Q113F (magenta). Only minor conformational differences were observed with the introduced Q113F forming hydrophobic interactions with L105 and Y110. f, Cryo-EM map density for AMP-PNP (sticks, magenta/red) in the Q113F structure. Map contour level of 0.035 in ChimeraX. g, left: Cryo-EM map density for AMP-PNP (teal) and neighbouring residues in SLC35B1 WT (teal). middle: As in the left panel for Q113F (purple) variant with AMP-PNP (teal). right: Cryo-EM map density and structure of apo SLC35B1 WT (brown). Map contour levels of 0.12 (WT with AMP-PNP), 0.035 (Q113F with AMP-PNP), 0.10 (apo WT) in ChimeraX. h, Comparison of the nucleotide binding residues in the apo WT SLC35B1 (brown) and AMP-PNP bound Q113F (orange and teal) structures. In the absence of AMP-PNP, K277 interacts with S118 and K120 forms a salt-bridge with D183. Both S118 and D183 are also highly conserved (see Supplementary Fig. 2). Source data
Extended Data Fig. 6
Extended Data Fig. 6. Cytoplasmic-facing SLC35B1 structure with ADP and the position of AMP-PNP/ADP in the cytoplasmic-facing state clashes with predicted TM8-TM9 gate closure.
a, [3H]-ADP uptake after 2 min for SLC35B1 proteoliposomes (black bars) pre-loaded with either ADP (homo-exchange) or ATP (hetero-exchange) and empty, protein free liposomes (white bars). Error bars are the mean ± s.e.m of n = 3 independent experiments. b, IC50 curves for external ATP competition of normalized transport activity by proteoliposomes for SLC35B1 under either homo-exchange [3H]-ADP/ADP (black-filled circles) or hetero-exchange [3H]-ADP /ATP (green-filled circles) conditions. Data was fitted using the non-linear function [Inhibitor] vs normalized response function in GraphPad prism. Error bars are the mean ± s.e.m of n = 3 independent experiments. c, Density of the peripheral lipid (lavender) observed in the cryo-EM map of SLC35B1 WT with ADP (transparent light grey). d, Superimposition of the AMP-PNP bound Q113F structure (grey) with the ADP bound WT structure (cyan). Lipid density (purple transparent) matching PE (cyan sticks) was observed peripheral to TM3 and TM6 helices in the WT structure with ADP. e, Cryo-EM map density (grey mesh) for ADP (sticks) in the cytoplasmic-facing WT structure (cartoon) and surrounding residues (sticks). Map contour level of 0.13 in ChimeraX. f, Normalised SLC35B1-mediated uptake of [3H]-ADP in competition with either buffer (white-bar) or cold nucleotides (black-bars) into proteoliposomes preloaded with cold 1 mM ATP. External ATP is included from Fig. 1f as a reference point. Error bars are the mean ± s.e.m of n = 6 independent experiments from two separate reconstitutions. g, Single time point of [3H]-ADP uptake by SLC35B1 in proteoliposomes preloaded with either 1 mM ATP (white bar), CTP, UTP (black bars) or nucleotide free (red bar). Signals were normalized against uptake observed with proteoliposomes preloaded with ATP. Error bars are the mean ± s.e.m of n = 6 independent experiments carried out from two separate reconstitutions. h, left: Cytoplasmic view of the structural superimposition of the cytoplasmic-facing AMP-PNP (cyan sticks) bound SLC35B1 structure (orange, teal and grey) with the occluded CMP-Sialic acid SLC35A1 (structure PDB: 6OH2, transparent pink). right: As in the left panel as viewed from the side. If the cytoplasmic-facing SLC35B1 protein would adopt a similar occluded conformation as SLC35A1, then the inward movement of TM8-TM9 gating helices (white arrow) would physically clash with the bound nucleotide. Source data
Extended Data Fig. 7
Extended Data Fig. 7. ER luminal-facing SLC35B1 structures and nucleotide recognition probed by mutagenesis and thermal-shift analysis.
a, STD NMR spectrum (red) in response to the addition of ATP to SLC35B1 E33A proteoliposomes and the off resonance 1H spectrum (black). b, IC50 curves for external ATP competition of [3H]-ADP/ATP normalized transport activity by E33A proteoliposomes. Error bars are the mean ± s.e.m of n = 6 independent experiments carried out from two separate reconstitutions. c, Cryo-EM map density (grey mesh) for AMP-PNP (blue sticks) in the luminal-facing state E33A structure (cartoon). Map contour level of 0.025 in ChimeraX. d, Cryo-EM map density (grey mesh) for ADP (mustard sticks) in the luminal-facing state E33A structure (mustard). Map contour level 0.029 in ChimeraX. e, Concentration dependent thermostabilization of purified SLC35B1 with ATP (black-filled circles) and AMP (white circles). The y-axis represents the relative fluorescent signal (see Methods) and dotted line highlights that the maximal stabilization was observed at 1 mM ATP. Error bars are the mean ± s.e.m of n = 6 independent experiments. f, Concentration dependent ATP thermostabilization of WT (black-filled circles) as shown in e, versus K117A (ochre circles) and K120A (red circles). Error bars are the mean ± s.e.m of n = 6 independent experiments. g, Concentration dependent ATP thermostabilization of WT (black-filled circles) as shown in e., vs R276A (ochre circles) and K277A (red circles). The WT is shown as a reference, as in panel e. Error bars are the mean ± s.e.m of n = 6 independent experiments. h, Concentration dependent ATP thermostabilization of WT (black-filled circles) as shown in e, versus I257E (ochre circles), V261T (red circles) and C269A (pink circles). Error bars are the mean ± s.e.m of n = 6 independent experiments. Source data
Extended Data Fig. 8
Extended Data Fig. 8. Gating helices and the peripheral ADP binding site in the cytoplasmic-facing E33A variant structure.
a, Structural superimposition of cytoplasmic facing WT with ADP and the occluded CMP-Sialic acid (SLC35A1) transporter structure (PDB 6OH2), as viewed from the cytoplasm. b, Structural superimposition of ER luminal-facing E33A variant with AMP-PNP and the occluded CMP-Sialic acid (SLC35A1) transporter structure (PDB 6OH2), as viewed from the ER lumen. c, Structural superimposition of cytoplasmic facing WT with ADP, the occluded CMP-Sialic acid (SLC35A1) transporter structure (PDB 6OH2) and an occluded model of human SLC35B1 based on an AF2 worm model (Wuchereria bancrofti: AF-A0A3P7E1A7-F1-v4), as viewed from the ER lumen. d, Cryo-EM map density (grey mesh) for ADP (brown sticks) in the cytoplasmic-facing state E33A structure (cartoon). Map contour level of 0.028 in ChimeraX. e, Structural superimposition of the AMP-PNP (grey sticks) bound cytoplasmic-facing SLC35B1 WT (grey cartoon) and ADP (brown sticks) bound cytoplasmic-facing E33A variant (cartoon, orange and teal). The ADP nucleotide was observed closer to the cytoplasm in the structure of the E33A variant, which could represent the substrate-bound state prior to exiting. Dashed-box for zoomed in view, with the few ADP interacting residues (dashed lines) labelled. f, Comparison between the luminal-facing E33A variant structure (pink) with ADP (pink sticks) and the cytoplasmic-facing E33A variant structure (orange, teal) with ADP (brown/red sticks). Upon ER luminal gate closure (top black arrow), substrate is vertically displaced by ~12 Å (blue arrow). g, Comparison of the cytoplasmic-facing WT-apo (light blue), WT-ADP (salmon) and Q113F-AMP-PNP (grey) structures with the ADP bound (brown sticks) cytoplasmic-facing E33A variant structure (orange, teal) adopting a more open conformation. h, Electrostatic surface representations of the luminal-facing yeast GDP-mannose transporter Vrg4 (PDB: 5OGK) structure bound to GDP-mannose (pink), which adopts a more tilted position than AMP-PNP (grey) in the luminal-facing SLC35B1-E33A structure. i, A view of the electrostatic surface of the AMP-PNP bound E33A structure as viewed from the luminal side. The cavity is lined by positively charged residue on one side and hydrophobic residues on the other, which we propose would allow for flipping of the greasy adenine after interacting phosphate first from the ER luminal side.

References

    1. Ruprecht, J. J. & Kunji, E. R. S. The SLC25 mitochondrial carrier family: structure and mechanism. Trends Biochem. Sci.45, 244–258 (2020). - PMC - PubMed
    1. Hirschberg, C. B., Robbins, P. W. & Abeijon, C. Transporters of nucleotide sugars, ATP, and nucleotide sulfate in the endoplasmic reticulum and Golgi apparatus. Annu. Rev. Biochem.67, 49–69 (1998). - PubMed
    1. Depaoli, M. R., Hay, J. C., Graier, W. F. & Malli, R. The enigmatic ATP supply of the endoplasmic reticulum. Biol. Rev. Camb. Philos. Soc.94, 610–628 (2019). - PMC - PubMed
    1. Klein, M. C. et al. AXER is an ATP/ADP exchanger in the membrane of the endoplasmic reticulum. Nat. Commun.9, 3489 (2018). - PMC - PubMed
    1. Mayinger, P. & Meyer, D. I. An ATP transporter is required for protein translocation into the yeast endoplasmic reticulum. EMBO J.12, 659–666 (1993). - PMC - PubMed

MeSH terms

Substances

LinkOut - more resources