. 2025 Jun;642(8068):785-795.
doi: 10.1038/s41586-025-08986-0. Epub 2025 May 21.

Multigenerational cell tracking of DNA replication and heritable DNA damage

Affiliations

Multigenerational cell tracking of DNA replication and heritable DNA damage

Andreas Panagopoulos et al. Nature. 2025 Jun.

Abstract

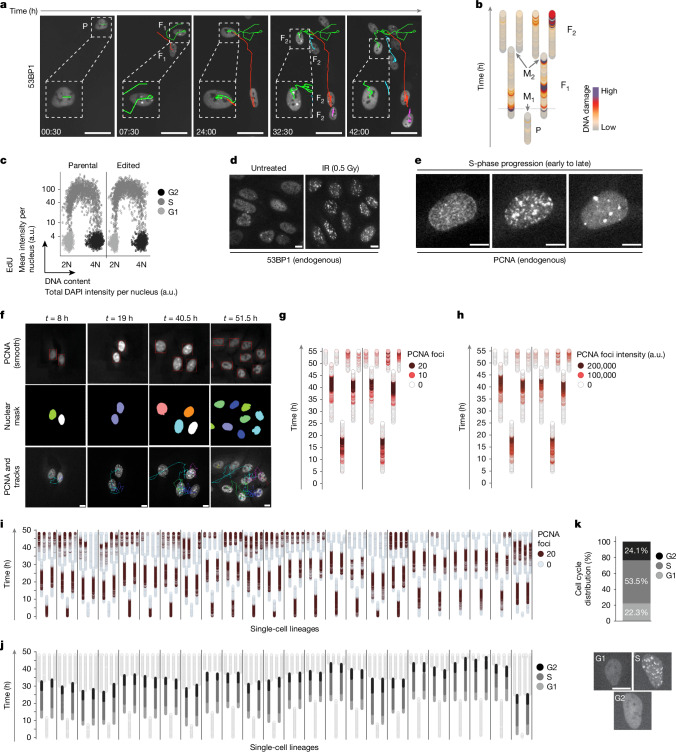
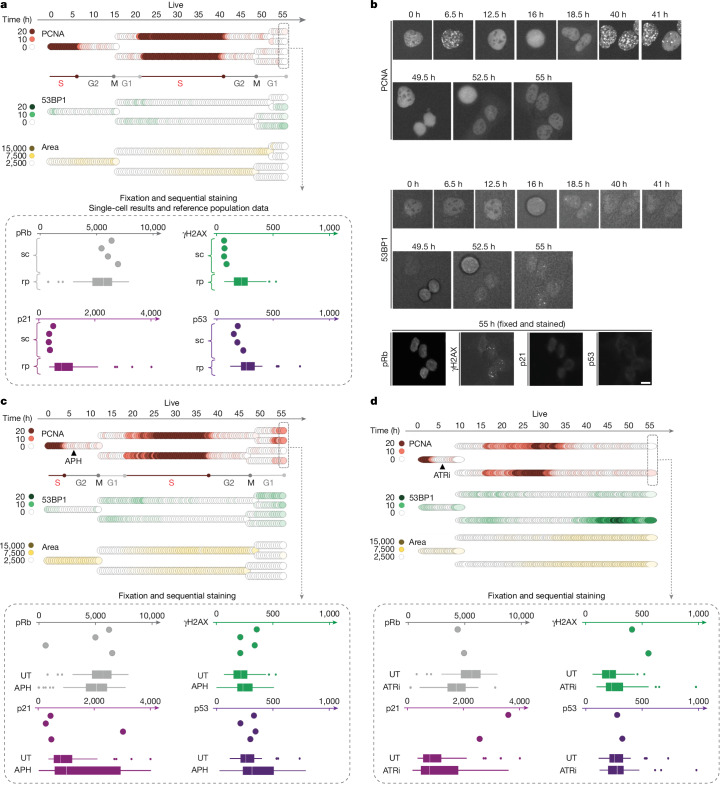
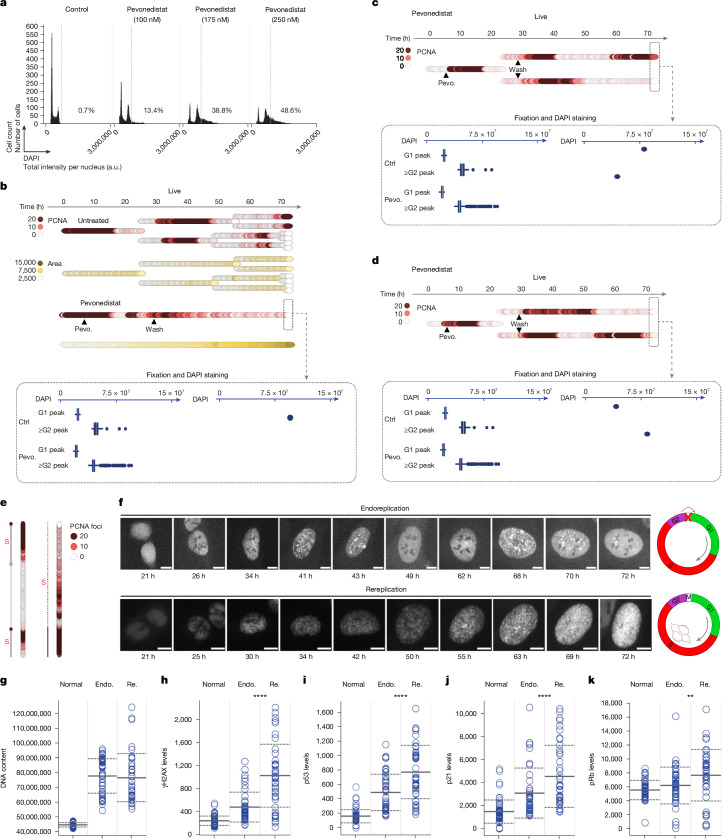
Cell heterogeneity is a universal feature of life. Although biological processes affected by cell-to-cell variation are manifold, from developmental plasticity to tumour heterogeneity and differential drug responses, the sources of cell heterogeneity remain largely unclear1,2. Mutational and epigenetic signatures from cancer (epi)genomics are powerful for deducing processes that shaped cancer genome evolution3-5. However, retrospective analyses face difficulties in resolving how cellular heterogeneity emerges and is propagated to subsequent cell generations. Here, we used multigenerational single-cell tracking based on endogenously labelled proteins and custom-designed computational tools to elucidate how oncogenic perturbations induce sister cell asymmetry and phenotypic heterogeneity. Dual CRISPR-based genome editing enabled simultaneous tracking of DNA replication patterns and heritable endogenous DNA lesions. Cell lineage trees of up to four generations were tracked in asynchronously growing cells, and time-resolved lineage analyses were combined with end-point measurements of cell cycle and DNA damage markers through iterative staining. Besides revealing replication and repair dynamics, damage inheritance and emergence of sister cell heterogeneity across multiple cell generations, through combination with single-cell transcriptomics, we delineate how common oncogenic events trigger multiple routes towards polyploidization with distinct outcomes for genome integrity. Our study provides a framework to dissect phenotypic plasticity at the single-cell level and sheds light onto cellular processes that may resemble early events during cancer development.


Conflict of interest statement

Competing interests: The authors declare no competing interests.

Figures

Fig. 1
Fig. 1. Quantitative cell-cycle-resolved single-cell tracking based on endogenous markers.
a, Representative images from time-lapse microscopy with multigenerational cell tracking of mEGFP–53BP1 U-2 OS cells. The daughter cell generation (F1) and granddaughter cell generation (F2) generations with 53BP1 foci after cell division are highlighted. Scale bars, 50 µm. b, Example cell lineage depicting lineage relationships and DNA damage marked by 53BP1. P, parental cell generation; M1, first mitosis; M2, second mitosis. Time-lapse microscopy for 65 h at 30 min intervals. c, High-content-microscopy-derived EdU profiles of the parental and the edited 53BP1–PCNA U-2 OS cell line. a.u., arbitrary units. d, Representative images of endogenously tagged 53BP1 from 53BP1–PCNA U-2 OS cells treated as indicated and fixed after 45 min. Scale bars, 10 µm. e, Representative images from 53BP1–PCNA U-2 OS cells depicting endogenous PCNA patterns during S phase. Scale bars, 10 µm. f, Representative images of the cell-tracking procedure, depicting the smoothened endogenous PCNA signal for nuclei segmentation, the nuclear mask and the single-cell tracks applied on the non-smoothened PCNA signal. Scale bars, 10 µm. g, Single-cell lineages of the cells depicted in f. Endogenous PCNA patterns are depicted according to the colour code indicated. h, The same single-cell lineages as in g, with endogenous PCNA foci intensities depicted according to the colour code indicated. i, Single-cell lineages from endogenously tagged 53BP1–PCNA U-2 OS cells. PCNA foci are depicted according to the colour code indicated. j, The same single-cell lineages as in i, with cell cycle phase of the F1 generation, based on the endogenous PCNA signals, depicted according to the colour code indicated (G1, S, G2). k, The cell cycle distribution derived from the time spent in G1, S and G2 according to the endogenous PCNA foci pattern of the single-cell lineages shown in i and j. Representative single-cell images are shown below. Scale bar, 10 µm.
Fig. 2
Fig. 2. Enhanced sister cell heterogeneity after replication stress.
a, A representative single-cell lineage from untreated 53BP1–PCNA U-2 OS cells. PCNA foci, 53BP1 foci and the area of the nucleus over 55 h of live imaging are shown. Sequential staining intensities from individual cells of the lineage (sc) and the mean intensities from the reference population (rp) are depicted for the markers pRb, γH2AX, p21 and p53. b, Representative video stills from the single-cell lineage in a and corresponding images from the sequential staining of cells for pRb, γH2AX, p21 and p53. Scale bar, 10 µm. c, Single-cell lineage from 53BP1–PCNA U-2 OS cells treated with 0.2 µM APH during the G2 phase of the cell cycle. PCNA foci, 53BP1 foci and area of the nucleus over 55 h of live imaging are shown. Sequential staining intensities from individual cells of the lineage and mean intensities from the corresponding reference populations are shown. UT, untreated. d, Single-cell lineage from 53BP1–PCNA U-2 OS cells treated with 1 µM of ATRi during the G2 phase of the cell cycle. PCNA foci, 53BP1 foci and the area of the nucleus over 55 h of live imaging are shown. Sequential staining intensities from individual cells of the lineage and mean intensities from the corresponding reference populations are shown. For the box plots, the box limits show the interquartile range (IQR, 25th percentile (Q1) to 75th percentile (Q3)), the median (centre line) and the whiskers define the lower and upper adjacent value; the dots show outliers smaller than Q1 − 1.5 × IQR and greater than Q3 + 1.5 × IQR; n > 35 end-point measurements per sample. Drugs in c and d were removed after 24 h.
Fig. 3
Fig. 3. DNA-damage-induced transcriptional and phenotypic heterogeneity.
a, Volcano plot showing differentially expressed genes in U-2 OS cells 24 h after IR, derived from bulk RNA-seq analysis. b, Residual variability of gene expression after a linear fit of the log2-transformed s.d. to the log2-transformed mean expression in U-2 OS cells 48 h after IR from scRNA-seq analysis. Positive residual values indicate a higher s.d. than expected. Genes of the DNA damage response pathway (GO: 0006974) are highlighted by closed circles. P = 2.45 × 10−12; odds ratio = 1.90 (Fisher’s exact test on genes with residuals > 0.5 versus genes with residuals ≤ 0.5). c, GO analysis of genes with specifically increased residuals (>0.5) after IR treatment. BP, biological process. d, U-2 OS cells were treated with the indicated doses of IR and fixed 45 min later for 53BP1 foci analysis by QIBC. The G1 populations were selected based on DAPI and EdU and categorized on the basis of the nuclear 53BP1 levels. The IR-induced 53BP1 foci formation in G1 cells was then analysed as a function of IR dose and 53BP1 expression. The horizontal solid lines represent the mean and the horizontal dashed lines represent s.d. e, Single-cell lineage from 53BP1–PCNA U-2 OS cells treated with 4 Gy IR as indicated. Nuclear 53BP1 levels (a.u.) (left) and 53BP1 foci formation (right) are depicted by the colour code. f, U-2 OS cells were treated as indicated (1 µM ATRi; 4 Gy IR) and γH2AX and 53BP1 foci in G1 cells were analysed by QIBC. Example images are shown to the right. Scale bar, 10 µm. Statistical analysis by one-way ANOVA followed by Tukey’s post hoc test. **P ≤ 0.01, ****P ≤ 0.0001. Source data
Fig. 4
Fig. 4. Live+QIBC reveals two distinct routes towards polyploidization.
a, High-content-microscopy-derived cell cycle profiles of U-2 OS cells treated with increasing doses of pevonedistat (pevo.; MLN4924) for 24 h and released into fresh medium for 42 h. The percentage of hyperploid cells (>4N DNA content, marked by the dashed vertical line) is indicated. b, A single-cell lineage from 53BP1–PCNA U-2 OS control cells and cells treated with 175 nM of pevonedistat. The total DAPI intensity of the nucleus from the corresponding reference populations (ctrl) is depicted as well as from the pevonedistat-treated single cell at the end of live imaging. c, A single-cell lineage from 53BP1–PCNA U-2 OS cells treated with 175 nM of pevonedistat. The total DAPI intensity of the nucleus from the corresponding reference populations is depicted as well as from the pevonedistat-treated single cells at the end of live imaging. d, A second example of a single cell lineage from 53BP1–PCNA U-2 OS cells (details as in c). e, Representative single-cell analyses of the PCNA patterns of cells that undergo endoreplication or rereplication, respectively. f, Representative video stills of 53BP1–PCNA U-2 OS cells undergoing either endoreplication or rereplication after being treated with pevonedistat. PCNA patterns are depicted. Schematics depicting differences between endoreplication and rereplication are shown on the right. Scale bars, 10 µm. g, The total DAPI intensity (a.u.) of normal G2 cells and cells that underwent either endoreplication (endo.) or rereplication (re.) after being treated with pevonedistat. h, The mean nuclear intensity of γH2AX of normal G2 cells and cells that underwent either endoreplication or rereplication after being treated with pevonedistat. i, As in h for p53 intensity. j, As in h, but for p21 intensity. k, As in h, but for pRb intensity. Statistical analysis was performed using two-tailed unpaired t-tests between endoreplicating and rereplicating cells. The horizontal solid lines represent the mean and horizontal dashed lines represent s.d. The box plots in bd show the IQR (box limits), with median (centre line) and the whiskers define the lower and upper adjacent value; dots show outliers greater than Q3 + 1.5 × IQR. Source data
Fig. 5
Fig. 5. Oncogene overexpression induces two distinct routes towards polyploidization.
a, Single-cell lineage from 53BP1–PCNA U-2 OS cells overexpressing HRAS. PCNA foci, 53BP1 foci and area of the nucleus over 70 h of live imaging are depicted. Sequential staining intensities from individual cells of the lineage and mean intensities from the corresponding reference populations are depicted for the markers pRb, γH2AX, p21 and p53. The total DAPI intensity per nucleus from the corresponding reference populations is depicted as well as from the single cells at the end of live imaging. Representative images of the polyploid cells are included as well as their position within the DAPI scatter plot of the G1 and G2 populations. Scale bars, 10 µm. The box plots show the IQR (box limits), with median (centre line) and the whiskers define the lower and upper adjacent value; dots show outliers greater than Q3 + 1.5 × IQR. Avg., average. b, t-Distributed stochastic neighbour embedding analysis of scRNA-seq results. 2N–4N, cells with 2N–4N DNA content; polyploid, cells with a DNA content >4N; pevo., pevonedistat-treated; HRAS, HRAS-overexpressing cells. n > 300 cells per condition. c, Subclustering of the HRAS polyploid sample with a Louvain resolution of 0.5. d, GO analysis of the top 28 genes from the overlap between HRAS polyploid and pevonedistat polyploid subclusters. FDR < 0.00001, P < 0.00001, FC > 4. e, STRING functional protein association network analysis of the top 28 genes. f, Cell-cycle-resolved nuclear cyclin A levels in U-2 OS cells either untreated or treated with 175 nM of pevonedistat for 24 h and then released into fresh medium for 42 h. g, The cellular behaviour towards polyploidy from live imaging experiments of 53BP1–PCNA U-2 OS cells treated with 175 nM of pevonedistat, 20 μM of etoposide or 5 μM of RO3306 for 24 h and then released for 42 h. Mean and individual values are depicted from two biological replicates based on live imaging data. Source data
Extended Data Fig. 1
Extended Data Fig. 1. CRISPR-engineered cell lines and multigenerational cell tracking.
(a) Representative live imaging stills with the nuclear detection mask and the multigenerational single cell tracks from GFP-H2B U-2 OS cells. Scale bar, 50 µm. (b) Schematic representation of the strategy for tagging the endogenous PCNA gene locus at the last exon in U-2 OS cells. (c) Gel electrophoresis of the PCR products of the PCNA locus from the parental and the edited U-2 OS cell line. The arrowhead points to the band indicative of correct targeting. (d) Cell cycle phase distribution of the parental and the edited U-2 OS cell line based on DAPI and EdU. (e) Cell cycle resolved γH2AX mean intensity scatter plots of the parental and the edited 53BP1-PCNA U-2 OS cells either untreated or IR-treated (4 Gy, 2 h recovery). (f) Cell cycle resolved Cyclin A mean intensity scatter plots of the parental and the edited 53BP1-PCNA U-2 OS cells either untreated or IR-treated (4 Gy, 2 h recovery). (g) High-content microscopy derived cell cycle profiles of 53BP1-PCNA U-2 OS cells subjected or not to timelapse microscopy for 28 h at 30 min intervals. (h) Cell cycle resolved EdU mean intensity scatter plots of 53BP1-PCNA U-2 OS cells subjected or not to timelapse microscopy for 28 h at 30 min intervals. (i) Cell cycle resolved γH2AX mean intensity scatter plots of 53BP1-PCNA U-2 OS cells subjected or not to timelapse microscopy for 28 h at 30 min intervals.
Extended Data Fig. 2
Extended Data Fig. 2. Validation of CRISPR-engineered 53BP1-PCNA U-2 OS cells.
(a) 53BP1-PCNA U-2 OS cells were treated with siRNA for 72 h and IR (4 Gy, 2 h) as indicated and stained for 53BP1 (Cy5). The endogenous 53BP1-mScarlet and antibody-based signals are shown, together with their segmentation masks. Scale bar, 10 µm. (b) High-content microscopy-based quantification of 53BP1-mScarlet foci using the samples and foci segmentation mask from (a). Statistical analysis by one-way ANOVA followed by Tukey’s post hoc test. (c) Video stills of 53BP1-PCNA U-2 OS cells at different cell cycle phases from G1 through S-phase and to G2. PCNA-mEmerald patterns and their segmentation are shown. Scale bar, 10 µm. (d) DAPI- and EdU-based cell cycle gating of 53BP1-PCNA U-2 OS cells and PCNA foci analysis in different cell cycle phases (colour-coded based on DAPI and EdU). (e) PCNA foci quantification from (d) in G1 versus S-phase versus G2 (based on DAPI and EdU). Statistical analysis by one-way ANOVA followed by Tukey’s post hoc test. Source data
Extended Data Fig. 3
Extended Data Fig. 3. Single cell lineages after replication stress.
(a) Schematic representation of in silico single cell lineage sorting. (b) In silico sorted single cell lineages from untreated 53BP1-PCNA U-2 OS cells imaged for 30 h. Single cell lineages colour-coded for PCNA patterns (top) and 53BP1 foci (bottom) are shown. (c) Representative image stills from a single cell lineage from (b) depicting PCNA patterns and 53BP1 localization at the timepoints indicated. Scale bars, 10 µm. (d) Western blot analysis of DNA damage markers in untreated U-2 OS cells or U-2 OS cells treated with 0.2 μM APH or 1 μM ATRi for 24 h. (e) In silico sorted single cell lineages from 53BP1-PCNA U-2 OS cells imaged for 30 h. Cells were treated with 0.2 μM APH 4.5 h after the beginning of acquisition. Single cell lineages colour-coded for PCNA patterns (top) and 53BP1 foci (bottom) are shown. (f) Representative image stills from a single cell lineage from (e) depicting PCNA patterns and 53BP1 localization at the timepoints indicated. Scale bars, 10 µm. (g) In silico sorted single cell lineages from 53BP1-PCNA U-2 OS cells imaged for 30 h. Cells were treated with 1 μM ATRi 4.5 h after the beginning of acquisition. Single cell lineages colour-coded for PCNA patterns (top) and 53BP1 foci (bottom) are shown. (h) Representative image stills from a single cell lineage from (g) depicting PCNA patterns and 53BP1 localization at the timepoints indicated. Scale bars, 10 µm. For gel source data, see Supplementary Fig. 1.
Extended Data Fig. 4
Extended Data Fig. 4. Sequential stainings post multigenerational live cell imaging.
(a) Schematic representation of the Live+QIBC image analysis pipeline. E, antibody elution; S, staining. (b) Representative images of sequential staining and antibody elution steps in the Live+QIBC image analysis pipeline with 53BP1-PCNA U-2 OS cells. Scale bar, 10 µm. (c, d) Scatter plots and representative images of control cells or cells undergoing replication stress sequentially stained for phospho-Rb and p21 in the same colour channel. The total DAPI intensity per nucleus indicates DNA content, with 2 N (G1) on the left and 4 N (G2) on the right. Scale bars, 10 µm. (e) Direct comparison of the pRb signals and the p21 signals after antibody elution and re-staining. (f) Cell cycle resolved scatter plots of γΗ2ΑΧ mean intensities from untreated U-2 OS cells or U-2 OS cells treated with 0.2 µM aphidicolin or 1 µM ATR inhibitor for 48 h. (g) Cell cycle resolved scatter plots of pRb mean intensities from untreated U-2 OS cells or U-2 OS cells treated with 0.2 µM aphidicolin or 1 µM ATR inhibitor for 48 h. (h) Cell cycle resolved scatter plots of p53 mean intensities from untreated U-2 OS cells or U-2 OS cells treated with 0.2 µM aphidicolin or 1 µM ATR inhibitor for 48 h. (i) Cell cycle resolved scatter plots of p21 mean intensities from untreated U-2 OS cells or U-2 OS cells treated with 0.2 µM aphidicolin or 1 µM ATR inhibitor for 48 h. (j) Heatmaps of cell cycle resolved analysis of asynchronous U-2 OS cell populations treated as indicated for 24 h with 0.2 μM APH, 1 μM ATRi, or with IR (1 Gy and 4 Gy) followed by recovery for 24 h. Cells were sequentially stained for multiple DNA damage and cell cycle markers. Nuclear intensities (in the case of 53BP1 accumulated foci intensities) per cell and morphological features are indicated by colour-code. Note that the colour-code was deliberately reversed for pRb.
Extended Data Fig. 5
Extended Data Fig. 5. Single cell tracks from cells treated with replication stress inducing agents.
(a) Single cell lineage from 53BP1-PCNA U-2 OS cells treated with 0.2 µM aphidicolin during the S phase of the cell cycle. PCNA foci, 53BP1 foci and area of the nucleus over 55 h of live imaging are depicted. Sequential staining intensities from individual cells of the lineage and mean intensities from corresponding reference populations are depicted for the markers pRB, γH2AX, p21 and p53. (b) Single cell lineage from 53BP1-PCNA U-2 OS cells treated with 1 µM ATR inhibitor during the S phase of the cell cycle. PCNA foci, 53BP1 foci and area of the nucleus over 55 h of live imaging are depicted. Sequential staining intensities from individual cells of the lineage and mean intensities from corresponding reference populations are depicted for the markers pRB, γH2AX, p21 and p53. (c) Single cell lineage from 53BP1-PCNA U-2 OS cells treated with 0.2 µM aphidicolin during the G1 phase of the cell cycle. PCNA foci, 53BP1 foci and area of the nucleus over 55 h of live imaging are depicted. Sequential staining intensities from individual cells of the lineage and mean intensities from corresponding reference populations are depicted for the markers pRB, γH2AX, p21 and p53. (d) Single cell lineage from 53BP1-PCNA U-2 OS cells treated with 1 µM ATR inhibitor during the G1 phase of the cell cycle. PCNA foci, 53BP1 foci and area of the nucleus over 55 h of live imaging are depicted. Sequential staining intensities from individual cells of the lineage and mean intensities from corresponding reference populations are depicted for the markers pRB, γH2AX, p21 and p53. Drugs in (a-d) were removed after 24 h. (e) Sister cell heterogeneity analysis of 53BP1-PCNA U-2 OS cells treated either with 0.2 µM aphidicolin or with 1 µM ATR inhibitor. Heterogeneity was scored for 53BP1 foci between sister cells of the F1 generation in G1 phase, whereas γΗ2ΑΧ, p53 and p21 levels were scored at the end of 55 h of live imaging. Statistical analysis by Chi-Square test. Box plot limits indicate 25th percentile (Q1) and 75th percentile (Q3); boxes represent interquartile range (IQR, Q3-Q1) with medians (solid lines). Whiskers define lower and upper adjacent value; dots show outliers smaller than Q1 - 1.5 × IQR and greater than Q3 + 1.5 × IQR. Source data
Extended Data Fig. 6
Extended Data Fig. 6. Validation of CRISPR-engineered 53BP1-PCNA RPE-1 cells.
(a) 53BP1-PCNA RPE-1 cells were treated with siRNA for 72 h and IR (4 Gy, 2 h) as indicated and stained for 53BP1 (Cy5). The endogenous 53BP1-mScarlet and antibody-based signals are shown, together with their segmentation masks. Scale bar, 10 µm. (b) High-content microscopy-based quantification of 53BP1-mScarlet foci using the samples and foci segmentation mask from (a). Statistical analysis by one-way ANOVA followed by Tukey’s post hoc test. (c) Video stills of 53BP1-PCNA RPE-1 cells at different cell cycle phases from G1 through S-phase and to G2. PCNA-mEmerald patterns and their segmentation are shown. Scale bar, 10 µm. (d) DAPI- and EdU-based cell cycle gating of 53BP1-PCNA RPE-1 cells and PCNA foci analysis in different cell cycle phases (colour-coded based on DAPI and EdU). (e) PCNA foci quantification from (d) in G1 versus S-phase versus G2 (based on DAPI and EdU). Statistical analysis by one-way ANOVA followed by Tukey’s post hoc test. (f) Cell cycle resolved scatter plots of γΗ2ΑΧ mean intensities from untreated RPE-1 cells or RPE-1 cells treated with 0.2 µM aphidicolin or 1 µM ATR inhibitor for 48 h. (g) Cell cycle resolved scatter plots of pRb mean intensities from untreated RPE-1 cells or RPE-1 cells treated with 0.2 µM aphidicolin or 1 µM ATR inhibitor for 48 h. (h) Cell cycle resolved scatter plots of p53 mean intensities from untreated RPE-1 cells or RPE-1 cells treated with 0.2 µM aphidicolin or 1 µM ATR inhibitor for 48 h. (i) Cell cycle resolved scatter plots of p21 mean intensities from untreated RPE-1 cells or RPE-1 cells treated with 0.2 µM aphidicolin or 1 µM ATR inhibitor for 48 h. (j) Western blot analysis of phospho-KAP1 in untreated RPE-1 cells or RPE-1 cells treated with 0.2 μM APH or 1 μM ATRi for 24 h. For gel source data, see Supplementary Fig. 1. Source data
Extended Data Fig. 7
Extended Data Fig. 7. DNA damage-induced transcriptional heterogeneity.
(a) Heatmap of the top 100 differentially expressed (DE) genes ranked by adjusted p-value upon IR treatment (4 Gy, 24 h) from bulk RNA-seq. (b) Gene ontology (GO) analysis of up-regulated DE genes upon IR treatment from bulk RNA-seq. (c) Example boxplots of DE genes after IR-induced DNA damage from bulk RNA-seq, including the CDK inhibitor and cell cycle regulator CDKN1A (p21), the pro-apoptotic cell death receptor FAS, the growth arrest and DNA damage-inducible protein GADD45A, and the p53 target gene and p53 regulator MDM2. TP53BP1 (53BP1) is shown as a control gene, the expression of which was not upregulated after IR. (d) Violin plots showing gene expression changes from scRNA-seq of the same genes depicted in (c). (e) Validation of the observed gene expression changes in a second set of cell samples subjected independently to scRNA-seq. (f) Heatmap of the top 10 marker genes identified from unsupervised clustering analysis of the scRNA-seq data from untreated and IR treated cells. (g) UMAPs (uniform manifold approximation and projection) of the scRNA-seq data colour-coded by the clusters identified in (f) and split by condition (UT, IR). (h) GO pathway enrichment in the single cell clusters identified in (f), excluding the smallest cluster k6, which did not yield any significantly enriched GO term. (i) Standard deviation (SD) versus Mean analysis of the scRNA-seq data. DNA damage response genes (GO: 0006974) highlighted in orange.
Extended Data Fig. 8
Extended Data Fig. 8. DNA damage in G1 generates heritable lesions associated with sister cell asymmetry in the next cell generation.
(a, b) Single cell lineages from 53BP1-PCNA U-2 OS cells treated with 4 Gy IR during the G1 phase of the cell cycle. (c) QIBC-derived scatter plot of IR-induced 53BP1 foci in the next G1 phase. U-2 OS cells were pulsed with 10 µM EdU for 20 min before irradiation (4 Gy) and then allowed to cycle in the presence of 10 µM BrdU for 48 h to overcome the G2/M checkpoint. DNA was denatured for BrdU detection and cycled G1 cells negative for EdU and positive for BrdU were analysed. Horizontal solid lines represent the mean and horizontal dashed lines represent standard deviation. Example images are shown on the right. Scale bar, 10 µm. Statistical analysis by two-tailed unpaired t-test. (d) Endonuclease-induced DSBs in 53BP1-GFP DIvA-AID U-2 OS cells. AsiSI was induced by 4-OHT (300 nM) for 4 h, followed by fixation or release into medium without 4-OHT and containing auxin (IAA) (500 µM) for 20 h. 53BP1-GFP foci were analysed by QIBC. Statistical analysis by one-way ANOVA followed by Tukey’s post hoc test. (e) In the same cells as in (d), γH2AX foci were analysed by QIBC. Statistical analysis by one-way ANOVA followed by Tukey’s post hoc test. (f) Single cell lineages from 53BP1-GFP DIvA-AID U-2 OS cells treated with 4-OHT (300 nM) and IAA (500 µM) as indicated. 53BP1-GFP foci formation is depicted by the colour code. M, mitosis. (g) As in (c), 53BP1 foci in cycled G1 53BP1-GFP DIvA-AID U-2 OS cells after transient AsiSI induction (4-OHT for 4 h, followed by release into medium with auxin (IAA) and without 4-OHT for 44 h). Statistical analysis by two-tailed unpaired t-test. (h) As in (c), 53BP1 foci in cycled G1 RPE-1 cells (p53 WT and p53 KO) after IR (4 Gy). Statistical analysis by one-way ANOVA followed by Tukey’s post hoc test. (i) Sister cell heterogeneity in 53BP1-PCNA U-2 OS cells treated with IR (4 Gy) in G1. Heterogeneity was scored for 53BP1 foci between sister cells of the F1 generation in G1 phase, whereas p53, γH2AX and pRB levels were scored at the end of 55 h of live imaging. Statistical analysis by Chi-square test. (j) Single cell lineage of daughter cells irradiated with IR (4 Gy). Two rounds of replication associated with an increase in nuclear area can be seen for one of the two daughter cells. Source data
Extended Data Fig. 9
Extended Data Fig. 9. Polyploidization after treatment with Pevonedistat or depletion of Geminin.
(a) Cell cycle resolved scatter plots of DNA content and area of the nucleus of cells shown in Fig. 4a. Hyperploid cells (> 4 N DNA content, marked by the dashed vertical line) are coloured in red. (b) Representative images of 53BP1-PCNA U-2 OS cells either untreated or treated with 175 nM of Pevonedistat for 24 h and allowed to recover for 42 h. Scale bar, 10 µm. (c) DNA fibre analysis of U-2 OS cells either untreated or treated with 175 nM of Pevonedistat for 24 h and then allowed to recover for 42 h. Statistical analysis by two-tailed unpaired t-test. (d) High-content microscopy derived cell cycle profiles of HCT 116 cells treated with 250 nM of Pevonedistat for 24 h. The percentage of hyperploid cells (> 4 N DNA content, marked by the dashed vertical line) is indicated. (e) High-content microscopy derived cell cycle profiles of RPE-1 cells treated with 175 nM of Pevonedistat for 24 h and then released into fresh medium for 42 h. The percentage of hyperploid cells (> 4 N DNA content, marked by the dashed vertical line) is indicated. (f) Representative single cell lineages depicting endoreplication after Pevonedistat exposure. (g) Representative single cell lineages depicting re-replication after Pevonedistat exposure. (h) Bar chart depicting the frequency of endo- and re-replication in 53BP1-PCNA U-2 OS cells treated either in G1 or S phase with 175 nM of Pevonedistat for 24 h and then released for 42 h. Mean ± SD are depicted. (i) Single cell lineage depicting endoreplication from live imaging of 53BP1-PCNA RPE-1 cells that were treated with Pevonedistat for 48 h. PCNA patterns and 53BP1 foci are shown. Scale bar, 10 µm. (j) Single cell lineage depicting re-replication from live imaging of 53BP1-PCNA RPE-1 cells that were treated with Pevonedistat for 48 h. PCNA patterns and 53BP1 foci are shown. Scale bar, 10 µm. (k) High-content microscopy derived cell cycle profiles of U-2 OS cells depleted of Geminin for 72 h. The percentage of hyperploid cells (> 4 N DNA content, marked by the dashed vertical line) is indicated. (l) Scatter plot of total DAPI intensity of normal G2 cells and Geminin depleted cells that underwent either endo- or re-replication. (m) Scatter plot of mean nuclear intensity of γH2AX of normal G2 cells and Geminin depleted cells that underwent either endo- or re-replication. (n) As in (m) for p53. (o) As in (m) for p21. (p) As in (m) for pRb. Statistical analysis was performed with two-tailed unpaired t-test between endo- and re-replication. Horizontal solid lines represent the mean and horizontal dashed lines represent standard deviation. Source data
Extended Data Fig. 10
Extended Data Fig. 10. Oncogene-induced polyploidization.
(a) Western blot analysis of 53BP1-PCNA U-2 OS cells overexpressing HRAS. (b) Western blot analysis of 53BP1-PCNA U-2 OS cells overexpressing Cyclin E1. (c) DNA fibre analysis of 53BP1-PCNA U-2 OS cells overexpressing either HRAS or Cyclin E1. Statistical analysis by one-way ANOVA followed by Tukey’s post hoc test. (d) Analysis of micronuclei induction in 53BP1-PCNA U-2 OS cells overexpressing either HRAS or Cyclin E1 compared to empty vector transfected control cells. Mean ± SD are depicted. Statistical analysis was performed with one-way ANOVA followed by Tukey’s post hoc test. (e) Single cell lineage from empty vector control 53BP1-PCNA U-2 OS cells. PCNA foci, 53BP1 foci and area of the nucleus over 70 h of live imaging are depicted. Sequential staining intensities from individual cells of the lineage and mean intensities from the corresponding reference population are depicted for the markers pRB, γH2AX, p21 and p53. The total DAPI intensity of the nucleus from the corresponding reference population is depicted as well as from the single cells at the end of live imaging. (f) Single cell lineage from 53BP1-PCNA U-2 OS cells overexpressing HRAS. Live+QIBC data is shown as in (e). (g) Single cell lineage from 53BP1-PCNA U-2 OS cells overexpressing Cyclin E1. Live+QIBC data is shown as in (e). (h) Single cell lineage from 53BP1-PCNA cells overexpressing Cyclin E1. Live+QIBC data is shown as in (e). Representative images of the polyploid cells are included as well as their position within the DAPI scatter plot of the G1 and G2 populations. Scale bars, 10 µm. Box plot limits indicate 25th percentile (Q1) and 75th percentile (Q3); boxes represent interquartile range (IQR, Q3-Q1) with medians (solid lines). Whiskers define lower and upper adjacent value; dots show outliers greater than Q3 + 1.5xIQR. For gel source data, see Supplementary Fig. 1. Source data
Extended Data Fig. 11
Extended Data Fig. 11. Polyploidization upon oncogene overexpression.
(a) High-content microscopy derived cell cycle profiles of 53BP1-PCNA U-2 OS cells overexpressing either HRAS or Cyclin E1 that were treated or not with 4 Gy of IR. The percentage of hyperploid cells (> 4 N DNA content, marked by the dashed vertical line) is indicated. (b) Representative images of 53BP1-PCNA U-2 OS cells overexpressing HRAS with increased ploidy (2 N, 4 N, 8 N). Scale bar, 10 µm. (c) Bar chart depicting the percentage of polyploid cells overexpressing either HRAS or Cyclin E1 that were treated or not with 4 Gy of IR. Statistical analysis was performed with one-way ANOVA followed by Tukey’s post hoc test. (d) Cell cycle resolved EdU profiles of 53BP1-PCNA U-2 OS cells overexpressing HRAS or Cyclin E1. Cells were either untreated or treated with 4 Gy of IR. (e) Video stills of 53BP1-PCNA U-2 OS cells overexpressing HRAS that are maintaining polyploidy through multiple cell generations. The polyploid granddaughter cells with 8 N DNA content are identified in a scatter plot of mean vs total DAPI intensity post live imaging. (f) Representative single cell lineages from live imaging of 53BP1-PCNA U-2 OS cells that overexpress HRAS. Lineages depict endo-replication and re-replication, respectively. (g) Western blot validation of inducible expression of Cyclin E1 in 53BP1-PCNA RPE-1 cells. Cells were induced with Doxycycline (100 ng/ml) for 24 h. (h) High-content microscopy derived cell cycle profiles of 53BP1-PCNA RPE-1 with inducible expression of Cyclin E1. The percentage of hyperploid cells (> 4 N DNA content, marked by the dashed red vertical line) is indicated. Scale bars, 10 µm. For gel source data, see Supplementary Fig. 1. Source data
Extended Data Fig. 12
Extended Data Fig. 12. Re- and endo-replication upon oncogene overexpression.
(a) Single cell lineage from control 53BP1-PCNA RPE-1 cells without Dox-induced Cyclin E1 expression. PCNA patterns and 53BP1 foci are depicted. Sequential staining intensities from individual cells of the lineage and mean intensities from the corresponding reference population are depicted for the markers pRB, γH2AX, p21 and p53. The total DAPI intensity of the nucleus from the corresponding reference population is depicted as well as from the single cells at the end of live imaging. (b) Single cell lineage from 53BP1-PCNA RPE-1 cells with Dox-induced Cyclin E1 expression (100 ng/ml Doxycycline for 24 h). Box plot limits indicate 25th percentile (Q1) and 75th percentile (Q3); boxes represent interquartile range (IQR, Q3-Q1) with medians (solid lines). Whiskers define lower and upper adjacent value; dots show outliers smaller than Q1 – 1.5 × IQR and greater than Q3 + 1.5 × IQR. (c) Analysis of endo- and re-replication frequency in asynchronously growing 53BP1-PCNA U-2 OS cells that received IR (4 Gy) either in G1 or in G2. Means and individual values from two independent live cell experiments are shown. Source data

References

    1. Buenrostro, J. D. et al. Single-cell chromatin accessibility reveals principles of regulatory variation. Nature523, 486–490 (2015). - PMC - PubMed
    1. Eling, N., Morgan, M. D. & Marioni, J. C. Challenges in measuring and understanding biological noise. Nat. Rev. Genet.20, 536–548 (2019). - PMC - PubMed
    1. Alexandrov, L. B. et al. The repertoire of mutational signatures in human cancer. Nature578, 94–101 (2020). - PMC - PubMed
    1. Koh, G., Degasperi, A., Zou, X., Momen, S. & Nik-Zainal, S. Mutational signatures: emerging concepts, caveats and clinical applications. Nat. Rev. Cancer21, 619–637 (2021). - PubMed
    1. Ushijima, T., Clark, S. J. & Tan, P. Mapping genomic and epigenomic evolution in cancer ecosystems. Science373, 1474–1479 (2021). - PubMed

LinkOut - more resources