. 2025 Jun;642(8068):672-681.
doi: 10.1038/s41586-025-09031-w. Epub 2025 May 21.

Sequence diversity lost in early pregnancy

Collaborators, Affiliations

Sequence diversity lost in early pregnancy

Gudny A Arnadottir et al. Nature. 2025 Jun.

Abstract

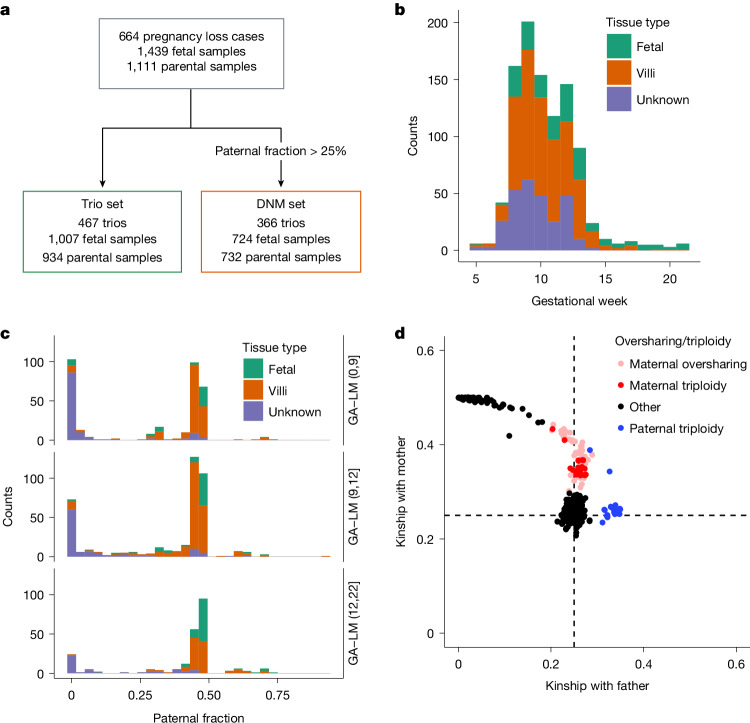
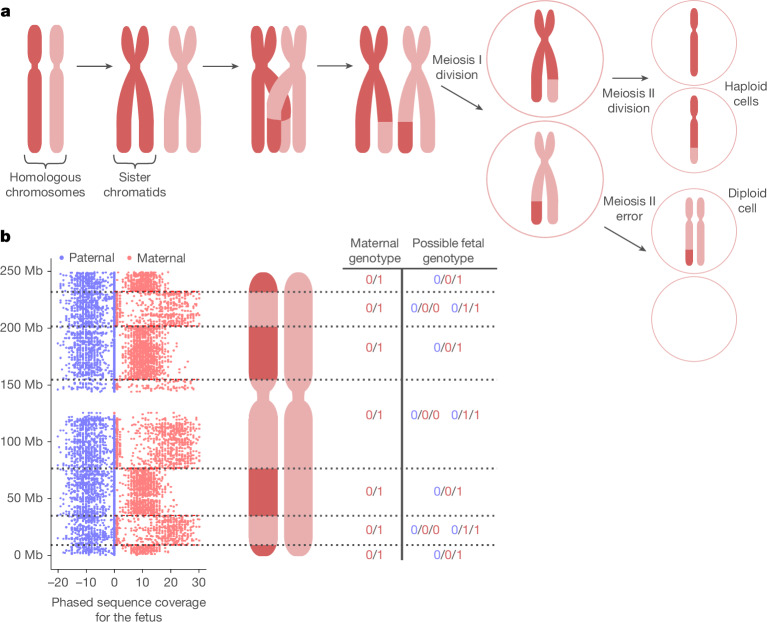
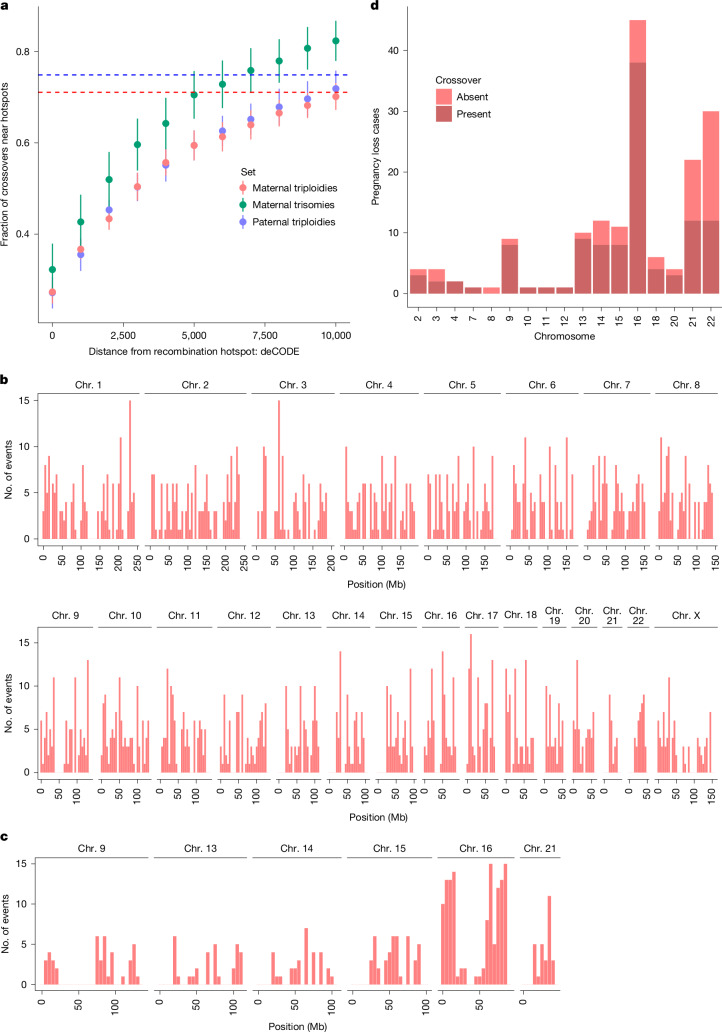
Every generation, the human genome is shuffled during meiosis and a single fertilized egg gives rise to all of the cells of the body1. Meiotic errors leading to chromosomal abnormalities are known causes of pregnancy loss2,3, but genetic aetiologies of euploid pregnancy loss remain largely unexplained4. Here we characterize sequence diversity in early pregnancy loss through whole-genome sequencing of 1,007 fetal samples and 934 parental samples from 467 trios affected by pregnancy loss (fetus, mother and father). Sequenced parental genomes enabled us to determine both the parental and meiotic origins of chromosomal abnormalities, detected in half of our set. It further enabled us to assess de novo mutations on both homologous chromosomes from parents transmitting extra chromosomes, and date them, revealing that 6.6% of maternal mutations occurred before sister chromatid formation in fetal oocytes. We find a similar number of de novo mutations in the trios affected by pregnancy loss as in 9,651 adult trios, but three times the number of pathogenic small (<50 bp) sequence variant genotypes in the loss cases compared with adults. Overall, our findings indicate that around 1 in 136 pregnancies is lost due to a pathogenic small sequence variant genotype in the fetus. Our results highlight the vast sequence diversity that is lost in early pregnancy.


Conflict of interest statement

Competing interests: The authors affiliated with deCODE genetics/Amgen declare competing financial interests as employees.

Figures

Fig. 1
Fig. 1. Sequencing overview and fetal presence in pregnancy loss samples.
a, Flowchart of the study. b, The gestational ages of fetal samples. The gestational age was estimated as the time difference from the last menstruation to the date of pregnancy loss. c, The paternal fraction of fetal samples. The paternal fraction is shown for intervals of gestational age estimated on the basis of the last menstruation (GA–LM): weeks 0–9, weeks 9–12 and weeks 12–22. d, Kinship between fetal and parental samples. There are 26 (11 pregnancy loss cases) and 93 (59 pregnancy loss cases) fetal samples that had higher than expected kinship with their father and mother, respectively. Furthermore, there are 27 (11 pregnancy loss cases) and 42 (19 pregnancy loss cases) fetal samples from paternal and maternal triploidies, respectively. Source Data
Fig. 2
Fig. 2. Maternal triploidy example.
a, Schematic of meiosis II error. Meiosis I error is shown in Extended Data Fig. 1. b, Maternal crossovers at chromosome 2 for a triploid fetus. The phase-informative sequence variants in the fetal genome are informative about transitions between the homologous chromosome and sister chromatid states along the genome. The phase-informative variants are limited to heterozygous (0/1) variants in the mother (1 is the HS allele). In the homologous state, the maternal variants are always present in the fetal genome (0/0/1), as both of the maternal haplotypes are present. In the sister state, the maternal variants are either absent (0/0/0) or have an allelic balance of 2/3 (0/1/1).
Fig. 3
Fig. 3. Characterization of triploidies, aneuploidies and CNVs.
a, The number and distribution of phased trisomies/monosomies. CNVs are shown in Supplementary Fig. 3. X monosomies are depicted as the loss of the X chromosome (chr.) as we cannot discern between paternal loss of Y and X. b, Translocation of chromosome 15 and chromosome 16. The panels by row are fetal samples from the same pregnancy loss. c, Translocations of 8q. In two pregnancy loss cases, we find pairs of duplications/deletions on chromosome 8 that are probably translocations of 8q. Top, a pregnancy loss in which the mother transmitted the unbalanced translocation. Bottom, a pregnancy loss with a paternally transmitted translocation. The horizontal lines in b and c are the genome-wide averages of the phased coverage. d, Centromere state for trisomies. e, The number of centromeres in a homologous state per triploid case. Source Data
Fig. 4
Fig. 4. Crossovers detected in aneuploidies and triploidies.
a, Hotspot use of crossovers in pregnancy loss. The dashed lines are the sex-specific use of hotspots from a previous study (male is blue and female is red). The points are the mean values and vertical error bars are the 95% CIs based on a block jackknife procedure. There are 11 paternal triploidies, 16 maternal triploidies and 110 maternal trisomies with detected crossovers. b, Crossover locations in maternal triploidies. The crossover locations in paternal triploidies are shown in Extended Data Fig. 2. c, Crossover locations in trisomies. d, Chromosomes with or without a crossover in maternal trisomies. Source Data
Fig. 5
Fig. 5. DNMs detected in pregnancy loss.
a, The number of DNMs against the allelic balance per fetal sample. Only fetal samples with low maternal contamination and no detected triploidies were used (Extended Data Fig. 4 includes all samples). b, The paternal fraction of DNMs based on the chromosomal status of the DNM. The estimates are based on 366 (total), 143 (euploid), 337 (chromosome pairs), 11 (triploid father), 18 (triploid mother) and 131 (trisomy mother) unique pregnancy loss cases. c, The number of DNMs per fetal sample against paternal age at conception. The shaded areas represent 95% CIs. See Extended Data Fig. 5 for tissue type colouring. d, A mutation occurring before the formation of sister chromatids (pre-sister) is expected to have an allelic balance of 2/3 in the sister state. A mutation occurring after sister formation (post-sister) is expected to have a 1/3 allelic balance. Paternal triploidies caused by spermatozoa from two distinct spermatogonia fertilizing the oocyte are expected to have mutations in 1/3 allelic balance (Extended Data Fig. 9). e, The allele balance of DNMs conditioned on the sister chromatid state. The vertical line indicates an allelic balance of 50%. Both states are shown in Extended Data Fig. 8. f, Mutation classes of DNMs based on chromosomal status. The asterisk denotes the only significant comparison after multiple-testing correction (P = 0.0002 < 0.05/72) and the block jackknife procedure. The number of DNMs per combination of mutation class and chromosome group are reported above the bars. The numbers of unique pregnancy loss cases for the chromosome sets are 331 (euploid/chromosome pairs), 131 (trisomy–mother), 11 (triploid–father) and 18 (triploid–mother). For b and f, data are mean ± 95% CI based on a block jackknife procedure. Source Data
Extended Data Fig. 1
Extended Data Fig. 1. Schematic view of meiosis I error.
Missegregation of homologous chromosome during meiois I. See Fig. 2 for meiosis II error.
Extended Data Fig. 2
Extended Data Fig. 2. Crossover locations in paternal triploidies.
See Fig. 4b for the crossover locations in maternal triploidies.
Extended Data Fig. 3
Extended Data Fig. 3. Spectra of DNMs present in single/multiple fetal samples.
Here, we restricted to pregnancy losses with multiple fetal samples and aggregated the DNMs based on whether they were present in a single sample or in multiple samples per mutation class. For comparison, the bottom panel is the mutational spectrum for DNMs identified in Icelanders.
Extended Data Fig. 4
Extended Data Fig. 4. Number of DNMs as a function of allelic balance.
Aggregation was done on the fetal sample level and the entire DNM set was used.
Extended Data Fig. 5
Extended Data Fig. 5. Number of DNMs per fetal sample, tissue type and pathogenic carrier status against paternal age at conception.
The black line is the regression line from the Icelandic set, the coloured lines are regression lines for subsets of the COPL cohort and the shaded areas represent 95% CIs. a, all fetal samples regardless of karyotype. b, excluding triploidies. c, only triploidies. d, same as b but coloured according to whether the fetus is a carrier of a pathogenic DNM.
Extended Data Fig. 6
Extended Data Fig. 6. Paternal ages at conception.
a, the parental ages at conception for the pregnancy losses. b, the parental ages at conception for the Icelandic set. c-d, histogram of the parental ages at conception for the pregnancy losses. e-f, histogram of the parental ages at conception for the Icelandic set.
Extended Data Fig. 7
Extended Data Fig. 7. Age regression - Poisson shared intercept/slopes models.
The analysis restricted to non-triploid samples with 95% power of detecting DNMs. a, paternal age effect. b, maternal age effect. c, shared intercept at conception. d, shared intercept at onset of puberty (13 years). e, villi coefficient. f, deCODE vs COPL-villi difference against deCODE vs COPL-non-villi difference. In f, the age effects are shared across the COPL and the deCODE cohorts, the intercept is shared between the sexes and the regression is done separately per mutational class. In a-d and f the solid lines are identity lines. The centres represent means and error bars are 95%-CIs based on a Block-Jackknife procedure. The estimates are based on 293 pregnancy loss trios and 9,430 Icelandic trios.
Extended Data Fig. 8
Extended Data Fig. 8. Allele balance of DNMs conditioned on sister chromatid or homologous chromosome state.
Extended version of Fig. 5e with both sister chromatid and homologous chromosome state. The vertical line is an allelic balance of 50%.
Extended Data Fig. 9
Extended Data Fig. 9. Schematic overview of dispermy derived from a single spermatogonium or distinct spermatogonia.
Paternal triploidies caused by spermatozoa from the same spermatogonium fertilizing the oocyte are expected to have pre-sister mutations in 2/3 allelic balance. For distinct spermatogonia the allelic balance of pre-sister and post-sister mutations will be the same, i.e. 1/3.
Extended Data Fig. 10
Extended Data Fig. 10. Expression of genes mutated in euploid versus aneuploid/ triploid fetuses.
Based on fetal tissue expression data from Cao et al., showing expression for 15 fetal tissues for n = 16 genes mutated in euploid fetuses and n = 16 genes mutated in aneuploid/triploid fetuses. Genes mutated in euploid fetuses are on average more highly expressed in fetal tissues than genes mutated in aneuploid/triploid fetuses. The box plots show the median expression value (transcripts per million), limits correspond to the first (25%) and third (75%) quartiles, and whiskers extend to the smallest and lowest values observed, limiting to 1.5 times the interquartile range.

References

    1. Gruhn, J. R. & Hoffmann, E. R. Errors of the egg: the establishment and progression of human aneuploidy research in the maternal germline. Annu. Rev. Genet.56, 369–390 (2022). - PubMed
    1. Sahoo, T. et al. Comprehensive genetic analysis of pregnancy loss by chromosomal microarrays: outcomes, benefits, and challenges. Genet. Med.19, 83–89 (2017). - PubMed
    1. McCoy, R. C. et al. Meiotic and mitotic aneuploidies drive arrest of in vitro fertilized human preimplantation embryos. Genome Med.15, 77 (2023). - PMC - PubMed
    1. Finley, J. et al. The genomic basis of sporadic and recurrent pregnancy loss: a comprehensive in-depth analysis of 24,900 miscarriages. Reprod. BioMed. Online45, 125–134 (2022). - PubMed
    1. Waldvogel, S. M., Posey, J. E. & Goodell, M. A. Human embryonic genetic mosaicism and its effects on development and disease. Nat. Rev. Genet.10.1038/s41576-024-00715-z (2024). - PMC - PubMed

LinkOut - more resources