. 2025 May 21;13(1):109.
doi: 10.1186/s40478-025-02038-4.

Distinct characteristics of brain metastasis in lung adenocarcinoma: development of high-confidence cell lines

Affiliations

Distinct characteristics of brain metastasis in lung adenocarcinoma: development of high-confidence cell lines

Jintao He et al. Acta Neuropathol Commun. .

Abstract

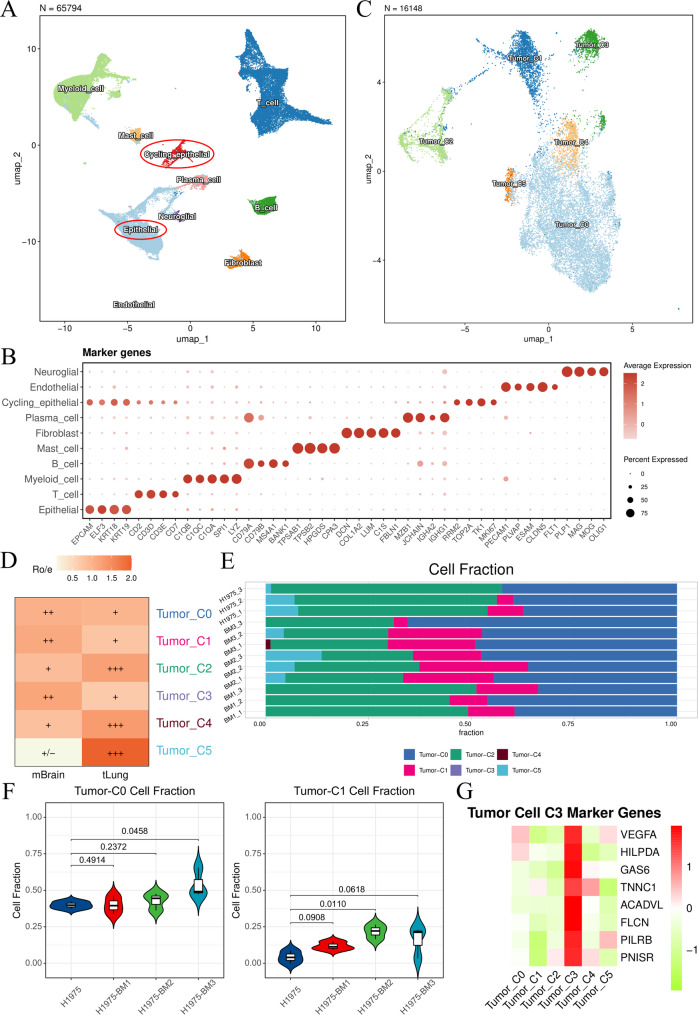
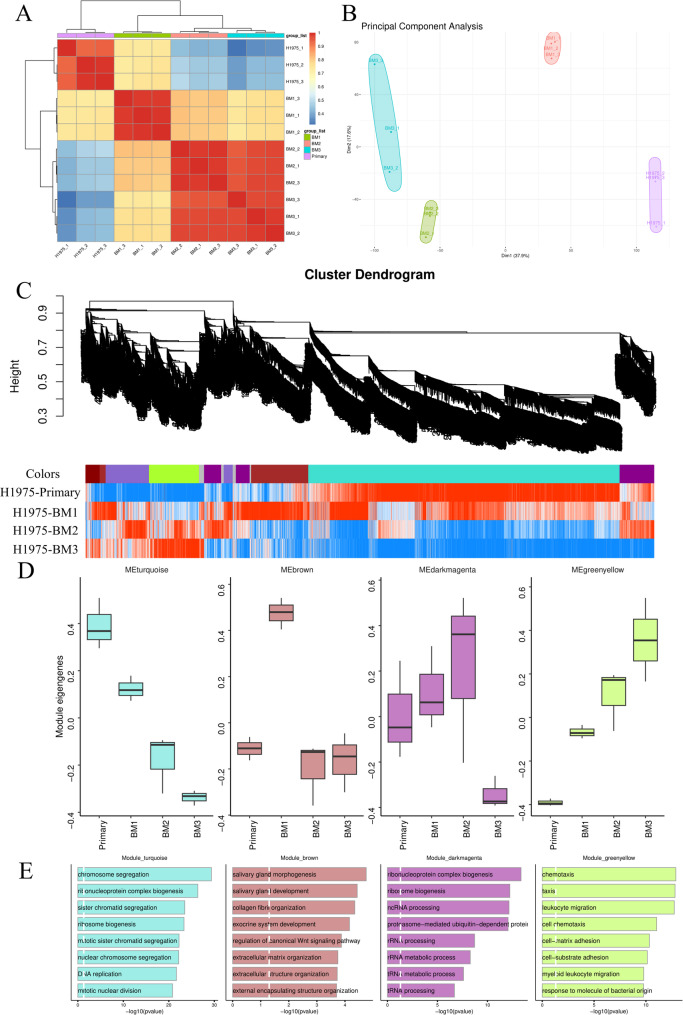
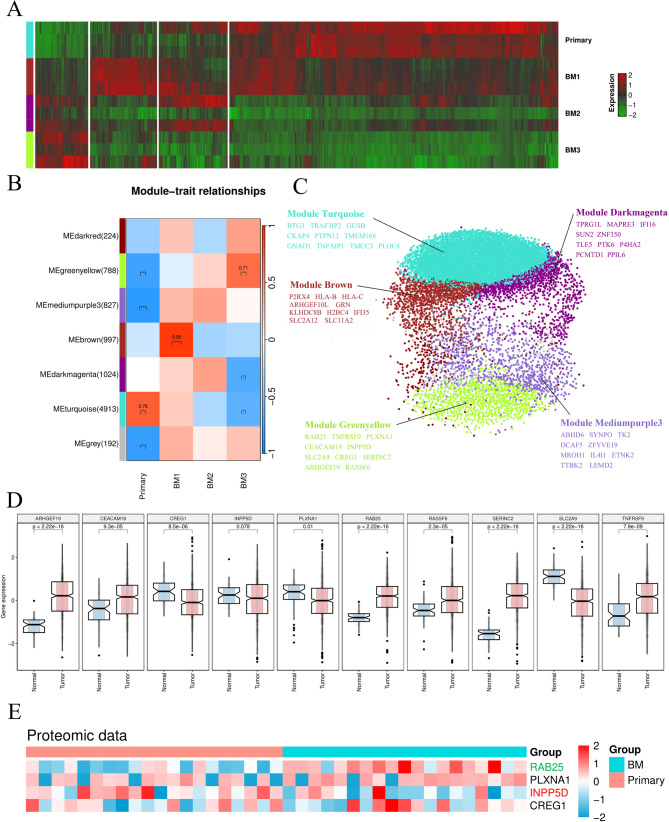
Lung cancer is a leading cause of cancer-related deaths worldwide, with brain metastasis occurring in approximately 30-55% of patients, particularly in lung adenocarcinoma. Due to the challenges in obtaining genuine brain metastasis tumor cells, researchers commonly use nude mouse models to establish brain metastasis cell lines, though traditional methods have limitations such as high costs, lengthy timeframes, and the need for specialized imaging equipment. To address these issues, we developed an improved approach by performing low cell number circulating intracranial injections (500-4000 cells) in nude mice, successfully establishing the H1975-BM1, BM2, and BM3 cell lines. Through RNA sequencing and bioinformatics analyses, we identified transcriptomic differences among these cell lines, revealing that H1975-BM1 cells primarily exhibit stem cell function and migration characteristics, while H1975-BM3 cells display enhanced chemotaxis, cell adhesion, and cytokine secretion associated with interactions. Experimental validation, including Transwell assays, CCK8, cell adhesion assays, and subcutaneous tumor implantation in nude mice, further confirmed these findings, with H1975-BM3 forming larger tumors and a more pronounced secretion cystic cavity. In conclusion, our improved methodology successfully established high-confidence brain metastasis lung adenocarcinoma cell lines, elucidating distinct transcriptomic and functional characteristics at different stages of brain metastasis progression.

Keywords: Brain metastasis; Cell lines; Lung adenocarcinoma; Transcriptomic analysis.


Conflict of interest statement

Declarations. Ethics approval and consent to participate: All animal experiments were conducted in compliance with the guidelines of Hokkaido University Manual for Implementing Animal Experimentation with the approval (No. 17–0061, 22–0089) of Institutional Animal Care and Use Committee at Hokkaido University, Sapporo, Japan. Consent for publication: Not applicable. Competing interests: The authors declare no competing interests.

Figures

Fig. 1
Fig. 1
Intracranial Serial Injection and Brain Metastatic Potential Validation. A. Schematic diagram of the overall process for generating BM cell lines. B. Diagram of the intracranial injection site. C. Kaplan–Meier survival curve of mice. D. In vivo imaging showing the tumor growth site in mice, the survival time of mice is marked in the lower left corner
Fig. 2
Fig. 2
Phenotypic Differences of BM Cell Lines under In Vitro Conditions. A. Cell migration assay; cells that crossed the membrane were stained with crystal violet (scale bar: 100 μm) B & C. Cell adhesion assay; the major axis of cell clusters was measured and statistically compared. p-values are indicated (scale bar: 100 μm). D. Cell proliferation assay.
Fig. 3
Fig. 3
Subcutaneous Tumor Xenograft Experiments Reveal Phenotypic Differences between BM1 and BM3 Cell Lines. A. Schematic diagram of the subcutaneous tumor xenograft workflow. B. Appearance of the tumor samples. C. Measurement and calculation of both overall volume and solid tumor volume. D. Statistical significance of the differences between groups is shown (p-values indicated)
Fig. 4
Fig. 4
Validation of Similarity with Clinical Samples. A. Dimensionality reduction and clustering annotated 10 distinct cell types. B. Display of marker genes for different cell types. C. Reanalysis of tumor cells (circled in red in A) revealed that they can be divided into six subgroups. D. The Ro/e index was calculated to assess the distribution bias of tumor cell subgroups between BM-LUAD samples (mBrain) and primary LUAD samples (tLung). +++ for Ro/e > 1.2; ++ for 1 < Ro/e ≤ 1.2; + for 0.6 ≤ Ro/e ≤ 1; +/− for 0 < Ro/e < 0.6 E. Proportions of tumor cell subgroups in the BM cell line samples. F. Statistical analysis of the BM-specific subgroups cell fraction; p-values are provided. G. Display of key marker genes in the tumor cell C3 subgroup
Fig. 5
Fig. 5
Identification of Specific Transcriptomic Modules in BM Cell Lines. A. A clustered heatmap displays the correlation among BM cell line samples. B. Principal component analysis of all BM cell line samples, with samples from the same cell line highlighted in the same color. C. The hierarchical clustering tree depicts co-expression modules identified using WGCNA. Each branch represents a module and is labeled with a color, as shown in the first color band beneath the tree. The additional color bands indicate transcripts that are highly correlated (red) or anti-correlated (blue) in the BM cell lines. D. Box plots present the distribution of module correlations across different BM cell lines. E. A bar chart shows the top eight representative gene ontology terms enriched in the specific module, with the horizontal axis representing significance
Fig. 6
Fig. 6
Key Hub Genes in the Gene Network. A. A heatmap shows the gene expression patterns of the modules with the highest correlation across different cell lines. B. All modules are displayed and statistically tested; the turquoise module is significantly associated with the parental cell line, the brown module with the BM1 cell line, and the greenyellow module with the BM3 cell line, while the BM2 cell line lacks any statistically significant modules. *: 0.01 < p < 0.05; **: 0.001 < p ≤ 0.01; ***: 0.0001 < p ≤ 0.001; ****: p ≤ 0.0001. C. A gene expression network was constructed based on the correlations among all genes in the module, and the top 10 hub genes were identified. D. The top 10 hub genes from the BM3-specific greenyellow module were extracted, and their expression in tumor tissue versus normal lung tissue was examined using TCGA-LUAD data, with p-values provided. E. Protein expression corresponding to the hub genes was assessed using proteomic data (ProteomeXchange: PXD027259); INPP5D is significantly overexpressed in primary LUAD, while RAB25 is significantly overexpressed in BM-LUAD

References

    1. Aceto N, Bardia A, Miyamoto DT, Donaldson MC, Wittner BS, Spencer JA, Yu M, Pely A, Engstrom A Zhu H (2014) Circulating tumor cell clusters are oligoclonal precursors of breast cancer metastasis. Cell 158: 1110–1122 10.1016/j.cell.2014.07.013 - PMC - PubMed
    1. Achrol AS, Rennert RC, Anders C, Soffietti R, Ahluwalia MS, Nayak L, Peters S, Arvold ND, Harsh GR, Steeg PS et al (2019) Brain metastases. Nat Rev Dis Primers 5: 5 10.1038/s41572-018-0055-y - PubMed
    1. Baran Y, Bercovich A, Sebe-Pedros A, Lubling Y, Giladi A, Chomsky E, Meir Z, Hoichman M, Lifshitz A, Tanay A (2019) MetaCell: analysis of single-cell RNA-seq data using K-nn graph partitions. Genome Biol 20:206. 10.1186/s13059-019-1812-2 - PMC - PubMed
    1. Bray F, Laversanne M, Sung H, Ferlay J, Siegel RL, Soerjomataram I, Jemal A (2024) Global cancer statistics 2022: GLOBOCAN estimates of incidence and mortality worldwide for 36 cancers in 185 countries. CA Cancer J Clin 74:229–263. 10.3322/caac.21834 - PubMed
    1. Chen S (2023) Ultrafast one-pass FASTQ data preprocessing, quality control, and deduplication using Fastp. Imeta 2:e107. 10.1002/imt2.107 - PMC - PubMed

Publication types

Grants and funding

LinkOut - more resources